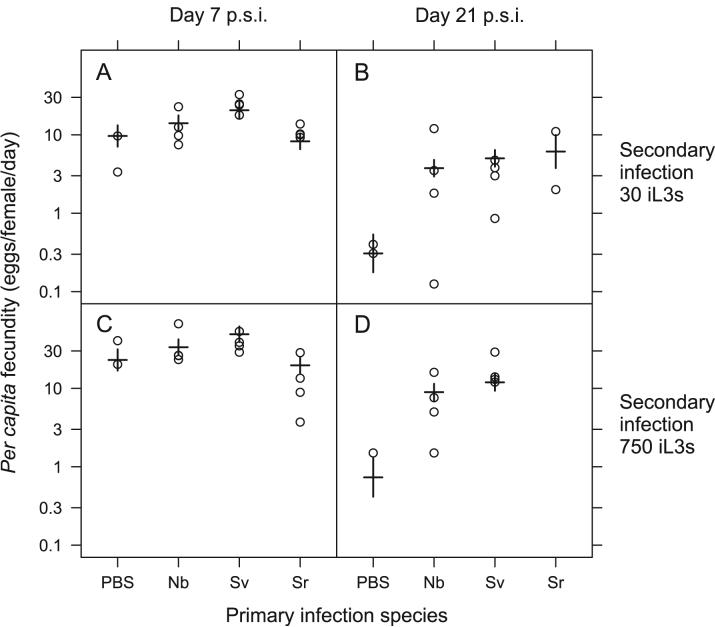
Figure 2.
The S. ratti per capita fecundity for con- or hetero-specific primary infections and secondary S. ratti infections at doses of 30 iL3s (A, B) and 750 iL3s (C, D) and at days 7 (A, C) and 21 p.s.i. (B, D). Results for individual animals are circles, with model estimates from Table 2 shown as horizontal bars with standard errors on these estimates indicated by vertical bars. Data are plotted on a log scale. The primary infections were: PBS controls (PBS), N. brasiliensis (Nb), S. venezuelensis (Sv) and S. ratti (Sr). The different doses delivered in the primary infection (Table 1) for each species are grouped together since the dose of the primary infection had no detectable effect on the per capita fecundity of S. ratti secondary infections.

