

Abstract
This study is part of a research program that aims at a better understanding of the influence of individual morphological differences and physical growth on development of independent walking in toddlers. As morphometric and segment inertial parameters for toddlers aged between 15 and 36 months are indispensable for the mechanical analyses inherent to this purpose, parameter data were collected. The provided dataset of morphological and segment inertial parameters is a valuable tool for locomotor biomechanical modelling. Analysis of the parameter data showed that there are substantial changes of most segment inertial parameters across body length and body mass. In addition, a classification system was developed to categorize toddlers on the basis of morphometry, reflecting the segment inertial constitution of the child. A principal components analysis (PCA) was applied to define the variance in physique between the children. PCA resulted in three newly composed variables: the ‘Axis of chubbiness’, the ‘Axis of allometric growth’ and the ‘Axis of relative limb length’. The three axes are plotted against each other, resulting in eight morphological classes. With this classification the morphotype of toddlers between 15 and 36 months can be specified and used for further research on their walking patterns.
Keywords: child, classification, inertial parameters, morphology, preschool
Introduction
In agreement with the neuromechanical concept, goal-directed movements are the result of the combined action of mechanical and neural control (Enoka, 2002; Niskikawa et al. 2007). Mechanical control is determined by the architecture of the musculo-skeletal system, mechanical properties of the body (segment inertia, tissue properties, etc.) and physiological characteristics of the muscle–tendon systems (Duysens et al. 2002; Dietz, 2002). During movement, dynamic equilibrium can only be maintained if gravitational and inertial forces and moments are balanced by net joint moments and forces. This implies that changes in segment inertial properties of the body affect either the control or the movement outcome to maintain dynamic equilibrium as governed by Newton's laws.
Rapid changes in segment inertial properties are characteristic for ontogeny. Examples in the animal kingdom show that if the musculo-skeletal properties of young animals change through allometric growth, their locomotion pattern can adjust to these changes. Research on rabbits (Carrier, 1983), emus (Main & Biewener, 2004a), goats (Main & Biewener, 2004b) and baboons (Raichlen, 2005) showed that young animals with juvenile morphological properties move in a different way than do their mature conspecifics.
To investigate the relation between control of movement and ontogenetic growth, a species showing striking morphological changes during an extended period of motor development is the most appropriate. Obviously, these conditions are met during early childhood in humans. In the first year and a half of life, movement capacities of human infants change drastically. They start as relatively immobile newborns, barely able to lift their heads against gravity, and become toddlers who crawl, walk and climb and use their arms for reaching and grasping objects (McGraw, 1943; Adolph et al. 2003). In the context of the dynamic system theory, Thelen et al. (1989) suggest that there are many contributing factors to the motor development of an infant. For example the onset and progression of movements could be affected by the size, weight and inertia of segments (Jensen, 1993). Results of previous research provide information on the growth of segment principal moments of inertia during infancy (1–18 months of age; Jensen & Nassas, 1988; Sun & Jensen, 1994) and from childhood to adolescence (4–20 years; Schneider & Zernicke, 1992; Chester & Jensen, 2005). To our knowledge, however, information about inertial parameters of segments is not available for toddlers between 15 and 36 months, which is the critical age for the development of important motor skills such as walking and running. Several researchers emphasized the potential importance of anthropometric characteristics for the development of locomotion (Shirley, 1931; Garn, 1966; Erbaugh, 1984; Thelen et al. 1989). Therefore, systematic analyses of the relationship between motor development and specific measures of size, body proportions, and body composition during early childhood are needed (Malina, 2004).
This study is part of a research program that aims at a better understanding of the influence of individual morphological differences and physical growth on motor development of bipedal gait in toddlers. Because morphological and segment inertial parameters for toddlers aged between 15 and 36 months are indispensable for the mechanical analyses inherent to this purpose, the first objective of this study is the collection and presentation of such data. In the future, systematic analyses of the relationship between motor development and specific measures of size, body proportions and body composition during early childhood will be done, but this lies beyond the scope of this paper.
Moreover, to study the influence of morphological differences on gait in toddlers, a procedure for selecting children with different body types is needed. Existing methods for somatotyping, such as the method of Heath-Carter, could not be used because they are inappropriate for children under 6 years of age (Malina, 2004; Carter & Heath, 1990). Therefore, the second aim of this study is to present a way to classify toddlers on the basis of morphometry, reflecting the inertial constitution of the child. This method will be a practical tool to select children with differences in body build for further research on the development of walking patterns in toddlers.
Materials and methods
Subjects
One hundred healthy toddlers between 15 and 36 months of age participated in the study. Written informed consent was obtained from the parents. According to the Denver development-screening test (Barnes & Starck, 1975) all toddlers showed normal psychomotor, cognitive and affective development. The exclusion criteria were: duration of pregnancy shorter than 38 weeks, birth weight less than 2.5 kg or severe illness during the first year of life. The study was approved by the Ethical Committee of the University of Antwerp.
Morphology
Anthropometric measurements
For each subject, information was obtained on body mass, body length, circumferences of the head, upper arm and leg, length of the arm and leg and skin folds of upper arm, leg and belly. Body length was measured directly from standing posture. All measurements were taken according to standard procedures (Malina, 2004). Body mass index (BMI) was calculated together with another measure of overall chubbiness, the ponderal index (PI) (Adolph et al. 2003).
PI was computed by using the following formula:
As it was not safe to use callipers with these young children, further measurements were taken from two pictures (Fig. 1). It was impossible to use a standardized camera position because pictures were taken at different locations. Standardization of the photographs was done with a digitization program (TpsDig version 2.10) by scaling to body length. The body was divided into nine segments (head, thorax, pelvis, upper arm, forearm, hand, thigh, leg and foot). Seven linear measurements were made of each segment: total segment length and proximal, medial and distal diameters in both the sagittal and frontal plane. These measurements were used to determine the inertial properties of the body segments with a geometric model based on the model of Crompton et al. (1996). The segment mass and location of the centre of mass, relative to the segment length with respect to the more proximal joint, were calculated as well as the three principal moments of inertia. The first moment of inertia (Ix) is around the coronal axis, which lies in the frontal plane. The second (Iy) is the moment of inertia around the sagittal axis in the sagittal plane. The third moment of inertia (Iz) is around the longitudinal axis. Compared to Ix and Iy, Iz of the limb segments is very small and consequently rather sensitive to errors. As axial rotations of limb segments are also of less importance for locomotor studies (Schoonaert et al., 2007), Iz is not considered further. As segment-specific densities for toddlers and infants are unavailable, density was assumed to be 1 kg m−3 for all segments. We did not use adult segment density data because they were measured only on male cadavers. The density of the segments of children between 15 and 36 months is lower than that of adults because of a higher ratio of fat to muscular and body tissue (Thelen & Fisher, 1982). The use of the male cadaver data would only make the difference between estimated and measured mass greater. Due to the small size of the hands and feet of the children, and the fact that they were often invisible on the photos, it was impossible to make accurate measurements of these segments. Therefore the inertial properties of hands and feet could not be calculated.
Fig. 1.

Two standardized pictures of a child for obtaining morphometrical data. In toddlers, morphometrical data had to be obtained from pictures, since it was not safe to use callipers. The thin lines determine the segment boundaries, the broken lines mark the distance which is used to scale the picture to body length.
Measure for chubbiness
For the description of the physique of a child a useful measure to estimate chubbiness is needed. The linear regression between body mass and body length was calculated. Residuals of this regression give a good idea of the chubbiness of a child as a function of his length, but they aren't easy to interpret and they are difficult to recalculate in case the physique of a new child needs to be characterized. Therefore linear regressions between these residuals and more practical measures like BMI, PI and skin fold measurements were computed.
Statistical analysis
To compare morphology between boys (n = 55) and girls (n = 45) a multivariate anova was performed with age included as a covariable and gender as a fixed factor. The interaction between age and gender was also tested. Changes in morphological and segment inertial parameters during growth were modelled through linear regressions with body length. Changes in segment masses were modelled through linear regressions with body mass. Statistical significance was set at P < 0.05. All statistical analyses were performed in SPSS 13.0 for Windows.
Principal components analysis
A principal components analysis was applied to define the variance in physique between the children and to extract the relevant information in the high-dimensional dataset by considering only those principal components that explain a high fraction of the variance (Daffertshofer et al. 2004). The set of variables to enter into the PCA was selected on the base of several criteria. Firstly, variables had to describe the constitution of a child in detail. Second, the morphological classification, which will result from the PCA, will be used for further research on walking patterns in toddlers. Therefore those variables were selected that possibly had an effect on gait. Finally, variables had to be easy to measure so that in the future other children can be classified in a relatively simple way. Based on these criteria, 13 variables were selected: BMI, head circumference, length and proximal width of the thorax, proximal width of the pelvis, length and width of upper arm, forearm, thigh and leg. BMI was chosen as the best measure for chubbiness, according to the outcome of the regressions (see Results). To calculate the width of the segments (upper arm, forearm, thigh and leg) the average of proximal, medial and distal diameters in both sagittal and frontal plane was computed. The average of two proximal measurements of the thorax in the sagittal and frontal plane was used to estimate the proximal diameter of this segment. The proximal diameter of the pelvis was calculated in the same way. Data from two standardized pictures of 65 children were used. For the head only head circumference was taken into account.
Because we were interested not in differences in total body length but in differences in shape and physique, the variables were standardized to body length before they were entered in the PCA. An orthogonal rotation method was chosen for the PCA (the ‘varimax’ rotation) that minimizes the number of variables with high loadings on each factor. It simplifies the interpretation of the factors. Newly composed variables or principal components (PC) are only presented if they explained a sufficient percentage of the variance (eigenvalues > 1).
Results
Morphology
Body length, body mass, head circumference, forearm circumference and arm length are significantly different in boys and girls (P < 0.05). The results are shown in Table 1. There is no interaction between age and gender, i.e. boys and girls show similar morphological changes over age.
Table 1.
Morphological differences between boys and girls. Only the significant differences between the mean values of morphological parameters of boys and girls are presented
| Boys | Girls | P | |
|---|---|---|---|
| Mass (kg) | 12.961 | 11.921 | 0.015 |
| Length (m) | 0.895 | 0.870 | 0.033 |
| Head circumference (m) | 0.497 | 0.477 | 0.000 |
| Forearm circumference (m) | 0.211 | 0.204 | 0.045 |
| Arm length (m) | 0.270 | 0.256 | 0.005 |
Measure for chubbiness
In Fig. 2a the regression between body mass and body length is shown. Residuals of this regression are associated with different measures of chubbiness. P and R2-values of these regressions are presented in Table 2. In further analyses BMI will be used as a measure for chubbiness as the regression between the residuals and BMI showed the best fit (R = 0.88) (see Fig. 2b).
Fig. 2.

(a)The linear regression between the logarithm of body mass (kg) and the logarithm of body length (m). (b) The linear regression between the residuals of the body mass vs. body length regression and the logarithm of Body Mass Index (BMI).
Table 2.
P and R2-values of the regressions between the residuals of the body mass vs. body length plot (regression) and measures for chubbiness (BMI = body mass Index; PI = ponderal index)
| Measure for chubbiness | R2 | P-value of slope |
|---|---|---|
| BMI (kg m−2) | 0.880 | 0.000 |
| PI (kg m−3) | 0.379 | 0.000 |
| Skin fold upper arm (mm) | 0.290 | 0.000 |
| Skin fold leg (mm) | 0.129 | 0.001 |
| Skin fold belly (mm) | 0.107 | 0.002 |
| Sum of the skin folds (mm) | 0.291 | 0.000 |
Linear regressions with body length and body mass
In Table 3 the slopes (a) and intercepts (b) are shown that describe the relation between body length and body mass and the morphological and segment inertial parameters. Regression slopes (a) indicate the differences in growth velocity of the morphological and segment inertial parameters. R2-values are presented to provide information about the goodness of fit of the regressions. The results show that all inertial properties, except the sagittal and longitudinal moments of inertia of the head, and the positions of the centre of mass of the segments, change significantly with body length. The segment masses, except for the mass of the head, change significantly with body mass. Furthermore, the results indicate a strong relation between age and body length (R2 = 0.71). Considering the axial segments, the developmental velocity of the thorax was greatest for all parameters. In the lower extremity region the developmental rates of all morphological and segment inertial parameters are higher for the thigh than for the leg. The parameters of the upper arm have greater developmental velocities than the parameters of the forearm in relation to body length. For the record, in Table 4 the average position of the centre-of-mass (COM), expressed as a percentage of total segment length with respect to the more proximal joint, is presented for each segment.
Table 3.
Slopes (a) and intercepts (b) of the linear regressions of the morphological and segment inertial parameters as a function of body length and body mass. P and R2-values of these regressions are also presented (BMI = body mass index; Ix = moment of inertia around the coronal axis; Iy = moment of inertia around the sagittal axis; Iz = moment of inertia around the longitudinal axis; COM = center-of-mass, expressed as a percentage of segment length, relative to the more proximal end of the segment)
| Y = | ax + b | R2 | P-value of slope |
|---|---|---|---|
| Age (months) | 85.636length − 50.511 | 0.712 | 0.000 |
| Body mass (kg) | 23.304length − 7.985 | 0.712 | 0.000 |
| Body length (m) | − | − | − |
| Head circumference (m) | 0.172length + 0.338 | 0.277 | 0.000 |
| BMI (kg m−2) | −6.339length + 21.72 | 0.097 | 0.002 |
| Length (m) | |||
| Head | 0.096length + 0.114 | 0.172 | 0.000 |
| Thorax | 0.271length + 0.043 | 0.539 | 0.000 |
| Pelvis | 0.066length + 0.009 | 0.162 | 0.000 |
| Upper arm | 0.150length + 0.006 | 0.277 | 0.000 |
| Forearm | 0.175length – 0.027 | 0.501 | 0.000 |
| Thigh | 0.209length – 0.033 | 0.492 | 0.000 |
| Leg | 0.270length – 0.082 | 0.754 | 0.000 |
| Mass (kg) | |||
| Head | − | − | 0.125 |
| Thorax | 0.404mass + 0.367 | 0.715 | 0.000 |
| Pelvis | 0.100mass + 0.109 | 0.330 | 0.000 |
| Upper arm | 0.026mass + 0.029 | 0.385 | 0.000 |
| Forearm | 0.019mass + 0.004 | 0.353 | 0.000 |
| Thigh | 0.090mass – 0.309 | 0.621 | 0.000 |
| Leg | 0.059mass – 0.250 | 0.772 | 0.000 |
| Ix (kg m2) | |||
| Head | 7.396length + 1.246 | 0.033 | 0.008 |
| Thorax | 169.333length – 101.392 | 0.619 | 0.000 |
| Pelvis | 12.301length – 6.658 | 0.241 | 0.000 |
| Upper arm | 2.346length – 1.425 | 0.337 | 0.000 |
| Forearm | 1.454length – 0.912 | 0.345 | 0.000 |
| Thigh | 9.561length – 6.575 | 0.553 | 0.000 |
| Leg | 0.303length – 6.180 | 0.647 | 0.000 |
| Iy (kg m2) | |||
| Head | − | − | 0.132 |
| Thorax | 145.281length – 87.300 | 0.610 | 0.000 |
| Pelvis | 4.128length – 1.982 | 0.183 | 0.000 |
| Upper arm | 2.675length – 1.677 | 0.362 | 0.000 |
| Forearm | 1.336length – 0.792 | 0.240 | 0.000 |
| Thigh | 9.400length – 6.321 | 0.515 | 0.000 |
| Leg | 6.92length – 5.007 | 0.723 | 0.000 |
| Iz (kg m2) | |||
| Head | − | − | 0.423 |
| Thorax | 48.077length – 24.720 | 0.471 | 0.000 |
| Pelvis | 12.381length – 6.158 | 0.230 | 0.000 |
| COM (%) | |||
| Head | − | − | 0.412 |
| Thorax | − | − | 0.353 |
| Pelvis | − | − | 0.731 |
| Upper arm | 7.681lenght + 44.724 | 0.055 | 0.049 |
| Forearm | − | − | 0.696 |
| Thigh | − | − | 0.106 |
| Leg | − | − | 0.272 |
Table 4.
The average position of the centre-of-mass (COM), expressed as a percentage of total segment length with respect to the more proximal joint, is presented for each segment
| Segment | COM (%) |
|---|---|
| Head | 45.72 |
| Thorax | 49.25 |
| Pelvis | 50.35 |
| Upper arm | 51.48 |
| Forearm | 54.31 |
| Thigh | 54.80 |
| Leg | 54.87 |
Principal component analysis
PCA resulted in three newly composed principal components which explain a high fraction of the variance. Eigenvalues, percentages of the variance for each component and the percentage of the total variance that is explained by the three components are shown in Table 5. Also in Table 5 are the factor scores (FS) presented for each variable on each PC-axis. The FS are the loadings of the variables on the PC-axes and can be used to calculate the component scores (CS) per child on the PC-axes. The first PC is called the ‘Axis of chubbiness’ and is composed of the width of the segments and BMI. All these parameters are positively related with each other. In the second axis the length of the leg is negatively correlated with head circumference and thigh width. This can be viewed as a reflection of the principle of allometric growth (Krogman, 1972), i.e. the developmental rate of the lower extremity is greater than the growth velocity of the axial segments (head–thorax–pelvis). For this reason the third axis is called the ‘Axis of allometric growth’. The third PC is compiled by the length of the thorax, thigh, upper arm and forearm. In this ‘Axis of relative limb length’ the length of the limbs is expressed relative to the length of the thorax.
Table 5.
Eigenvalues, percentages of the variance in the population explained by each component and the cumulative variance that is explained by the three components that were obtained from the PCA. Factor scores for each variable on each PC-axis are presented. Numbers in italic bold indicate on which axis the parameter is placed
| Axis of chubbiness | Axis of allometric growth | Axis of relative limb length | |
|---|---|---|---|
| Total initial eigenvalue | 5.263 | 1.812 | 1.248 |
| % of variance | 40.49 | 13.94 | 9.60 |
| Cumulative % of variance | 40.49 | 54.42 | 64.02 |
| Factor scores | |||
| BMI | 0.250 | −0.086 | −0.102 |
| Thorax length | −0.055 | 0.099 | 0.296 |
| Thorax diameter (proximal) | −0.062 | 0.354 | −0.047 |
| Pelvis diameter (proximal) | 0.149 | 0.055 | 0.011 |
| Upper arm length | 0.043 | 0.048 | −0.383 |
| Upper arm width | 0.138 | 0.011 | 0.117 |
| Forearm length | 0.055 | −0.276 | 0.426 |
| Forearm width | 0.150 | 0.061 | 0.048 |
| Thigh length | 0.147 | −0.240 | −0.233 |
| Thigh width | 0.267 | −0.138 | −0.019 |
| Leg length | 0.132 | −0.440 | −0.017 |
| Leg width | 0.301 | −0.168 | −0.063 |
| Head circumference | −0.013 | 0.387 | −0.177 |
Morphological classification
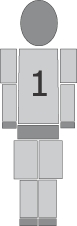
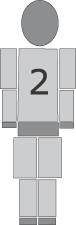
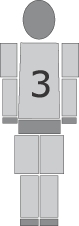
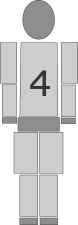
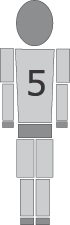
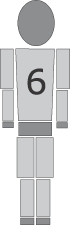
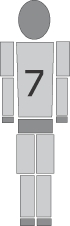
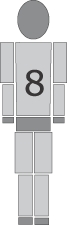
The morphological classification is created by a combination of the three newly composed variables from the PCA. The axis of chubbiness, allometric growth and relative limb length were plotted against each other and the resulting octants present different classes or morphotypes (Fig. 3). Table 6 pictures a manikin of the different morphotypes and lists the morphometric parameters discriminating the classes from each other. On the basis of morphological measurements each child can be placed into one of the eight classes. The procedure for typifying a child is described in the Discussion.
Fig. 3.

The axis of robustness, relative limb length and growth were plotted against each other and the resulting octants present different classes or morphotypes A zero score on each of the axes represents the average child. The component scores of the children that were included in the PCA are shown on this plot representing the variation in morphology in this population.
Table 6.
Manikins of the different morphotypes and a list of the morphometric parameters discriminating the classes from each other are shown. The positive and negative signs represent respectively the positive and negative scores of the child on each PC-axes. (1 = Axis of robustness; 2 = Axis of allometric growth; 3 = Axis of relative limb length)
|
|
|
|
|
|
|
|
|||||||||||||||||
|---|---|---|---|---|---|---|---|---|---|---|---|---|---|---|---|---|---|---|---|---|---|---|---|---|
| 1 | + | High BMI | + | High BMI | + | High BMI | + | High BMI | − | Low BMI | − | Low BMI | − | Low BMI | − | Low BMI | ||||||||
| Broad pelvis | Broad pelvis | Broad pelvis | Broad pelvis | Small pelvis | Small pelvis | Small pelvis | Small pelvis | |||||||||||||||||
| Broad upper arm | Broad upper arm | Broad upper arm | Broad upper arm | Small upper arm | Small upper arm | Small up. arm | Small up. arm | |||||||||||||||||
| Broad forearm | Broad forearm | Broad forearm | Broad forearm | Small forearm | Small forearm | Small forearm | Small forearm | |||||||||||||||||
| Broad thigh | Broad thigh | Broad thigh | Broad thigh | Small thigh | Small thigh | Small thigh | Small thigh | |||||||||||||||||
| Broad leg | Broad leg | Broad leg | Broad leg | Small leg | Small leg | Small leg | Small leg | |||||||||||||||||
| 2 | + | Large head circumference | + | Large head circumference | − | Small head circumference | − | Small head circumference | + | Large head circumference | + | Large head circumference | − | Small head circ. | − | Small head circ. | ||||||||
| Broad thorax | Broad thorax | Small thorax | Small thorax | Broad thorax | Broad thorax | Small thorax | Small thorax | |||||||||||||||||
| Short leg | Short leg | Long leg | Long leg | Short leg | Short leg | Long leg | Long leg | |||||||||||||||||
| 3 | + | Long thorax | − | Short thorax | + | Long thorax | − | Short thorax | + | Long thorax | − | Short thorax | + | Long thorax | − | Short thorax | ||||||||
| Short thigh | Long thigh | Short thigh | Long thigh | Short thigh | Long thigh | Short thigh | Long thigh | |||||||||||||||||
| Short upper arm | Long upper arm | Short upper arm | Long upper arm | Short upper arm | Long upper arm | Short upper arm | Long upper arm | |||||||||||||||||
| Long forearm | Short forearm | Long forearm | Short forearm | Long forearm | Short forearm | Long forearm | Short forearm |
Discussion
Method validity
Segment inertial parameters are indispensable to study the influence of morphology on the walking pattern. Because we are interested in individual morphological differences, inertial parameters have to be accurate and available for each child. There are several methods for calculating moments of inertia but only a few are suitable for young children. A very precise way to calculate moments of inertia is the use of an experimental method (cf. the compound pendulum approach) on cadaver segments (Chandler et al. 1975). Because this method is only conducted on cadavers of adult males of advanced age, the available data cannot be used for our purpose. To estimate biomechanical properties of living individuals, Jensen (1978) developed a mathematical method based on photogrammetry (the elliptical zone technique). In the model, the segments are considered to be composed of elliptical zones 2 cm wide so the shape fluctuations of the segments can be effectively followed. Segment densities were assumed to be uniform (Dempster, 1955). This approach is accurate and gives individual information for each subject. The mean difference between actual and estimated body mass is 0.203%, with a standard deviation of 2.301%. The elliptical zone method requires 10 min per subject to mark the reference points and photograph the individual. Because the subject has to lie still the entire period, this approach is difficult in a large sample of young children. Schneider & Zernicke (1992) used another mathematical model based on the work of Hatze (1979) that approximates the linked segments as geometric shapes. Therefore, 242 measurements have to be taken from each subject to calculate the volumes of 17 body segments. Body density values determined from cadaver studies are used to calculate the masses of the segments. The Hatze anthropometric model was modified by adjusting the body density values such that the average difference between the actual and computed mass was minimized. Initially, Schneider & Zernicke found a difference of 26.96 ± 23.42% between actual and estimated body mass. They then reduced the adult body density values by a standard correction factor of 17.7% and this minimized the error to −0.14%. This method is rather difficult to perform on a large sample of toddlers because of the numerous measurements that are necessary. Moreover, without the adjustment of segment densities in a rather arbitrary fashion, the method is less accurate than the elliptical zone technique (Jensen, 1978).
The model we use is a mathematical model based on the model of Crompton and has been tested and used repeatedly in other studies (Crompton et al. 1996; Raichlen, 2005; Isler et al., 2006; Wall-Scheffler et al. 2006; Schoonaert et al. 2007). It is considered a practical and in vivo alternative for double pendulum experiments. To test the reliability of this method, we calculated the total body mass of two adults by using two different measurement techniques. Firstly, we measured all body segments of the test subjects, except the hands, with callipers. The total body mass was estimated by the sum of the mass of the segments, which were calculated with the mathematical model. Second, we took the same measurements on two standardized pictures and compared the two estimated body masses with the actual body mass. The mean error between the estimated body mass by using callipers and the actual body mass was 3.91 ± 1.41%, and the mean error between the body mass, calculated based on the pictures, and the actual body mass was 3.22 ± 0.20%. As the difference in mean error between the two measurement techniques is negligible, we can conclude that it is safe to use measurements taken on standardized pictures. In our sample of children the mean error between the estimated and the actual body mass was 6.63 ± 4.56%. This error is higher than the error made when estimating the body mass of the adults because a small measurement error in children leads to proportionally larger mistakes. Furthermore, this error can be explained by the assumption that the segments are uniformly distributed and that their density is equal to the density of water (1g cm−3). When we take into account that the mass of some segments will be overestimated (especially the mass of the thorax because of our assumption that the lungs are filled with water) the error is relatively small. In Fig. 4 the regression between estimated body mass and actual body mass is presented. The slope of this regression is almost equal to one (a = 0.99), and the line here does not appear to differ from the line of identity. This indicates that estimated and actual body mass expand by the same amount. We can conclude that our model is accurate and easy to use in a large sample of toddlers.
Fig. 4.

Estimated vs. measured body mass with y = 0.99x + 0.86 and R2 = 0.87.
Morphological and segment inertial changes in toddlers
Linear regressions in relation to body length and body mass
The presented dataset of morphological and segment inertial parameters in relation to body length and body mass is a valuable tool for locomotor biomechanical modelling. All parameters show a positive relation with body length, except for BMI, which has a negative relation with the predicting parameter as the amount of body fat reduced (de Onis et al. 2006) due to growth. In comparison with newborns, toddlers’ bodies have a larger ratio of muscle mass to body fat, especially in the legs (Thelen & Fisher, 1982). The regression equations provide an easy method to calculate the segment masses, lengths and moments of inertia for children between 15 and 36 months.
Linear regressions in relation to age
To compare our results with previous research we recalculated the regression equations in relation to age. Previous research on segment inertial parameters concentrated on infancy (1–18 months; Schneider & Zernicke, 1992; Sun & Jensen, 1994) or started at childhood to adolescence (4–20 years; Jensen, 1986; Jensen & Nassas, 1988). The current study provides information about the growth of segment inertial properties of children between 15 and 36 months, which is the critical age for the development of important motor skills such as walking and running. To obtain complete information about the growth of prepuberal children between 1 and 12 years of age, the results of our study were plotted on several graphs (Figs 5 and 6) together with the results of the studies of Sun & Jensen (1994) and Jensen & Nassas (1988). Jensen & Nassas (1988) described the moments of inertia of 12 males between 4 and 20 years in a longitudinal follow-up study using the elliptical zone method. Using the same technique, Sun & Jensen (1994) calculated polynomial regression equations for the segment masses and moments of inertia of 27 infants aged between 9 and 36 weeks. To compare the segment masses, the definition of the segments must be the same. Sun & Jensen (1994) and Jensen & Nassas (1988) divide the trunk in upper and lower trunk, whereas we divide the same segment into thorax and pelvis. Therefore, in the following we define the thorax as the sum of thorax and pelvis or the sum of upper and lower trunk. In Fig. 5 the growth of the masses of the segments (head, thorax, upper arm, forearm, thigh and leg) for children between 1 and 36 months are shown. For children between 4 and 12 years data on the segment masses were not available. According to the graphical presentations (Fig. 5) the estimated masses of most segments for children between 15 and 36 months are in line with the expansion of the curve as predicted by Sun & Jensen (1994) for children between 1 and 14 months. When compared with the data of the younger children, a small overestimation of thorax mass can be seen. At the same time, the mass of the thigh is a little underestimated. This is probably due to the different definitions of the segment boundaries of thorax and thigh. Sun & Jensen (1994) define the thigh starting from the ASIS (anterior superior iliacal spine), whereas in our definition the thigh starts from a lower point, namely at the Trochanter major. In Fig. 6 the transverse (Ix) and anterior-posterior (Iy) moments of inertia of the segments are presented for children between 1 and 12 years. For most segments our data fall within the range of expectations based on the previous studies, except for the limb segments where there is a gap between our data and the data of Jensen & Nassas (1988). This is probably due to an artefact in the regression equations of Jensen & Nassas (1988), as it is impossible for the moments of inertia to show a U-shaped curve as a function of age in children between 48 and 60 months. Furthermore, there is a small overestimation of the moments of inertia of the thorax, and the moments of inertia of the thigh are slightly underestimated. As mentioned before, this is probably due to the definition of the segment boundaries. We can conclude that the data of this study are a very useful addition to the already existing dataset.
Fig. 5.

The growth of the masses (kg) of the segments (head, thorax, upper arm, forearm, thigh and leg) for children between 1 and 36 months are presented in relation to age expressed in months.
Fig. 6.

The transverse (Ix) and anterior-posterior (Iy) moments of inertia of the segments are presented for children between 1 and 12 years in relation to age expressed in months.
It is clear from the results that the morphological and inertial properties of most segments change significantly between 1 and 12 years. For the axial segments the thorax had the greatest development velocity for all parameters. This result confirms the principle of cephalocaudal growth, where after birth the development velocity of the trunk segments starts to speed up and exceeds the development velocity of the head (Jensen, 1993). For the upper limb, the growth velocity of the inertial properties of the upper arm is always higher than the parameters of the forearm. In the lower limb the inertial parameters of the thigh develop at greater velocities than do the parameters of the leg. These results indicates that the growth rates of the limb segments are compatible with the principle of distal to proximal development in which, after birth, the more proximal segments grow faster than the distal segments (Tanner, 1962; Sun & Jensen, 1994; Jensen, 1986). We can conclude that in children between 1 and 12 years the axial body segments develop consistent with the principle of cephalocaudal growth and the limb segments follow the pattern of distal to proximal growth.
There appears to be a general tendency in terrestrial mammals to maintain light distal limb elements, possibly to reduce the energetic costs of limb swing (Raichlen, 2005). Previous studies on the ontogeny of limb mass distribution of three different primate taxa show a proximal migration of limb mass with age. For example, infant macaques (Macaca) have more distally concentrated limb mass compared to adults. This transfer occurs as the infants shift from dorsal and ventral riding on their mothers to independent locomotion (Turnquist & Wells, 1994). Raichlen (2005) discovered the same trend in infant baboons (Papio cynocephalus). When we compare our data with inertial properties of body segments of one of our nearest ancestors, i.e. the chimpanzee (Pan troglodytes), some striking similarities stand out. With a geometric model based on Crompton et al. (1996) Schoonaert et al. (2007) calculated inertial properties of the body segments of 53 anaesthetized chimpanzees. The results for 14 immature chimps under 12 years of age are represented by regression equations. As in toddlers, no age-dependent difference was found for the location of the centre of mass relative to segment length, indicating that the mass distribution within a segment remains similar regardless to age. Furthermore, the growth of the axial segments of the chimpanzees is also consistent with the principle of cephalocaudal growth. The limbs also develop following the pattern of distal to proximal growth. We can conclude that the morphological and inertial properties of body segments of primates show similar growth patterns compared to children.
Principal components analysis
To calculate the PCA, the matrix of variables cannot contain missing values. We managed to collect a full dataset for 65 children, even though it was difficult to have the toddlers sufficiently long in the optimal postures to take pictures on which reliable measurements could be made. The relative small differences between estimated and calculated body mass confirm the reliability of our measurements (Fig. 4). The dataset was sufficient to keep the PCA stable. The results suggest that PCA detects the variance in body shape between the children. Each PC is composed of a number of parameters that describe a part of the child's morphology. The first axis is a description of the chubbiness of the body, the second reflects allometric growth and the third gives information about the length of the segments of the upper body. A combination of these axes provides a full description of the body composition of a child between 15 and 36 months.
Morphological classification
Existing methods for assessing physique in young children have met with several problems such as differential growth of specific dimensions and tissues, rapidly changing body proportions, and a lack of suitable reference material (Malina, 2004). The Heath–Carter method is one of the most used methods but its applicability for children less than 6 years of age is not established (Malina, 2004). This method requires 10 anthropometric dimensions for calculating the somatotype, including four skin folds. Preliminary results of a study on the effect of morphology on the walking pattern showed little to no correlation between step-time parameters and skin fold measurements. Because we are interested in those morphological parameters that may have an effect on gait, we chose to create a new classification. The main purpose of this classification was to provide a method for selecting children with different body types for further research on the effect of morphology on the walking pattern. A disadvantage of the morphological variables we selected is that they are relatively cumbersome to measure. In future research we will try to simplify the method, so that only direct anthropometric measurements are needed to calculated the morphotype of a child. Despite these disadvantages the PCA provided us with a classification that can be used for further research. To define the morphotype of a child, the BMI, head circumference, and length and width of the thorax, pelvis and upper arm, forearm, thigh and leg are calculated (see Material and Methods) and divided by body length. These variables are standardized by subtracting the average and dividing by the standard deviation. Finally, the component score (CS) for the first PC-axis can be found using the following equation:
| CSPC1= (FSPC1, 1 * M1) + (FSPC1, 2 * M2) + … + (FSPC1, 13 * M13) |
where CS = component score, FS = factor score (see Results, Table 5), M1–13 = standardized measurement, and PC1 = principal component 1.
This procedure should be repeated for each PC-axis. The resulting CS can be plotted on the PC-graph (Fig. 2b). The obtained coordinates define the octant (hence class) to which the child belongs. Using this procedure the morphotype of each child between 15 and 36 months can be specified.
General conclusions
The provided dataset of morphological and segment inertial parameters for toddlers between 15 and 36 months of age is a valuable tool for locomotor biomechanical modeling. Based on our findings, we conclude that the model of Crompton, which we used for calculating segment inertial properties, is accurate and applicable in toddlers. Our study showed that there are substantial changes in morphological and inertial parameters of most segments in relation to body length or body mass. A principal components analysis was applied to define the variance in physique between the children. PCA resulted in three newly composed variables: the ‘Axis of chubbiness’, the ‘Axis of allometric growth’ and the ‘Axis of relative limb length’. A combination of these axes provides a full description of the body composition of children. The three axes can be plotted against each other, resulting in eight morphological classes. Using this classification the morphotype of children between 15 and 36 months can be specified and used for further research on their walking pattern.
Acknowledgments
Our thanks go to the toddlers and parents for their enthusiastic participation in this research. We would also like to thank the agency ‘Kind & Gezin’ (Child & Family) for their help in the search for test subjects. In addition we would like to express special thanks to Dr Stefan Van Dongen for his statistical advice. This study was funded by a PhD grant of the Institute for the Promotion of Innovation through Science and Technology in Flanders (IWT).
References
- Adolph KE, Vereijken B, Shrout PE. What changes in infant walking and why? Child Development. 2003;74:475–497. doi: 10.1111/1467-8624.7402011. [DOI] [PubMed] [Google Scholar]
- Barnes KA, Starck A. The Denver development screening test: a normative study. Am J Public Health. 1975;65:363–369. doi: 10.2105/ajph.65.4.363. [DOI] [PMC free article] [PubMed] [Google Scholar]
- Carrier DR. Postnatal ontogeny of the musculo-skeletal system in the Black-tailed jack rabbit (Lepus californicus. J Zool Lond. 1983;201:27–55. [Google Scholar]
- Carter L, Heath B. Somatotyping: Development and Applications. Cambridge: Cambridge University Press; 1990. [Google Scholar]
- Chandler RF, Clauser CE, McConville HM, Reynolds HM, Young JW. Aerospace Medical Research Laboratory Document AMRL-TR-74-137. Ohio: Wright-Patterson Air Force Base; 1975. Investigation of inertial properties of the human body. [Google Scholar]
- Chester VL, Jensen RK. Changes in infant segmental inertias during the first three months of independent walking. Dyn Med. 2005;28:4–9. doi: 10.1186/1476-5918-4-9. [DOI] [PMC free article] [PubMed] [Google Scholar]
- Crompton RH, Li Y, Alexander RMcN, Wang W, Gunther MM. Segmental inertial properties of primates: New techniques for laboratory and field studies of locomotion. Am J Phys Anthropol. 1996;99:547–570. doi: 10.1002/(SICI)1096-8644(199604)99:4<547::AID-AJPA3>3.0.CO;2-R. [DOI] [PubMed] [Google Scholar]
- Daffertshofer A, Lamoth CJC, Meijer OG, Beek PJ. PCA in studying coordination and variability: a tutorial. Clin Biomech. 2004;19:415–428. doi: 10.1016/j.clinbiomech.2004.01.005. [DOI] [PubMed] [Google Scholar]
- de Onis M, Garza C, Onyango AW, Martorell R. WHO child growth standards. Acta Paediatr. 2006;450:1–101. [Google Scholar]
- Dempster WT. Aerospace Medical Research Laboratory WADC technical report 55 159. Ohio: Wright–Patterson Air Force Base; 1955. Space requirements of the seated operator. [Google Scholar]
- Dietz V. Proprioception and locomotor disorders. Nat Rev Neurosci. 2002;3:781–790. doi: 10.1038/nrn939. [DOI] [PubMed] [Google Scholar]
- Duysens J, Van de Crommert HWA, Smits-Engelsman BCM, Van der Helm FCT. A walking robot called human: lessons to be learned from neural control of locomotion. J Biomech. 2002;35:447–453. doi: 10.1016/s0021-9290(01)00187-7. [DOI] [PubMed] [Google Scholar]
- Enoka RM. Neuromechanics of Human Movement. Champaign, IL: Human Kinetics; 2002. [Google Scholar]
- Erbaugh SJ. The relationship of stability performance and the physical growth characteristics of preschool children. Res Q Exerc Sport. 1984;55:8–16. [Google Scholar]
- Garn SM. Body size and its implications. In. In: Hoffman LW, Hoffman ML, editors. Review of Child Development Research. New York: Russell Sage Foundation; 1966. pp. 529–561. [Google Scholar]
- Hatze H. A mathematical model for the computational determination of parameter values of anthropometric segments. J Biomech. 1979;13:833–843. doi: 10.1016/0021-9290(80)90171-2. [DOI] [PubMed] [Google Scholar]
- Isler K, Payne RC, Günther MM, Thorpe SKS, Li Y, Savage R, Crompton RH. Inertial properties of hominoid limb segments. J Anat. 2006;209:201–218. doi: 10.1111/j.1469-7580.2006.00588.x. [DOI] [PMC free article] [PubMed] [Google Scholar]
- Jensen RK. Estimation of the biomechanical properties of three body types using a photogrammetric method. J Biomech. 1978;11:349–358. doi: 10.1016/0021-9290(78)90069-6. [DOI] [PubMed] [Google Scholar]
- Jensen RK. Body segmental mass, radius and radius of gyration proportions of children. J Biomech. 1986;19:359–368. doi: 10.1016/0021-9290(86)90012-6. [DOI] [PubMed] [Google Scholar]
- Jensen RK. Human morphology: its role in the mechanics of movement. J Biomech. 1993;26:81–94. doi: 10.1016/0021-9290(93)90081-o. [DOI] [PubMed] [Google Scholar]
- Jensen RK, Nassas G. Growth of segmental principal moments of inertia between four and twenty years. Med Sci Sports Exerc. 1988;20:594–604. [PubMed] [Google Scholar]
- Krogman WM. University of Michigan Press; 1972. Child Growth. [Google Scholar]
- Main RP, Biewener AA. In vivo bone strain through ontogeny: a comparison of two vertebrate taxa. J Morphol. 2004a;260:309. [Google Scholar]
- Main RP, Biewener AA. Ontogenetic patterns of limb loading, in vivo bone strains and growth in the goat radius. J Exp Biol. 2004b;207:2577–2588. doi: 10.1242/jeb.01065. [DOI] [PubMed] [Google Scholar]
- Malina RM. Motor development during infancy and early childhood: overview and suggested directions for research. Int J Sports Health Sci. 2004;2:50–66. [Google Scholar]
- McGraw MB. The Neuromuscular Maturation of the Human Infant. New York: Columbia University Press; 1943. [Google Scholar]
- Niskikawa K, Biewener AA, Aerts P, et al. Neuromechanics: an interactive approach for understanding motor control. Integrative and Comparative Biology. 2007;47:16–54. doi: 10.1093/icb/icm024. [DOI] [PubMed] [Google Scholar]
- Raichlen DA. Effects of limb mass distribution on the ontogeny of quadrupedalism in infant baboons (Papio cynocephalus) and implications for the evolution of primate quadrupedalism. J Hum Evol. 2005;49:415–431. doi: 10.1016/j.jhevol.2005.05.004. [DOI] [PubMed] [Google Scholar]
- Schneider K, Zernicke RF. Mass, center of mass, and moment of inertia estimates for infant limb segments. J Biomech. 1992;25:145–148. doi: 10.1016/0021-9290(92)90271-2. [DOI] [PubMed] [Google Scholar]
- Schoonaert K, D’Août K, Aerts P. Morphometrics and inertial properties in the body of segments of chimpanzees (Pan troglodytes. J Anat. 2007;210:518–531. doi: 10.1111/j.1469-7580.2007.00720.x. [DOI] [PMC free article] [PubMed] [Google Scholar]
- Shirley MM. The First Two Years: a Study of Twenty-Five Babies. Volume I. Postural and Locomotor Development. Minneapolis: University of Minnesota press; 1931. [Google Scholar]
- Sun H, Jensen RK. Body segmental growth during infancy. J Biomech. 1994;27:265–275. doi: 10.1016/0021-9290(94)90003-5. [DOI] [PubMed] [Google Scholar]
- Tanner JM. Growth at Adolescence. Oxford: Blackwell; 1962. pp. 1–325. [Google Scholar]
- Thelen E, Elrich BD, Jensen JL. The developments of origins of locomotion. In. In: Woollacott MH, Shumway-Cook A, editors. Development of Posture and Gait across the Life Span. Columbia: University of South Carolina Press.; 1989. pp. 26–47. [Google Scholar]
- Thelen E, Fisher DM. Learning to walk: Ecological demands and phylogenetic constraints. Adv Infancy Res. 1982;3:213–260. [Google Scholar]
- Turnquist JE, Wells JP. Ontogeny of locomotion in rhesus macaques (Macaca mulatta): I. Early postnatal ontogeny of the musculoskeletal system. J Hum Evol. 1994;26:487–499. [Google Scholar]
- Wall-Scheffler CM, Myers MJ, Steudel-Numbers K. The application to bipeds of a geometric model of lower limb segmental inertial properties. J Hum Evol. 2006;51:320–326. doi: 10.1016/j.jhevol.2006.04.001. [DOI] [PubMed] [Google Scholar]