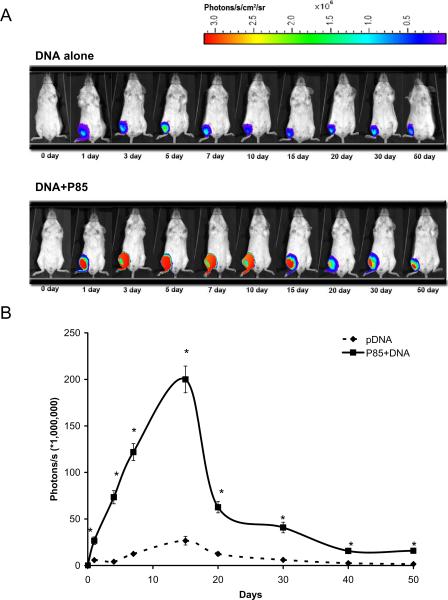
Fig. 3.
Effect of 0.3% P85 on luciferase gene expression in vivo after a single i.m. injection of 10 μg plasmid DNA in 50 μl HBSS. (A) A representative in vivo imaging in a mouse. (B) Quantitative data of in vivo imaging study. Data are mean ± SEM (n = 5). P values were obtained by the means of the Student's t test following logarithmic transformation of the data. Each P value corresponds to the comparison of naked DNA versus DNA formulated with P85: * p < 0.05.

