

Abstract
Otosclerosis is a common form of progressive hearing loss, characterized by abnormal bone remodeling in the otic capsule. The etiology of the disease is largely unknown, and both environmental and genetic factors have been implicated. To identify genetic factors involved in otosclerosis, we used a case-control discovery group to complete a genome-wide association (GWA) study with 555,000 single-nucleotide polymorphisms (SNPs), utilizing pooled DNA samples. By individual genotyping of the top 250 SNPs in a stepwise strategy, we were able to identify two highly associated SNPs that replicated in two additional independent populations. We then genotyped 79 tagSNPs to fine map the two genomic regions defined by the associated SNPs. The region with the strongest association signal, pcombined = 6.23 × 10⁻¹⁰, is on chromosome 7q22.1 and spans intron 1 to intron 4 of reelin (RELN), a gene known for its role in neuronal migration. Evidence for allelic heterogeneity was found in this region. Consistent with the GWA data, expression of RELN was confirmed in the inner ear and in stapes footplate specimens. In conclusion, we provide evidence that implicates RELN in the pathogenesis of otosclerosis.
Introduction
Hearing loss, the most frequent sensory impairment in developed countries, profoundly impacts emotional, physical, and social well-being.1 One variety, otosclerosis (MIM 166800), is particularly common in the European population, occurring with a reported frequency of 0.3%–0.4%.2 The hearing loss in otosclerosis typically begins in the third decade and progressively becomes more severe, reflecting pathognomonic abnormal bone remodeling of the otic capsule. The remodeling process often involves the stapediovestibular joint, and by interfering with motion of the stapes, it leads to conductive hearing loss and clinical otosclerosis. Histological otosclerosis is seen nearly five times more frequently than clinical otosclerosis. However, because stapes fixation is absent, unless high-resolution computed tomography of the temporal bones is obtained, the diagnosis can only be made postmortem.2,3 Approximately 10% of persons with clinical otosclerosis also develop sensorineural hearing loss.4,5
The etiology of otosclerosis remains unknown, although several hypotheses implicate viral, immunological, hormonal, and endocrine factors in disease development. In addition, the familial clustering of persons with otosclerosis indicates that genetic factors are also important.6,7 Otosclerosis is most appropriately considered as a complex disease caused by different environmental and genetic factors. However, monogenic forms of otosclerosis also exist.
For the identification of genetic contributions to otosclerosis, eight large families segregating monogenic otosclerosis suitable for genome-wide linkage analysis have been used in the mapping of eight otosclerosis loci, although only seven of these localizations are published (OTSC1–OTSC5, OTSC7, OTSC8).8–14 None of the genes have been cloned. An alternative genetic approach, the candidate-gene case-control association study, has been modestly successful, and there is evidence that COL1A1 (MIM 120150), TGFB1 (MIM 190180), BMP2 (MIM 112261), and BMP4 (MIM 112262) contribute to disease development.15–17 Common to these four genes is a role in bone and/or otic-capsule development and remodeling, but the predictive genetic contribution of these genes to the pathogenesis of otosclerosis is only minimal. An association between otosclerosis and the renin-angiotensin-aldosterone (RAA) system has also been suggested.18
New knowledge from the Human Genome project, availability of high-density SNP maps via projects such as HapMap, and technological progress in genotyping have made it possible to perform genome-wide association (GWA) studies. This approach does not depend on the selection of candidate genes that presume an understanding of otosclerosis at the molecular level. It holds the promise of identifying genes and pathways that are causally related to otosclerosis but are not at this time intuitively obvious. The power of this strategy has been validated for a variety of other complex diseases. Because GWA studies are still very expensive, we used pooled DNA samples in a stepwise screening strategy to reduce costs (Figure 1). This modification is particularly useful for identifying major genetic contributions to a given disease.19
Figure 1.

Schematic Representation of the Staged Design Used in This Study
Subjects and Methods
Clinical Diagnosis
Pure-tone audiometry was performed on all patients, with air conduction at 125, 250, 500, 1000, 2000, 4000, and 8000 Hz and bone conduction at 250, 500, 1000, 2000, and 4000 Hz. To exclude outer- or middle-ear pathology, otoscopy and tympanoscopy were performed. The mobility of the stapes was assessed via tympanometry and the measurement of stapedial reflexes. Persons in whom otosclerosis was confirmed during stapes microsurgery were considered affected. In persons who had not undergone surgery, the diagnosis of clinical otosclerosis was based on audiometric data. Persons with a conductive or mixed hearing loss together with absent or immeasurable stapedial reflexes were classified as affected. Controls were not screened, because with the known disease frequency of otosclerosis in the European population, the loss of power is negligible.20
Study Populations
Individuals in a Belgian-Dutch group of case samples, consisting of 694 unrelated persons of Belgian or Dutch origin diagnosed with otosclerosis, were recruited by the Department of Otolaryngology in several hospitals: the University Hospital of Antwerp (Antwerp, Belgium), St. Augustinus Hospital (Antwerp), the University Hospital of Ghent (Ghent, Belgium), and the University Medical Center St. Radboud (Nijmegen, The Netherlands). In 97.8% (n = 679) of these cases, the diagnosis of otosclerosis was confirmed during stapes microsurgery. The same number of unrelated controls (n = 694) were selected from a DNA repository of the Department of Medical Genetics (Antwerp). All controls were matched with cases according to sex, age (± 1 year), and ethnicity. Individuals with unknown family relationships and/or an outlying genetic background were excluded from this population in a previous study.17 A French group of case samples, consisting of 455 unrelated persons of French origin diagnosed with otosclerosis, was also collected, through the Jean Causse Ear Clinic (Colombiers, France), and 480 unrelated control samples, matched for ethnicity, were collected by the Laboratoire de Genetique Moleculaire et Chromosomique IURC, CHU Montpellier. In all French cases, the diagnosis of otosclerosis was confirmed at stapes microsurgery.
A discovery group and an independent replication set were then created from the Belgian-Dutch population. The discovery group comprised 302 cases and 302 controls of Belgian origin. This group was used for the initial GWA study with the creation of DNA pools of cases and controls. The first independent replication set comprised the remaining Belgian-Dutch samples—392 cases and 392 controls. The French samples were used as a second independent replication cohort. The demographics of each population are shown in Table S1 (available online), and Figure 1 shows a general overview of the stepwise strategy that was used in this study. Subsequent fine mapping was done with all Belgian-Dutch case-control samples.
This project was approved by the Ethical Committee of the University of Antwerp, and informed consent was obtained from each patient. Genomic DNA was extracted from fresh or frozen blood, via standard techniques.21
Genome-wide Association
DNA quality was assessed with agarose gel electrophoresis and spectrophotometric analysis; samples of poor quality were eliminated. Quantification was completed in triplicate with PicoGreen (Molecular Probes, Eugene, Oregon, USA), ensuring the equality of individual contributions to the pooled samples. From the 302 patients of the discovery group, three pools were constructed independently, in triplicate, from all individual samples, ensuring that pipetting variation was normalized. In total, 70 ng of DNA from each individual contributed to each pool, and each pool was diluted with water to a target concentration of 50 ng/μl. The same was done for the 302 controls of the discovery group. From each pool (six in total), 750 ng was hybridized to an individual Illumina HumanHap550 SNP chip, in accordance with the manufacturers' protocol for individual genotyping. This chip used the Infinium II Assay to interrogate over 555,000 SNPs on a single BeadChip. We chose the Illumina platform, because it was previously shown that of the two main array platforms available for pooling, Illumina is more efficient than Affymetrix.22
Data Analysis of DNA Pools
We normalized red and green intensities by dividing them by the overall mean intensity value of the red or green channel. Outlying SNPs with zero intensities or SNPs represented by an abnormally low number of beads (<5) were removed. Differences in allelic frequency were detected by assessment of bead intensity. Data were ranked with GenePool software by silhouette statistics, a process which has been described in detail elsewhere.19
Individual Genotyping
From genome-wide data ranked by Genepool software, 250 SNPs were chosen from the samples used for constructing the pools (the discovery group) for validation by individual genotyping. These 250 SNPs included the top 200 ranked SNPs from the pooling data and 50 additional SNPs chosen on the basis of two different strategies: First, 28 SNPs were chosen from the top 3000 on the basis of their genetic position (i.e., in the OTSC loci) or proximity to genes that we considered possibly relevant to the pathogenesis of otosclerosis on the basis of prior reports. Second, 22 SNPs were selected from the top 1000 on the basis of close location to another SNP from the top 1000 (<20,000 bp from the next SNP). All SNPs that showed a significant association were then selected for genotyping in the first independent replication set (784 samples). SNPs that showed the same significant effect in both the discovery group and the first replication set were genotyped in the second replication set (935 samples). Genotyping was performed by KBioscienses (Herts, UK), via a form of allele-specific PCR referred to as KASPar.
Fine Mapping
The SNPs that showed a significant effect in the same direction in all three sets were selected for fine mapping. This step was done because it not only provides a more complete overview of the associated region, it also allows determination of whether the significant SNP represents one signal or whether there are several independent signals. Fine mapping was performed in all Belgian-Dutch case-control samples. TagSNPs were selected in the regions surrounding the significant SNPs on the basis of LD structure provided by CEPH genotype data (HapMap, release 21a, phase II), with the use of the aggressive algorithm of Tagger (single marker and multimarker predictions),23 implemented in Haploview (version 4.0, beta 15).24 The minor-allele frequency was set to 0.05, and an r2 cutoff of 0.8 was chosen. Some of the most significant SNPs from the fine mapping data were genotyped in the second replication set; genotyping was again performed by KBioscienses.
Quality-Control Measures
Samples with a poor call rate (>10% missing) were excluded from the analysis. If only a few SNPs were genotyped, as in the second replication set (11 SNPs), the cutoff was rounded off to the nearest integer. After removal of samples with a poor call rate, SNPs with a bad call rate (>4% missing calls) were excluded. Hardy-Weinberg equilibrium (HWE) was calculated in controls, and SNPs with a p value < 0.001 were excluded.25
Association Testing
Data were handled with SAS/Genetics 9.1 (SAS Institute, Cary, NC, USA). All analyses were performed via automated procedures in R (version 2.3.1) and SPSS 15.0 (SPSS, Chicago, IL, USA).
To test the single-SNP association, we performed a 1 df likelihood ratio test (LRT) using logistic regression. Here, the genotype was coded linearly, under the assumption that the odds of disease increases multiplicatively for every copy of the disease allele (here referred to as an additive model). Multimarker prediction (MMP) tests, using specific combinations of two or three SNP alleles (haplotypes) serving as a proxy for an untyped SNP, as provided by the Tagger program,23 were performed via the haplotype procedure implemented in SAS/Genetics 9.1. For each MMP, we tested the specific haplotype predicting the hidden SNPs versus all other haplotypes combined.
To check whether the disease-associated allele has the same genetic effect across the populations, we fitted a logistic-regression model, including genotype, population, and the population × genotype interaction. This interaction term indicates a difference in effect according to population. We performed an LRT to test the term's significance. Nonsignificance of the interaction term indicates that the effect of the SNP on disease susceptibility is not significantly different between the populations. In this case, we fitted a reduced logistic-regression model that included only the main effects for genotype and population. In this way, the common genetic effect across the populations was estimated. The common OR and its 95% Wald CI were estimated by the regression coefficient for genotype and its large-sample CI, respectively. The p values for the common genetic effect were obtained through an LRT comparing a model including population and genotype to a model including only population as a predictor.
Allelic Heterogeneity
The availability of several SNPs in the two fine-mapped regions allowed testing for allelic heterogeneity. We included data from both the discovery group and the first independent replication set to increase power. We also tested for allelic heterogeneity in the second independent replication set (the French population) over the chr7q22.1 region, although there were fewer available SNPs.
Allelic heterogeneity was tested in a logistic-regression framework. In each region, we checked whether the most significant SNP alone was sufficient to account for all significant associations. One by one, each SNP was added to a model containing only the most significant SNP in each region. We used an LRT to test whether adding the second SNP significantly improved the model fit. If another SNP added significance in the model already containing the most significant SNP, we performed a reverse analysis to confirm that the two effects were independent. To test whether a third signal existed in the region, we added each of the remaining SNPs one by one to a model containing the two independent SNPs.
To test for interaction between the two independently significant SNPs (rs3914132 and rs7791481), we fitted a logistic-regression model including both genotypes and a genotype rs3914132 × genotype rs7791481 interaction term. We performed an LRT to test the significance of the interaction term.
RT-PCR
Tissues from wild-type and Relnrl (MIM 600514) knockout mice from B6C3Fe a/a-Relnrl/J heterozygous breeding pairs were collected and stored in RNAlater reagent (Ambion, Austin, TX, USA). Total RNA was extracted from mouse tissues with the Rneasy Mini kit (QIAGEN, Valencia, CA, USA), in accordance with the manufacturer's protocol. Human stapes samples were collected from patients undergoing translabyrinthine surgery for vestibular schwannoma. The footplate of each sample was separated from the stapes and preserved in liquid nitrogen. Stapes footplate samples were disrupted and homogenized in 1 ml QIAzol Lysis Reagent. Total RNA was extracted with the RNeasy Lipid Tissue Mini Kit (QIAGEN), in accordance with the manufacturer's protocol.
Reln and the known associated genes Dab1 (MIM 603448), Vldlr (MIM 192977), and Lrp8 (MIM 602600) were amplified from cDNA with gene-specific primers. First, cDNA synthesis was performed with the High Capacity Reverse Transcriptase kit (Applied Biosystems, Foster City, CA, USA), in accordance with the manufacturer's protocol. We performed PCR amplification of cDNA by amplifying across exon-exon junctions of each gene for both mouse and human samples under the following PCR conditions: 95°C for 5 min; 35 cycles of 95°C for 30 s, 55°C for 30 s, and 72°C for 45 s; and 72°C for 10 min. Gapdh (MIM 138400) served as a positive control, and samples extracted from the Relnrl knockout mice served as a negative control.
Western Blot
Tissues were dissected from postnatal day 28 (P28) wild-type and Relnrl knockout mice littermates from B6C3Fe a/a-Relnrl/J heterozygous breeding pairs. The tissues were disrupted by homogenization in lysis buffer (1 mM DTT, 5 mM EDTA, and protease inhibitors in PBS). Protein was isolated by centrifugation of total homogenate for 10 min at 13,000 rpm at 4°C. Protein was quantified with the BCA assay (Sigma, St. Louis, MO, USA). Equal amounts of protein were prepared in sample buffer containing β-mercaptoethanol and heated at 100°C for 5 min, then run on 7.5% SDS-PAGE gels for 1.5 hr at 100 V. Proteins were transferred to nitrocellulose membrane, then blocked in 5% milk in TBS-T for 1 hr at room temperature. Membranes were incubated overnight at 4°C in 1:500 dilution primary antibody (G10 mouse anti-reelin), followed by a 3 hr incubation in 1:5000 dilution of goat anti-mouse IgG conjugated with horseradish peroxidase. Membranes were washed and developed with the SuperSignal West Pico Chemiluminescent Substrate Kit (Pierce, Rockford, IL, USA). Samples from the Relnrl knockout mice served as a negative control.
Real-Time PCR
Expression of Reln in the inner ear was investigated in mice at several time points after birth in relation to brain and liver, where the gene is highly expressed.26 Inner ear (with surrounding cartilage), liver, and whole brain were dissected from eight outbred Swiss OF1 mice of different stages (newborn, P3, P6, P20, and P30; all from the same breeding pair) and stored immediately in liquid nitrogen. After homogenization, total RNA was isolated with Trizol (Invitrogen, Carlsbad, CA, USA), in accordance with the manufacturer's instructions. All samples were DNase treated with the DNA-free kit (Ambion). cDNA synthesis was done in duplicate with random hexamer primers with the Superscript III first-strand synthesis system for reverse transcriptase PCR (RT-PCR) (Invitrogen). For quantitative real-time PCR, TaqMan Gene Expression Assays (Applied Biosystems) for Reln and two housekeeping genes (Ubc [MIM 191340] and Hprt1 [MIM 308000]) were used. The probes for all assays were designed to span an exon junction. Mixtures consisted of 5 μl LightCycler 480 Probes Master (2x; Roche, Basel, Switzerland), 0.5 μl TaqMan Assay, and 2.5 μl water (PCR grade; Roche) and were run on a LightCycler 480 Instrument (Roche). The cycling conditions were as follows: 10 min at 95°C and 40 cycles at 95°C for 10 s and 60°C for 1 min.
Analysis was done with qBaseplus (Biogazelle, Zulte, Belgium).27 We calculated the coefficient of variance (CV) and the M value of housekeeping genes to determine the stability of their expression. We calculated normalized values using stably expressed housekeeping genes. The geomean of each group was calculated for graphical representation of the results.
To confirm the highly variable expression of Reln in the inner ear, we extracted RNA from the inner ears of 15 extra mice at P20 and 16 extra mice at P30. Each stage group was from the same litter of the same breeding pair. Quantification was done via a one-step RT-PCR system (TaqMan RNA-to-CT 1-Step Kit; Applied Biosystems), in accordance with the manufacture's protocol. We used 60 ng of DNase-treated RNA for amplification, and we analyzed each sample in duplicate. Analysis of the results was performed as described above.
Results
Genome-wide Association and Validation
DNA pools of patients and controls were subjected to GWA analysis with 555,000 SNPs (Figures S1 and S2). A ranked list of all SNPs was obtained from the analysis of probe-intensity differences using silhouette statistics. The silhouette scores of the top-ranked SNPs are shown in Table S2. The 250 SNPs from the pooling study were subsequently genotyped on the individual samples used to make the discovery group pools.
After quality control, 230 SNPs were analyzed, and of these, 196 SNPs generated a p value < 0.05 (ranging from 4.62 × 10⁻⁷ to 0.05; Figure S3 and Table S2), demonstrating that the pool-screening step was highly successful. Of the 196 SNPs, 16 generated a significant p value in the first independent replication set (784 samples), with 11 SNPs showing the same effect in both populations (Table 1). The SNPs rs112578 and rs4467276 are in LD with each other (r2 = 1; D′ = 1).25
Table 1.
Eleven Significant SNPs with the Same Effect in the Discovery Group and the First Replication Set
| SNP | Chr. | Gene | p Value (DG)a | p Value (RS1)b | Homogeneity Testc | p Value Common Genotype Effectc | OR [95% CI]c |
|---|---|---|---|---|---|---|---|
| rs3914132 | 7q22.1 | RELN | 1.00 × 10⁻⁴ | 0.003 | 0.403 | 1.22 × 10⁻⁶ | 1.631 [1.335–1.993] |
| rs1112578 | 2q32.2 | 2.80 × 10⁻⁴ | 0.004 | 0.493 | 4.34 × 10⁻⁶ | 0.691 [0.590–0.810] | |
| rs4667276 | 2q32.2 | 0.001 | 0.002 | 0.690 | 6.91 × 10⁻⁶ | 0.697 [0.594–0.817] | |
| rs17761499 | 16q23.2 | CDYL2 | 8.89 × 10⁻⁵ | 0.017 | 0.200 | 1.05 × 10⁻⁵ | 1.470 [1.237–1.748] |
| rs11243426 | 9q34.13 | 0.002 | 0.016 | 0.463 | 1.11 × 10⁻⁴ | 1.409 [1.183–1.679] | |
| rs4603268 | 11q21 | MAML2 | 0.002 | 0.033 | 0.347 | 2.42 × 10⁻⁴ | 1.367 [1.156–1.617] |
| rs2246288 | 10q26.3 | INPP5A | 0.006 | 0.016 | 0.766 | 2.56 × 10⁻⁴ | 0.683 [0.556–0.840] |
| rs4246059 | 6p25.2 | MYLK4 | 0.006 | 0.015 | 0.686 | 2.57 × 10⁻⁴ | 1.335 [1.143–1.560] |
| rs10485428 | 6q12 | BAI3 | 0.003 | 0.039 | 0.345 | 5.23 × 10⁻⁴ | 1.671 [1.245–2.244] |
| rs670358 | 11q13.1 | 0.028 | 0.022 | 0.909 | 0.001 | 0.670 [0.522–0.860] | |
| rs2330247 | 21q22.3 | 0.022 | 0.046 | 0.773 | 0.002 | 0.723 [0.585–0.893] |
p value in the discovery group.
p value in the first replication set.
Combined data of discovery group and first replication set.
These 11 SNPs were analyzed in the second independent replication set, with two SNPs showing a significant p value in this population. The first SNP, rs3914132 (p = 0.003; OR: 1.425 [1.129–1.799]), is located on chr7q22.1; the second SNP, rs670358 (p = 0.005; OR: 0.640 [0.466–0.878]), is located on chr11q13.1. Both of these SNPs showed the same effect in all populations tested (homogeneity test: 0.486 and 0.968, respectively, over all three populations; Table 2).
Table 2.
Results from Fine Mapping
| SNP | Positiona | Gene | p Value (DG)b | p Value (RS1)c | p Value (RS2)d | Homogeneity Teste | p Value Common Genotype Effecte | OR [95% CI]e |
|---|---|---|---|---|---|---|---|---|
| chr7q22.1 | ||||||||
| rs2283029 | 28581795 | RELN | 0.009 | 0.695 | ||||
| rs17290575 | 28585197 | RELN | 0.374 | 0.021 | ||||
| rs262341 | 28602125 | RELN | 0.003 | 0.091 | ||||
| rs2299383 | 28602422 | RELN | 0.026 | 0.026 | 0.216 | 0.583 | 0.001 | 0.824 [0.732–0.928] |
| rs262355 | 28609691 | RELN | 0.015 | 0.536 | ||||
| rs17133096 | 28621061 | RELN | 0.566 | 0.023 | ||||
| rs11761011 | 28623116 | RELN | 0.007 | 0.745 | ||||
| rs39335f | 28637145 | RELN | 0.017 | 0.022 | 0.143 | 0.561 | 5.39 × 10⁻⁴ | 0.741 [0.625–0.879] |
| rs39346 | 28649844 | RELN | 2.87 × 10⁻⁴ | 0.768 | ||||
| rs39347 | 28650074 | RELN | 0.019 | 0.779 | ||||
| rs39350 | 28650843 | RELN | 0.001 | 0.024 | 8.65 × 10⁻⁴ | 0.611 | 3.40 × 10⁻⁷ | 1.367 [1.212–1.543] |
| rs39374 | 28660243 | RELN | 2.04 × 10⁻⁵ | 0.048 | 2.13 × 10⁻⁵ | 0.160 | 1.55 × 10⁻⁹ | 1.441 [1.279–1.624] |
| rs12536007 | 28665264 | RELN | 0.219 | 0.049 | ||||
| rs39395f | 28673305 | RELN | 2.00 × 10⁻⁴ | 0.011 | 7.23 × 10⁻⁶ | 0.399 | 6.23 × 10⁻¹⁰ | 0.685 [0.607–0.773] |
| rs39399 | 28673568 | RELN | 1.66 × 10⁻⁵ | 0.077 | ||||
| rs13223714 | 28673996 | RELN | 0.011 | 0.315 | ||||
| rs1510858 | 28676484 | RELN | 0.708 | 0.034 | ||||
| rs39401 | 28678969 | RELN | 2.50 × 10⁻⁴ | 0.204 | ||||
| rs7791481 | 28688422 | RELN | 0.010 | 0.037 | 0.052 | 0.746 | 1.62 × 10⁻⁴ | 1.394 [1.171–1.658] |
| rs2237641 | 28703347 | RELN | 0.221 | 0.045 | ||||
| rs3914129 | 28710441 | RELN | 0.017 | 0.302 | ||||
| rs3914132g | 28710945 | RELN | 1.00 × 10⁻⁴ | 0.003 | 0.003 | 0.486 | 1.69 × 10⁻⁸ | 1.540 [1.323–1.793] |
| rs802786 | 28729984 | RELN | 0.016 | 0.061 | ||||
| chr11q13.1 | ||||||||
| rs670358g | 9897474 | CDC42BPG | 0.028 | 0.022 | 0.005 | 0.968 | 2.38 × 10⁻⁵ | 0.658 [0.541–0.801] |
| rs494252 | 9905797 | CDC42BPG | 0.034 | 0.016 | 0.110 | 0.781 | 4.27 × 10⁻⁴ | 1.394 [1.157–1.679] |
| rs627497 | 9944958 | EHD1 | 0.010 | 0.015 | 0.184 | 0.406 | 3.82 × 10⁻⁴ | 1.355 [1.145–1.604] |
| rs7949144 | 9964194 | 0.031 | 0.223 | |||||
| rs616322 | 9996670 | 0.001 | 0.017 | 0.065 | 0.409 | 2.20 × 10⁻⁵ | 1.458 [1.223–1.739] | |
SNPs significant in the discovery group and/or replication set 1 are listed. The most significant signal in each region is shown in bold
The following nucleotide reference sequences were used: for chr11, NT_033903.7; for chr7, NT_007933.14.
p value in the discovery group.
p value in replication set 1.
p value in replication set 2.
Combined data of all populations (discovery group, first and second replication set).
Originally captured as an MMP, but also genotyped after very significant predictions.
Originally identified SNP by the whole-genome association study.
Fine Mapping
The areas containing the two associated SNPs were fine mapped, for definition of the regions associated with otosclerosis. For the chromosome 7q22.1 region, 46 tagSNPs were selected over a 182,227 bp region surrounding SNP rs3914132 (Figure 2, Figure S4). The region was selected on the basis of the extent to which the LD spread (Figure S4).25
Figure 2.

Fine Mapping of the chr7q22.1 Region in the Belgian-Dutch Population
Significance is spread over the whole region. The strength of LD (r2 value) is shown in shades of gray. The originally identified SNP is indicated by an asterisk. The LD structure is based on CEPH genotype data (HapMap release 21a, phase II).
For the chromosome 11q13.1 region, 33 TagSNPs were selected in a 420,226 bp region surrounding the original SNP (Figure 3).25 This SNP is located between two regions of high LD and shows LD with both regions. Therefore, we included both regions to identify where the association signal maps.
Figure 3.
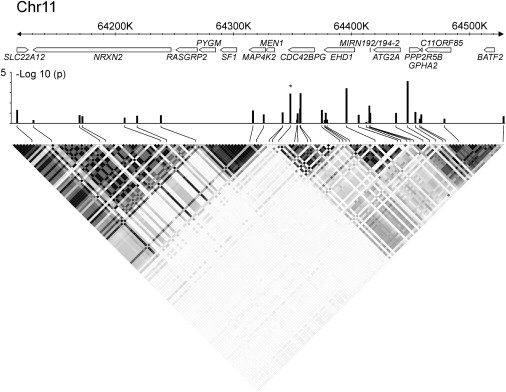
Fine Mapping of the chr11q13.1 Region in the Belgian-Dutch Population
All of the significance is located in the region of high LD telomeric to the original SNP (right LD block). The strength of LD (r2 value) is shown in shades of gray. The originally identified SNP is indicated by an asterisk. Seventeen genes or gene predictions are located in this region (based on NCBI build 36). The LD structure is based on CEPH genotype data (HapMap release 21a, phase II).
Fine-mapping results for chromosomes 7q22.1 and 11q13.1 are listed in Table 2 and shown graphically in Figures 2 and 3. Both regions showed several SNPs that were significant in the discovery group and/or the first independent replication set. In addition, several MMPs were significant in the chromosome 7q22.1 region but not in the chromosome 11q13.1 region (data not shown). Two of the most interesting MMPs (p ≤ 0.0001: rs39335 and rs39395) were genotyped individually as a validation. For the chromosome 11q13.1 region, all of the significance was localized to the region of high LD telomeric to the original SNP (Figure 3).
SNPs that were significant in both groups and had the same effect in both groups (data not shown) were genotyped in the second independent replication set (Table 2). For the chr7q22 region, several SNPs were significant in the same direction (homogeneity test). In the chr11q13 region, with exception of the original SNP, none of the other SNPs replicated. The allele frequencies across all HapMap populations for the SNPs on chr7q22 were very similar (for example, rs39395 minor-allele frequency: 0.44 ± 0.03 and rs3914132 minor-allele frequency: 0.17 ± 0.01; HapMap draft release no. 1, phase III).
Allelic Heterogeneity
To determine whether all significant signals were, through LD, attributable to one or more underlying causative variants, we tested each region for allelic heterogeneity (Table 3). In the chromosome 7q22.1 region, rs3914132 was the most significant SNP. When adding rs3914132 to a regression model containing one of the other SNPs, we saw that rs3914132 added significance to all other SNPs. Conversely, several, though not all, of the other SNPs were no longer significant when added to a regression model already containing rs3914132. Their significance is probably due to LD with the same underlying variant that rs3914132 is in LD with. On the other hand, many other SNPs remained significant even when the effect of rs3914132 was accounted for, suggesting the presence of more than one independent association signal. To analyze how many independent association signals the region contained, we built a regression model with both rs3914132 and rs7791481 (r2: 0.004; D′: 0.439), adding each of the remaining SNPs. We chose rs7791481 because it has a strong association signal and is independently associated with disease. An LRT showed that none of the remaining SNPs added significance to this model. Hence, there was no statistical evidence of a third SNP with independent effects. There was weak evidence for interaction between rs3914132 and rs7791481 (p = 0.04) (Table S3). In the fitted regression model, the regression coefficient for interaction was negative, suggesting a less-than-additive effect. In the French population, rs39395 was the most significant SNP. None of the other SNPs added significantly to this SNP, suggesting no evidence for allelic heterogeneity in the genomic region tested (data not shown).
Table 3.
Allelic Heterogeneity in the Complete Belgian-Dutch Population
| chr7q22.1 SNPs | p Valuea | LD with rs3914132b |
Single-Locus Test when SNP Added to rs3914132 | Single-Locus Test when rs3914132 Added to SNP | Single-Locus Test when SNP Added to rs3914132 and rs7791481 | |
|---|---|---|---|---|---|---|
| D′ | r2 | |||||
| rs17290575 | 0.020 | 0.490 | 0.213 | 0.661 | 1.92 × 10⁻⁵ | 0.361 |
| rs262341 | 0.001 | 1.000 | 0.190 | 0.034 | 1.82 × 10⁻⁵ | 0.162 |
| rs2299383 | 0.002 | 0.807 | 0.386 | 0.099 | 5.39 × 10⁻⁵ | 0.969 |
| rs262355 | 0.040 | 0.874 | 0.148 | 0.257 | 4.92 × 10⁻⁶ | 0.502 |
| rs17133096 | 0.032 | 0.572 | 0.005 | 0.087 | 1.57 × 10⁻⁶ | 0.142 |
| rs11761011 | 0.031 | 0.598 | 0.014 | 0.076 | 1.99 × 10⁻⁶ | 0.169 |
| rs39335 | 0.001 | 0.926 | 0.593 | 0.903 | 3.65 × 10⁻⁴ | 0.599 |
| rs39346 | 0.008 | 1.000 | 0.085 | 0.115 | 7.34 × 10⁻⁶ | 0.326 |
| rs39350 | 1.11 × 10⁻⁴ | 1.000 | 0.161 | 0.020 | 2.84 × 10⁻⁴ | 0.189 |
| rs39374 | 1.63 × 10⁻⁵ | 1.000 | 0.135 | 0.014 | 0.001 | 0.214 |
| rs12536007 | 0.023 | 1.000 | 0.028 | 0.060 | 4.46 × 10⁻⁶ | 0.121 |
| rs39395 | 1.56 × 10⁻⁵ | 1.000 | 0.399 | 0.054 | 7.89 × 10⁻⁴ | 0.866 |
| rs39399 | 2.86 × 10⁻⁵ | 1.000 | 0.175 | 0.027 | 3.21 × 10⁻⁴ | 0.309 |
| rs13223714 | 0.014 | 1.000 | 0.090 | 0.002 | 1.26 × 10⁻⁷ | 0.384 |
| rs39401 | 8.05 × 10⁻⁴ | 1.000 | 0.131 | 0.062 | 3.37 × 10⁻⁵ | 0.315 |
| rs7791481 | 0.001 | 0.439 | 0.004 | 8.75 × 10⁻⁴ | 1.11 × 10⁻⁶ | NA |
| rs2237641 | 0.021 | 1.000 | 0.024 | 4.71 × 10⁻⁴ | 6.03 × 10⁻⁸ | 0.213 |
| rs3914129 | 0.018 | 1.000 | 0.190 | 0.325 | 3.09 × 10⁻⁵ | 0.980 |
| rs3914132 | 1.23 × 10⁻⁶ | NA | NA | NA | NA | NA |
| rs802786 | 0.003 | 0.890 | 0.792 | 0.229 | 4.50 × 10⁻⁵ | 0.277 |
NA denotes not applicable
p value with the discovery group and first replication set (complete Belgian-Dutch population) lumped together.
Values based on HapMap release 21a, Phase II.
In the chr11q13.1 region, no evidence for allelic heterogeneity was found (data not shown).
RELN Expression in the Stapes Footplate and the Inner Ear
RT-PCR
Expression analysis via RT-PCR showed that reelin mRNA is expressed in both mouse and human ear structures (Figures 4A and 4B). Expression of Reln was detected in the cochlea of P6 mice, along with the known adaptor protein Dab1 and two known receptors for reelin, Lrp8 and Vldlr. RELN expression was also detected in human stapes footplate samples collected from patients who were undergoing translabyrinthine surgery for vestibular schwanoma and did not have otosclerosis.
Figure 4.
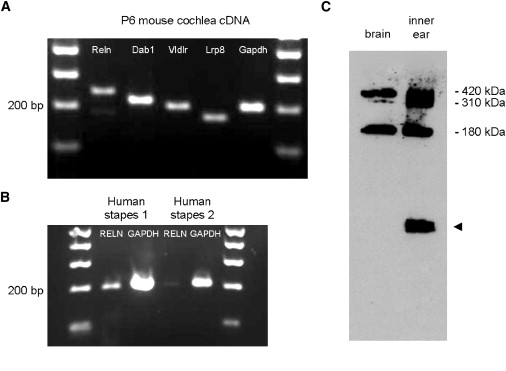
Reelin Expression in Inner Ear and Stapes Footplate
(A) RT-PCR analysis of P6 mouse cochlea (membranous part). P denotes postnatal day.
(B) RT-PCR analysis of adult human stapes footplates.
(C) Western blot analysis of P28 mouse brain and the complete inner ear (including surrounding cartilage). The arrow head indicates a nonspecific band detected by the secondary antibody.
Western Blot
Reelin was detected by western blot analysis of P28 mouse inner ear (Figure 4C). As compared to brain, all three major bands (420 kDa, 310 kDa, and 180 kDa) of Reln were detected by the G10 antibody in mouse inner ear. A nonspecific lower-molecular-weight band detected on western blot was also present when blots were probed with secondary antibody alone.
Real-Time PCR
Comparative expression of Reln in the inner ear, brain, and liver showed that Reln expression is highest in the brain. It peaks during development and then decreases after birth (Figure 5). This is consistent with earlier reports describing Reln mRNA expression in the brain during development.28 Although expression in the inner ear was 12-fold less than in the brain at P0, reelin inner ear expression increased after birth and was 7-fold less than brain expression at P3 and 4-fold less at P6. After P20, inner ear expression of reelin was highly variable. We confirmed this variability by analyzing inner ears from 31 additional mice (Figure S5). Variation in expression was not sex dependent.
Figure 5.
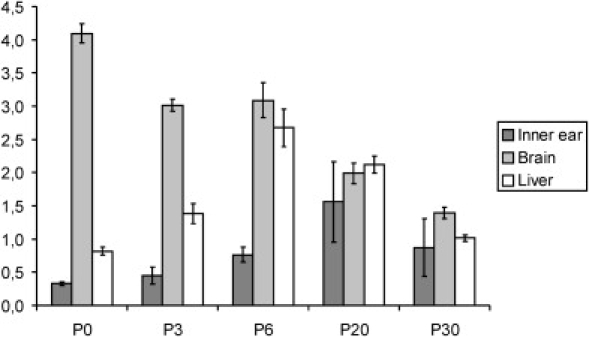
Expression Levels of Reln in Mice at Different Time Points after Birth
P denotes postnatal day. The error bars indicate SEM.
Discussion
By using pooled DNA samples in a GWA study, we were successful in identifying a region on chr7q22.1 that is strongly associated with otosclerosis. To our knowledge, this region has not previously been published. These results are of interest because the prior associations with COL1A1, TGFB1, BMP2, BMP4, and the RAA system account for only a small fraction of the relative risk for otosclerosis. This study also illustrates the value of pooling DNA samples as the first screening step in a GWA study.
Approximately 85% of 230 highly ranked SNPs identified by pooling were validated as true differences between cases and controls by individual genotyping of the discovery group (p values ranging from p = 10−7 to p = 0.05) (Table S2). In addition, the region with the strongest association, on chromosome 7q22.1, included six of the top 1000 SNPs identified in the pooling step (data not shown). Noteworthy is that the originally identified SNP (rs3914132) in this region was not in the top 200 ranked SNPs and was actually included in the validation list because its location was close to other SNPs in the top 1000. Thus, pooling of DNA samples can be considered a cost-effective strategy to screen for genetic associations with a case-control study design, provided that there are suitable confirmatory stages in the experimental design. In the staged design that we used, we selected the initially identified variants for replication, a strategy that has been shown previously to be very powerful and efficient (Figure 1).29
The strongest association signal that we found was on chromosome 7q22.1 (Table 2). The originally identified SNP was located in a large region of high LD that spreads from intron 1 to intron 4 of the RELN gene (Figure 2, Figure S4).25 This entire region, of approximately 180,000 bp, was chosen for fine mapping, and several SNPs across this entire region showed a strong association signal with otosclerosis. Testing for allelic heterogeneity suggested that there are two causal variants captured by either SNP rs3914132 or SNP rs7791481. The LD between these SNPs was rather low (Table 3),25 which also suggests that the significance of the second signal is not due to LD with the first signal. Analysis of the interaction between these two causal variants suggests that their actions are less than additive. We were unable to confirm the presence of a second disease-causing signal in the second independent replication group (the French population), possibly because this signal was not captured by the limited number of SNPs analyzed in this population.
The gene containing the association signal is RELN. Reelin has a crucial role in the regulation of neuronal migration and positioning in brain development.30 Its known functions are difficult to relate to otosclerosis, making it unclear how this gene could be involved in the disease. However, we demonstrated expression of RELN mRNA in human stapes footplate samples (Figure 4B), and this supports the GWA findings. In addition, two public human fetal cochlear cDNA databases, the Morton Human Fetal Cochlea cDNA Library EST Database (dbEST Library ID.371)31 and the Subtracted Human Cochlear Library EST Database (dbEST Library ID 1822), report reelin expression. Both databases derive results from cochleae of human fetuses of 16–22 weeks gestational age. Only membranous portions of the labyrinth were included; surrounding bony and cartilaginous elements were excluded.31
Expression of Reln mRNA was also detected in the membranous part of the cochlea of mice, together with known adaptor protein Dab1 and two known receptors for reelin, Lrp8 and Vldlr (Figure 4A). Ikeda and colleagues have noted embryonic expression at E12.5 in the precartilage temporal bone primordial.26 In addition, we followed Reln expression in the complete inner ear (with surrounding cartilage) of mice at different stages of development after birth (newborn, P3, P6, P20, and P30) (Figure 5). We were able to show increased expression shortly after birth, although by P20 and P30, expression was highly variable. Because the strain that we used for expression analysis was outbred and all mice were exposed to the same environment, this variability probably reflects genetic factors.32 It is remarkable that this variable expression is only present in the inner ear and not in the brain or liver, suggesting that the influence of genetic factors on expression is tissue specific.
We also demonstrated reelin protein expression in the P28 murine inner ear (with surrounding cartilage; Figure 4C). As reelin is secreted into the extracellular matrix, it is processed by metalloproteinases, which create several cleavage products.33 For example, in embryonic and adult brain extracts and body fluids, almost no full-length reelin is detected.34 The products that we observed in the inner ear have been described previously.33 In addition, reelin protein was recently identified in cochleae from rats treated with the chemotherapeutic drug cisplatin.35 In this study, reelin protein was upregulated in response to cisplatin treatment, suggesting a prosurvival response. Evidence for a prosurvival response through the PI3K-Akt pathway has been demonstrated and might play a role in the survival of hair cells in rats treated with cisplatin.36 Whether reelin acts under a similar mechanism in the otic capsule is unknown.
Although there is compelling evidence to suggest that the causative SNP is located in the gene RELN, it is also possible that this SNP influences a regulatory element for a neighboring gene and that RELN is not implicated in otosclerosis.37 However, RELN is a very large gene, and neighboring genes are located a great distance from the associated region. For example, the gene neighboring RELN proximally is SLC26A5, encoding the prestin protein (MIM 604943), in which mutations have been associated with nonsyndromic sensorineural hearing loss.38 Prestin is a motor protein that is highly and almost exclusively expressed in the outer hair cells (OHCs) of the cochlea.39 The associated region of high LD in RELN is located about 310,000 bp upstream of this gene, and LD with this gene is very low (Figure S4),25 but it cannot be excluded that regulatory elements for this gene are located in the associated region in RELN.37
Correction for multiple testing was difficult in this study because a staged design was used. When a genome-wide Bonferonni correction for 555,000 markers (number of SNPs on the Illumina HumanHap550 SNP chip) is used, a p value below 9.01 × 10⁻⁸ is considered significant. The association on chromosome 7q22.1 survives this correction, but the association on chromosome 11q13.1 does not. However, the latter association was replicated independently twice, and replication in independent populations is generally considered a stronger confirmation of an association than a very low p value.40 In addition, a GWA study using pooled samples is considered to be an initial screening step, making the Bonferonni correction too conservative for this type of study.41
It is also worth considering regions that replicated only once (Table 1). Because we limited testing to the originally identified variant, it is possible that for a few SNPs, we might have overlooked replication that resulted from allelic heterogeneity, differences in environmental factors, other genetic factors, or differences in LD structure in some regions.40,42,43 Testing additional markers in such regions might identify additional regions that are truly associated with otosclerosis.
In summary, we report a new strong association with otosclerosis on chromosome 7q22.1. This region is located in the gene RELN, and this association has not, to our knowledge, been previously identified. Our data are consistent with more than one variant of RELN being causally related to otosclerosis and having a role in otosclerosis, given that RELN expression was found in human stapes footplates samples and in human and mouse inner ear. Although it is true that the function of RELN known today is difficult to reconcile with our understanding of the pathogenesis of otosclerosis, perhaps this finding will help us reevaluate in a new light the molecular mechanisms that lead to this disease.
Supplemental Data
Supplemental Data include five figures and three tables and can be found with this article online at http://www.ajhg.org/.
Supplemental Data
Web Resources
The URLs for data presented herein are as follows:
HapMap, http://www.hapmap.org/
Hereditary Hearing Loss Homepage, http://webh01.ua.ac.be/hhh/
KASPar, http://www.kbioscience.co.uk/
Online Mendelian Inheritance in Man (OMIM), http://www.ncbi.nlm.nih.gov/omim/
SAS, http://www.sas.com/
SPSS, http://www.spss.com/
Acknowledgments
We would like to thank A.M. Goffinet for his helpful insights about the RELN pathway and Szabi Szelinger for technical assistance. I.S. is a fellow of the “Fonds voor Wetenschappelijk Onderzoek Vlaanderen” (FWO). M.T. is a fellow of the Institute for the Promotion of Innovation through Science and Technology in Flanders (IWT-Vlaanderen). This study was supported by grants from the European Commission (FP6 integrated project EuroHear LSHG-CT-20054-512063), the FWO (grant G.0138.07), and the University of Antwerp (TOP grant).
References
- 1.Dalton D.S., Cruickshanks K.J., Klein B.E., Klein R., Wiley T.L., Nondahl D.M. The impact of hearing loss on quality of life in older adults. Gerontologist. 2003;43:661–668. doi: 10.1093/geront/43.5.661. [DOI] [PubMed] [Google Scholar]
- 2.Declau F., Van Spaendonck M., Timmermans J.P., Michaels L., Liang J., Qiu J.P., Van de Heyning P. Prevalence of otosclerosis in an unselected series of temporal bones. Otol. Neurotol. 2001;22:596–602. doi: 10.1097/00129492-200109000-00006. [DOI] [PubMed] [Google Scholar]
- 3.Guild S. Histologic otosclerosis. Ann. Otol. Rhinol. Laryngol. 1944;53:246–267. [Google Scholar]
- 4.Schuknecht H.F., Kirchner J.C. Cochlear otosclerosis: fact or fantasy. Laryngoscope. 1974;84:766–782. doi: 10.1288/00005537-197405000-00008. [DOI] [PubMed] [Google Scholar]
- 5.Ramsay H.A., Linthicum F.H. Mixed hearing loss in otosclerosis: indication for long-term follow-up. Am. J. Otol. 1994;15:536–539. [PubMed] [Google Scholar]
- 6.Toynbee J. Pathological and surgical observations on the diseases of the ear. Med. Chri. Trans. 1861;24:190–205. doi: 10.1177/095952874102400115. [DOI] [PMC free article] [PubMed] [Google Scholar]
- 7.Fowler E.P. Otosclerosis in identical twins. A study of 40 pairs. Arch. Otolaryngol. 1966;83:324–328. doi: 10.1001/archotol.1966.00760020326006. [DOI] [PubMed] [Google Scholar]
- 8.Tomek M.S., Brown M.R., Mani S.R., Ramesh A., Srisailapathy C.R., Coucke P., Zbar R.I., Bell A.M., McGuirt W.T., Fukushima K. Localization of a gene for otosclerosis to chromosome 15q25-q26. Hum. Mol. Genet. 1998;7:285–290. doi: 10.1093/hmg/7.2.285. [DOI] [PubMed] [Google Scholar]
- 9.Van Den Bogaert K., Govaerts P.J., Schatteman I., Brown M.R., Caethoven G., Offeciers F.E., Somers T., Declau F., Coucke P., Van de Heyning P. A second gene for otosclerosis, OTSC2, maps to chromosome 7q34–36. Am. J. Hum. Genet. 2001;68:495–500. doi: 10.1086/318185. [DOI] [PMC free article] [PubMed] [Google Scholar]
- 10.Chen W., Campbell C.A., Green G.E., Van Den Bogaert K., Komodikis C., Manolidis L.S., Aconomou E., Kyamides Y., Christodoulou K., Faghel C. Linkage of otosclerosis to a third locus (OTSC3) on human chromosome 6p21.3–22.3. J. Med. Genet. 2002;39:473–477. doi: 10.1136/jmg.39.7.473. [DOI] [PMC free article] [PubMed] [Google Scholar]
- 11.Brownstein Z., Goldfarb A., Levi H., Frydman M., Avraham K.B. Chromosomal mapping and phenotypic characterization of hereditary otosclerosis linked to the OTSC4 locus. Arch. Otolaryngol. Head Neck Surg. 2006;132:416–424. doi: 10.1001/archotol.132.4.416. [DOI] [PubMed] [Google Scholar]
- 12.Van Den Bogaert K., De Leenheer E.M., Chen W., Lee Y., Nurnberg P., Pennings R.J., Vanderstraeten K., Thys M., Cremers C.W., Smith R.J. A fifth locus for otosclerosis, OTSC5, maps to chromosome 3q22–24. J. Med. Genet. 2004;41:450–453. doi: 10.1136/jmg.2004.018671. [DOI] [PMC free article] [PubMed] [Google Scholar]
- 13.Thys M., Van Den Bogaert K., Iliadou V., Vanderstraeten K., Dieltjens N., Schrauwen I., Chen W., Eleftheriades N., Grigoriadou M., Pauw R.J. A seventh locus for otosclerosis, OTSC7, maps to chromosome 6q13–16.1. Eur. J. Hum. Genet. 2007;15:362–368. doi: 10.1038/sj.ejhg.5201761. [DOI] [PubMed] [Google Scholar]
- 14.Bel Hadj Ali I., Thys M., Beltaief N., Schrauwen I., Hilgert N., Vanderstraeten K., Dieltjens N., Mnif E., Hachicha S., Besbes G. A new locus for otosclerosis, OTSC8, maps to the pericentromeric region of chromosome 9. Hum. Genet. 2008;123:267–272. doi: 10.1007/s00439-008-0470-3. [DOI] [PubMed] [Google Scholar]
- 15.Chen W., Meyer N.C., McKenna M.J., Pfister M., McBride D.J., Fukushima K., Thys M., Van Camp G., Smith R.J. Single-nucleotide polymorphisms in the COL1A1 regulatory regions are associated with otosclerosis. Clin. Genet. 2007;71:406–414. doi: 10.1111/j.1399-0004.2007.00794.x. [DOI] [PubMed] [Google Scholar]
- 16.Thys M., Schrauwen I., Vanderstraeten K., Janssens K., Dieltjens N., Van Den Bogaert K., Fransen E., Chen W., Ealy M., Claustres M. The coding polymorphism T263I in TGF-{beta}1 is associated with otosclerosis in two independent populations. Hum. Mol. Genet. 2007;16:2021–2030. doi: 10.1093/hmg/ddm150. [DOI] [PubMed] [Google Scholar]
- 17.Schrauwen I., Thys M., Vanderstraeten K., Fransen E., Dieltjens N., Huyghe J.R., Ealy M., Claustres M., Cremers C.R., Dhooge I. Association of bone morphogenetic proteins with otosclerosis. J. Bone Miner. Res. 2008;23:507–516. doi: 10.1359/JBMR.071112. [DOI] [PMC free article] [PubMed] [Google Scholar]
- 18.Imauchi Y., Jeunemaitre X., Boussion M., Ferrary E., Sterkers O., Grayeli A.B. Relation between renin-angiotensin-aldosterone system and otosclerosis: a genetic association and in vitro study. Otol. Neurotol. 2008;29:295–301. doi: 10.1097/mao.0b013e318164d12c. [DOI] [PubMed] [Google Scholar]
- 19.Pearson J.V., Huentelman M.J., Halperin R.F., Tembe W.D., Melquist S., Homer N., Brun M., Szelinger S., Coon K.D., Zismann V.L. Identification of the genetic basis for complex disorders by use of pooling-based genomewide single-nucleotide-polymorphism association studies. Am. J. Hum. Genet. 2007;80:126–139. doi: 10.1086/510686. [DOI] [PMC free article] [PubMed] [Google Scholar]
- 20.Moskvina V., Holmans P., Schmidt K.M., Craddock N. Design of case-controls studies with unscreened controls. Ann. Hum. Genet. 2005;69:566–576. doi: 10.1111/j.1529-8817.2005.00175.x. [DOI] [PubMed] [Google Scholar]
- 21.Miller S.A., Dykes D.D., Polesky H.F. A simple salting out procedure for extracting DNA from human nucleated cells. Nucleic Acids Res. 1988;16:1215. doi: 10.1093/nar/16.3.1215. [DOI] [PMC free article] [PubMed] [Google Scholar]
- 22.Macgregor S., Zhao Z.Z., Henders A., Nicholas M.G., Montgomery G.W., Visscher P.M. Highly cost-efficient genome-wide association studies using DNA pools and dense SNP arrays. Nucleic Acids Res. 2008;36:e35. doi: 10.1093/nar/gkm1060. [DOI] [PMC free article] [PubMed] [Google Scholar]
- 23.de Bakker P.I., Yelensky R., Pe'er I., Gabriel S.B., Daly M.J., Altshuler D. Efficiency and power in genetic association studies. Nat. Genet. 2005;37:1217–1223. doi: 10.1038/ng1669. [DOI] [PubMed] [Google Scholar]
- 24.Barrett J.C., Fry B., Maller J., Daly M.J. Haploview: analysis and visualization of LD and haplotype maps. Bioinformatics. 2005;21:263–265. doi: 10.1093/bioinformatics/bth457. [DOI] [PubMed] [Google Scholar]
- 25.International HapMap Consortium A haplotype map of the human genome. Nature. 2005;437:1299–1320. doi: 10.1038/nature04226. [DOI] [PMC free article] [PubMed] [Google Scholar]
- 26.Ikeda Y., Terashima T. Expression of reelin, the gene responsible for the reeler mutation, in embryonic development and adulthood in the mouse. Dev. Dyn. 1997;210:157–172. doi: 10.1002/(SICI)1097-0177(199710)210:2<157::AID-AJA8>3.0.CO;2-F. [DOI] [PubMed] [Google Scholar]
- 27.Hellemans J., Mortier G., De Paepe A., Speleman F., Vandesompele J. qBase relative quantification framework and software for management and automated analysis of real-time quantitative PCR data. Genome Biol. 2007;8:R19. doi: 10.1186/gb-2007-8-2-r19. [DOI] [PMC free article] [PubMed] [Google Scholar]
- 28.Schiffmann S.N., Bernier B., Goffinet A.M. Reelin mRNA expression during mouse brain development. Eur. J. Neurosci. 1997;9:1055–1071. doi: 10.1111/j.1460-9568.1997.tb01456.x. [DOI] [PubMed] [Google Scholar]
- 29.Clarke G.M., Carter K.W., Palmer L.J., Morris A.P., Cardon L.R. Fine mapping versus replication in whole-genome association studies. Am. J. Hum. Genet. 2007;81:995–1005. doi: 10.1086/521952. [DOI] [PMC free article] [PubMed] [Google Scholar]
- 30.Quattrocchi C.C., Wannenes F., Persico A.M., Ciafre S.A., D'Arcangelo G., Farace M.G., Keller F. Reelin is a serine protease of the extracellular matrix. J. Biol. Chem. 2002;277:303–309. doi: 10.1074/jbc.M106996200. [DOI] [PubMed] [Google Scholar]
- 31.Robertson N.G., Khetarpal U., Gutierrez-Espeleta G.A., Bieber F.R., Morton C.C. Isolation of novel and known genes from a human fetal cochlear cDNA library using subtractive hybridization and differential screening. Genomics. 1994;23:42–50. doi: 10.1006/geno.1994.1457. [DOI] [PubMed] [Google Scholar]
- 32.Cheung V.G., Conlin L.K., Weber T.M., Arcaro M., Jen K.Y., Morley M., Spielman R.S. Natural variation in human gene expression assessed in lymphoblastoid cells. Nat. Genet. 2003;33:422–425. doi: 10.1038/ng1094. [DOI] [PubMed] [Google Scholar]
- 33.Lambert de Rouvroit C., de Bergeyck V., Cortvrindt C., Bar I., Eeckhout Y., Goffinet A.M. Reelin, the extracellular matrix protein deficient in reeler mutant mice, is processed by a metalloproteinase. Exp. Neurol. 1999;156:214–217. doi: 10.1006/exnr.1998.7007. [DOI] [PubMed] [Google Scholar]
- 34.Tissir F., Goffinet A.M. Reelin and brain development. Nat. Rev. Neurosci. 2003;4:496–505. doi: 10.1038/nrn1113. [DOI] [PubMed] [Google Scholar]
- 35.Jamesdaniel S., Ding D., Kermany M.H., Davidson B.A., Knight P.R., Salvi R., Coling D.E. Proteomic analysis of the balance between survival and cell death responses in cisplatin-mediated ototoxicity. J. Proteome Res. 2008;7:3516–3524. doi: 10.1021/pr8002479. [DOI] [PMC free article] [PubMed] [Google Scholar]
- 36.Ohkubo N., Vitek M.P., Morishima A., Suzuki Y., Miki T., Maeda N., Mitsuda N. Reelin signals survival through Src-family kinases that inactivate BAD activity. J. Neurochem. 2007;103:820–830. doi: 10.1111/j.1471-4159.2007.04804.x. [DOI] [PubMed] [Google Scholar]
- 37.Nobrega M.A., Ovcharenko I., Afzal V., Rubin E.M. Scanning human gene deserts for long-range enhancers. Science. 2003;302:413. doi: 10.1126/science.1088328. [DOI] [PubMed] [Google Scholar]
- 38.Liu X.Z., Ouyang X.M., Xia X.J., Zheng J., Pandya A., Li F., Du L.L., Welch K.O., Petit C., Smith R.J. Prestin, a cochlear motor protein, is defective in non-syndromic hearing loss. Hum. Mol. Genet. 2003;12:1155–1162. doi: 10.1093/hmg/ddg127. [DOI] [PubMed] [Google Scholar]
- 39.Zheng J., Shen W., He D.Z., Long K.B., Madison L.D., Dallos P. Prestin is the motor protein of cochlear outer hair cells. Nature. 2000;405:149–155. doi: 10.1038/35012009. [DOI] [PubMed] [Google Scholar]
- 40.Neale B.M., Sham P.C. The future of association studies: gene-based analysis and replication. Am. J. Hum. Genet. 2004;75:353–362. doi: 10.1086/423901. [DOI] [PMC free article] [PubMed] [Google Scholar]
- 41.Nyholt D.R. Genetic case-control association studies–correcting for multiple testing. Hum. Genet. 2001;109:564–567. doi: 10.1007/s00439-001-0611-4. [DOI] [PubMed] [Google Scholar]
- 42.Colhoun H.M., McKeigue P.M., Davey Smith G. Problems of reporting genetic associations with complex outcomes. Lancet. 2003;361:865–872. doi: 10.1016/s0140-6736(03)12715-8. [DOI] [PubMed] [Google Scholar]
- 43.Kathiresan S., Newton-Cheh C., Gerszten R.E. On the interpretation of genetic association studies. Eur. Heart J. 2004;25:1378–1381. doi: 10.1016/j.ehj.2004.06.035. [DOI] [PubMed] [Google Scholar]
Associated Data
This section collects any data citations, data availability statements, or supplementary materials included in this article.