

Abstract
Only a small proportion of genetic variation in complex traits has been explained by SNPs from genome-wide association studies (GWASs). We report the results from two GWASs for serum markers of iron status (serum iron, serum transferrin, transferrin saturation with iron, and serum ferritin), which are important in iron overload (e.g., hemochromatosis) and deficiency (e.g., anemia) conditions. We performed two GWASs on samples of Australians of European descent. In the first GWAS, 411 adolescent twins and their siblings were genotyped with 100K SNPs. rs1830084, 10.8 kb 3′ of TF, was significantly associated with serum transferrin (p total association test = 1.0 × 10⁻⁹; p within-family test = 2.2 × 10⁻⁵). In the second GWAS on an independent sample of 459 female monozygotic (MZ) twin pairs genotyped with 300K SNPs, we found rs3811647 (within intron 11 of TF, HapMap CEU r2 with rs1830084 = 0.86) was significantly associated with serum transferrin (p = 3.0 × 10⁻¹⁵). In the second GWAS, we found two additional and independent SNPs on TF (rs1799852 and rs2280673) and confirmed the known C282Y mutation in HFE to be independently associated with serum transferrin. The three variants in TF (rs3811647, rs1799852 and rs2280673) plus the HFE C282Y mutation explained ∼40% of genetic variation in serum transferrin (p = 7.8 × 10⁻²⁵). These findings are potentially important for our understanding of iron metabolism and of regulation of hepatic protein secretion, and also strongly support the hypothesis that the genetic architecture of some endophenotypes may be simpler than that of disease.
Main Text
Iron is essential for biochemical functions such as oxygen transport and oxidative phosphorylation. Excessive iron can cause iron-overload-related liver diseases (e.g., hemochromatosis [MIM 235200]), whereas iron deficiency can lead to anemia. Iron status can be assessed by measuring the levels of serum iron, serum transferrin, transferrin saturation with iron, and serum ferritin. Approximately a quarter to a half of the variation in these iron markers is due to genetic factors.1,2 The C282Y (a cystine to tyrosine mutation at position 282) and H63D (a histidine to aspartate mutation at position 63) mutations in the hemochromatosis gene (HFE [MIM 235200]) are known for affecting iron metabolism. These mutations can lead to genetic hemochromatosis, but they only explain a small proportion of the heritability of iron status (∼5%).1,2
To find additional genetic variants associated with variation in iron status, we first conducted a GWAS on 411 individuals (twins and their sibs) from 150 Australian nuclear families of European descent using the Affymetrix GeneChip Human Mapping 100K Set, consisting of 50K XbaI and 50K Hind chips (100K GWAS). Subjects were recruited by the Genetic Epidemiology Laboratory of the Queensland Institute of Medical Research, Australia, as part of adolescent-twin studies on various phenotypes, including melanoma risk factors3 and cognition.4 We determined iron status by measuring the levels of serum iron (μmol/L), serum transferrin (g/L), and transferrin saturation with iron (%) and serum ferritin (μg/L) at up to three visits (age 12, 14, and 16). Because of the skewed distribution, serum-ferritin levels were transformed (log10) before the analyses. Methods for phenotypic measurements have been described elsewhere.2 To remove the need to accommodate the correlated nature of the data, we used the mean of the measurements across ages in the association analyses (Table 1 and Table S1 available online). The analysis on the mean of multiple measures is also more powerful than analysis that is based on a single measurement and discarding the others.
Table 1.
Descriptive Statistics of the Initial Sample from the 100K GWAS
| Measure | Sex | N | Min | Max | Mean | SD |
|---|---|---|---|---|---|---|
| Age (years) | Male | 203 | 10.05 | 18.34 | 14.28 | 1.6 |
| Female | 208 | 10.22 | 19.19 | 14.19 | 1.77 | |
| Total | 411 | 10.05 | 19.19 | 14.23 | 1.68 | |
| Serum iron (μmol/L) | Male | 203 | 6.65 | 36 | 17.54 | 4.90 |
| Female | 206 | 4.3 | 33.8 | 16.99 | 5.29 | |
| Total | 409 | 4.3 | 36 | 17.26 | 5.11 | |
| Serum transferrin (g/L) | Male | 203 | 2.25 | 3.73 | 2.93 | 0.33 |
| Female | 208 | 2.01 | 4.15 | 2.94 | 0.37 | |
| Total | 411 | 2.01 | 4.15 | 2.93 | 0.35 | |
| Transferrin saturation (%) | Male | 203 | 8.48 | 47.64 | 24.22 | 6.95 |
| Female | 206 | 5.6 | 57.34 | 23.45 | 7.60 | |
| Total | 409 | 5.6 | 57.34 | 23.83 | 7.29 | |
| Log10 (serum ferritin) μg/L | Male | 203 | 0.76 | 2.27 | 1.67 | 0.21 |
| Female | 208 | 0.7 | 2.21 | 1.56 | 0.26 | |
| Total | 411 | 0.7 | 2.27 | 1.61 | 0.24 |
Note that the values are the mean of measurements at up to three visits.
Initially, a total of 676 individuals (215 parents and 461 children) from 169 nuclear families were genotyped. Monozygotic (MZ) twin pairs were present in 64 families (58 MZ pairs, 4 MZ triplets, and 2 set of triplets containing an MZ pair). The number of children per family ranged from two to five with an average of 2.7. Both parents were genotyped in 104 families, one parent was genotyped in seven families, and no parent was genotyped for the remaining 58 families, but none of them had iron-related phenotypes measured. The expected relationships between members of a family were confirmed through the use of identity by state (IBS) statistics across all SNPs.
A total of 116,204 SNPs from the Affymetrix GeneChip Human Mapping 100K Set were genotyped in the sample. Nonautosomal SNPs were removed. Any discordant genotypes between MZ pairs were also removed. Parent-offspring genotype consistency was only checked for the XbaI chip because parents were only genotyped with that chip. Genotypes for all family members were removed in the case of a mismatch. After these removals, there were 113,199 SNPs. From these SNPs, we further removed 3,876 monomorphic SNPs, 1,884 SNPs that failed the Hardy-Weinberg Equilibrium (HWE) test (using the Mendel Statistical Package5) at p ≤ 0.001, 6,592 SNPs in which the minor allele frequency (MAF) was less than 0.01, and one duplicate SNP. After the cleaning process, there were 100,846 SNPs that were tested for their association with the phenotypes related to iron status.
We removed 19 families that were ethnic outliers on the basis of either self-reported ancestry or a multidimensional scaling (MDS) plot (Figure S1). To avoid disproportionate contribution to the test statistics from a very small number of individuals with extreme phenotypes, we also removed individuals where their residuals after correcting for covariates (sex, age, age2, sex∗age, and sex∗age2) were more than ±4 SD from the mean (i.e., one individual for transferrin saturation, two individuals for serum ferritin, and none for serum iron and serum transferrin) for any given phenotype. The final data consisted of 411 phenotyped individuals (twins and their siblings) from 150 nuclear families. The means of the standardized residuals after covariate correction were used for the analyses.
Family-based genome-wide association analyses were performed in QTDT,6 where both total and within family association tests were performed with an additive model. Both tests use variance components to model the phenotypic similarities between related individuals. Although the within-family association test is robust to population stratification, its power is limited compared to the total association test because it only uses information from individuals with heterozygous parents. The model included an additive genetic effect for the SNP, a polygenic effect, an environmental effect common to all family members, an environmental effect common to twins, and a residual individual-specific environmental effect.
The second GWAS was performed in an independent sample of 459 female monozygotic (MZ) twin pairs, genotyped with 315,887 SNPs from the Illumina HumanHap300 (300K GWAS). The subjects were Australian adult female MZ twin pairs of European descent recruited through the Australian Twin Registry. They were part of a GenomEUtwin study7 that used genome-wide analyses of twin and population cohorts to identify genes in common diseases. They had a mean of age of 46.71 years and the descriptive statistics of the final data set are presented in Table 2 and Table S2. The measurements of iron status have been described elsewhere.2
Table 2.
Descriptive Statistics of the Second GWAS Sample from the 300K GWAS
| Measure | Sex | N (pairs) | Min | Max | Mean | SD |
|---|---|---|---|---|---|---|
| Age (years) | Female | 441 | 30.00 | 91.00 | 46.71 | 12.27 |
| Serum iron (μmol/L) | Female | 441 | 4.35 | 43.70 | 17.26 | 5.85 |
| Serum transferrin (g/L) | Female | 441 | 1.53 | 5.30 | 2.92 | 0.50 |
| Transferrin saturation (%) | Female | 439 | 5.30 | 72.90 | 24.15 | 8.72 |
| Log10 (serum ferritin) μg/L | Female | 441 | 0.70 | 3.05 | 1.81 | 0.38 |
Note that the values are the mean of measurements of the MZ pairs.
Initially, there were 477 individuals (one individual from each MZ pair) genotyped with the Illumina HumanHap300 (300K GWAS). We removed 15 individuals because of low genotyping rate (≤0.90). From the MDS plot (Figure S2), three individuals were identified to be of mixed ancestry and thus removed from the analyses. As with the 100K GWAS, for any given phenotype we also removed individuals in which their residuals after correcting for covariates (i.e., age) were more than ±4 SD from the mean (i.e., three, two, and five individuals for serum iron, serum transferrin, and transferrin saturation, respectively, and none for serum ferritin). There were 318,237 SNPs genotyped in the 300K GWAS sample. As part of the QC process, we removed 548 SNPs that failed the HWE test (p ≤ 0.001), 1,605 SNPs with more than 10% missing genotypes, and 291 SNPs with MAF < 0.01. Thus, the final number of twin pairs and SNPs used in the association analyses were 459 and 315,887, respectively.
The MZ phenotypes were first adjusted for the effect of age (i.e., −0.063 μmol/L/year, −0.007 g/L/year, −0.045%/year, and 0.012/year for serum iron, serum transferrin, transferrin saturation, and serum ferritin, respectively). The mean of the standardized residuals for the two members of each MZ pair was used for the analyses. The association was analyzed in PLINK with an additive genetic model.8 Visualization and annotation of the GWAS results were performed in WGAViewer.9
From the first (adolescent) GWAS, SNP rs1830084 (MAF 0.36), 10.8 kb 3′ of the transferrin gene (TF [MIM 190000]), was the most significantly associated SNP with serum transferrin (p total association test = 1.0 × 10⁻⁹; p within-family test = 2.2 × 10⁻⁵) (Table S3). Each copy of the A allele of rs1830084 increased serum-transferrin levels by 0.43 SD of the mean phenotype, or ∼0.38 phenotypic SD. The effect was not significantly different between males and females (p = 0.23). This SNP explained ∼7.7% of variation in serum transferrin and had no effect on the other iron markers. There were no typed SNPs significantly associated with other iron status phenotypes (Figure 1).
Figure 1.
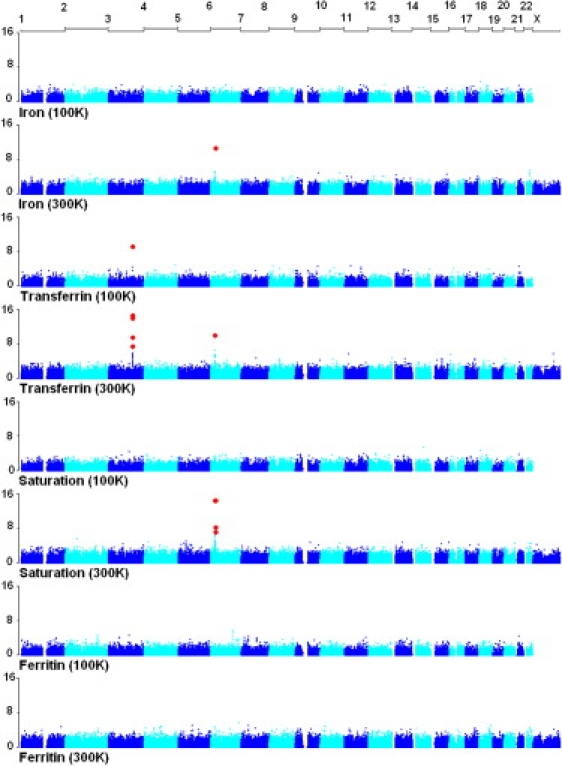
GWAS Results for Iron Status in the 100K and 300K Studies
On the x and y axis are chromosome number and −log10(p) value, respectively. Red dots indicate the SNPs that reached genome-wide significance (p < 0.05) after a Bonferroni correction for multiple testing.
SNP rs1830084 (which had shown significant results in the first GWAS) was not on the HumanHap300 chip used for the second GWAS, but two SNPs in high-linkage disequilibrium (LD) with it were, rs3811647 (within intron 11 of TF, HapMap CEU r2 = 0.86) and rs6794945 (20.8 kb from 3′ of TF, HapMap CEU r2 = 0.93), and these SNPs were significantly associated with serum-transferrin concentration (p = 3.0 × 10⁻¹⁵ and 5.0 × 10⁻¹⁵, respectively) (Figures 1 and 2). These were the top two SNPs based on their p values (Table S4), and their effects were inseparable because of their high LD (r2 = 0.86). rs3811647 was also associated with transferrin saturation (p = 0.002) and serum ferritin (p = 0.03), but not with serum iron (p = 0.81). The effect of rs3811647 on serum transferrin was additive with each A allele increasing serum transferrin by 0.46 SD of the MZ mean, or ∼0.40 phenotypic SD. This SNP explains 13% of the variation in MZ means or ∼10.3% of serum-transferrin variation in the population. Its effect on the other iron phenotypes was much smaller (2.1 and 1.1% of the variation in MZ means for transferrin saturation and serum ferritin) (Table 3).
Figure 2.

The Plots of −log10(P) for the Associations between SNPs in TF ± 60 kb and Serum-Transferrin Levels in 100K and 300K GWAS
The linkage disequilibrium (LD) plot for the SNPs in the region from the HapMap CEU population is shown in r2.
Table 3.
Additive Effects ± SE of Significant SNPs on Iron Status in Female MZ Twins in the 300K GWAS
| Gene | SNP |
Serum Iron |
Serum Transferrin |
Transferrin Saturation |
Serum Ferritin |
||||||||
|---|---|---|---|---|---|---|---|---|---|---|---|---|---|
| Effect in SD | R2 | p | Effect in SD | R2 | p | Effect in SD | R2 | p | Effect in SD | R2 | p | ||
| TF | rs3811647 | −0.01 ± 0.06 | 0.00 | 0.81 | 0.46 ± 0.06 | 0.13 | 3.0 × 10⁻¹⁵ | −0.17 ± 0.06 | 0.02 | 2.1 × 10⁻³ | −0.13 ± 0.06 | 0.01 | 0.03 |
| TF | rs1799852 | 0.03 ± 0.09 | 0.00 | 0.71 | −0.43 ± 0.09 | 0.05 | 4.7 × 10⁻⁶ | 0.17 ± 0.09 | 0.01 | 0.06 | 0.20 ± 0.10 | 0.01 | 0.04 |
| TF | rs2280673 | 0.01 ± 0.06 | 0.00 | 0.84 | 0.22 ± 0.06 | 0.03 | 2.3 × 10⁻⁴ | −0.04 ± 0.05 | 0.00 | 0.42 | −0.18 ± 0.06 | 0.02 | 2.5 × 10⁻³ |
| HFE | rs1800562 | 0.66 ± 0.10 | 0.10 | 3.5 × 10⁻¹¹ | −0.68 ± 0.10 | 0.09 | 1.1 × 10⁻¹⁰ | 0.80 ± 0.10 | 0.13 | 4.3 × 10⁻¹⁵ | 0.44 ± .11 | 0.04 | 4.5 × 10⁻⁵ |
| TMPRSS6 | rs4820268 | −0.24 ± 0.05 | 0.05 | 3.7 × 10⁻⁶ | −0.01 ± 0.06 | 0.00 | 0.87 | −0.22 ± 0.05 | 0.04 | 1.96 × 10⁻⁵ | 0.01 ± 0.06 | 0.00 | 0.80 |
R2 is the proportion of phenotypic variance in MZ means explained by the SNP.
In addition to SNPs in TF, we also confirmed the association2 of the known C282Y mutation in HFE (rs1800562) with iron status in the 300K GWAS. rs1800562 was associated with serum iron (p = 3.5 × 10⁻¹¹), serum transferrin (p = 1.1 × 10⁻¹⁰), transferrin saturation (p = 4.3 × 10⁻¹⁵), and serum ferritin (p = 4.5 × 10⁻⁵). rs1800562 explained 9.5%, 9.1%, 13.2%, and 3.7% of the variation in MZ means of serum-iron, serum-transferrin, transferrin-saturation, and serum-ferritin levels, respectively (Table 3).
The C282Y mutation (rs1800562) was not part of the 100K Affymetrix GeneChip, and there was no proxy for it. The other HFE mutation, i.e., H63D mutation (rs1799945) was neither on 100K nor 300K chips, and there was no proxy for it. Therefore, we could not determine the effect of either C282Y or H63D mutations in the 100K GWAS and could not redetermine the contribution of the H63D mutation to the variation in iron status in the 300K GWAS.
Recently, Finberg et al.10 demonstrated that iron-deficiency anemia refractory to oral iron therapy can be caused by mutations in the transmembrane protease, serine 6 gene (TMPRSS6 [MIM 609862]). This gene codes for a transmembrane serine protease, which has a role in detecting iron deficiency and regulating hepcidin expression.11 In our 300K GWAS, several SNPs within this gene were associated with serum-iron levels and transferrin saturation (Table S5); in particular, a synonymous coding SNP in exon 13 (rs4820268, p = 3.7 × 10⁻⁶ and 2.0 × 10⁻⁵, respectively).
In the 300K GWAS, there were 16 additional SNPs within 60 kb of TF associated with serum transferrin at nominal p < 0.05 (Table S6). To determine whether there are multiple SNPs in this region contributing to variation in serum transferrin, we fitted a stepwise multiple regression including those SNPs (excluding rs6794945, which is highly correlated with rs3811647 [HapMap CEU r2 = 0.86]) together with the HFE C282Y mutation. As a result, we found two additional SNPs (in addition to rs3811647), rs1799852 (MAF 0.09), and rs2280673 (MAF 0.34), which were independently influencing variation in serum transferrin (nominal p = 4.7 × 10⁻⁶ and 2.3 × 10⁻⁴, respectively). These SNPs explained an additional 2.2% and 1.7% of variation in MZ mean of serum transferrin. These estimates are likely to be biased upward by multiple testing, but the ascertainment (2 out of 16) was not strong and significance was high, so the bias is likely to be small. rs1799852 and rs2280673 were also associated with serum ferritin (p = 0.04 and 0.003) but not with serum iron or transferrin saturation.
Genetic variants within TF have previously been studied for their association with iron status,12–16 but to our knowledge the associations between SNPs rs3811647, rs1799852, and rs2280673 with serum transferrin levels have not been reported elsewhere. In addition, the main TF SNP, rs3811647, is not only common in our samples but also in other human populations. A MAF of 0.36, 0.36, 0.52, and 0.23 were reported in the four HapMap populations (CEU, CHB, JPT, and YRI, respectively). The C282Y mutation is only polymorphic in the CEU population with a MAF of 0.04.17
The reported associations in these studies were robust to population stratification. In the 100K GWAS, the within-family test of the association removed the effect of population stratification because it tested the alleles that were transmitted from the parents to their offspring. In addition, lambda values18 of 1.001, 0.999, 1.009, and 1.003 for the total association tests of serum iron, serum transferrin, transferrin saturation, and serum ferritin as well as Q-Q plots indicated that the residual population-stratification effects were very small or absent (Figure S3). The corresponding lambda values for the 300K GWAS of 1.004, 1.003, 1.015, and 1.001 and Q-Q plots also indicated that the effect of population stratification on this sample was minimal (Figure S4).
Both GWAS analyses were performed on the mean of a number of observations. In the 100K GWAS, the mean was over repeated observations per individual, varying from one to three (Table 1 and Table S1). In the 300K GWAS, the mean was from observations on pairs of monozygotic twins (Table 2 and Table S2). In general, the variance of the mean of n observations is [(1 − r)/n + r]var(y), with r representing the intraclass correlation and var(y) representing the variance in the population. For obtaining the estimated effect size and the proportion of variance explained in the population, the estimates from the means should therefore be scaled with the ratio of the standard deviations of the mean phenotype and individual phenotypes (Tables S1 and S2). Similarly, the proportion of phenotypic variance explained in the population is [(1 − r)/n + r] multiplied by the proportion of variance of the mean phenotypes explained by a SNP. For example, the mean of serum transferrin in 300K GWAS was based on n = 2 and r ∼0.56, so that the variance of the means is ∼0.78 of the variance in the population. Therefore, the proportion of phenotypic variance explained in the population is 0.78 of the proportion of variance in the mean phenotype. The effect size in phenotypic standard deviations is √0.78 ∼0.88 of the effect size expressed in standard deviations of the mean phenotype.
From a database of gene expression,19 we found that two SNPs that significantly affected serum-transferrin concentration within TF in the 300K GWAS (i.e., rs1358024 and rs1115219, HapMap CEU r2 with rs3811647 is 0.38 and 0.18, respectively) were also significantly associated with the level of mRNA expression of the signal-recognition particle receptor, B subunit gene (SRPRB) (p = 3.5 × 10⁻¹⁰ and 1.9 × 10⁻⁸, respectively). This gene is 27 kb distant from TF and encodes the signal-recognition particle receptor that is required for targeting of secreted proteins20 (e.g., serum transferrin). We also identified a SNP in SRPRB (rs10512913, HapMap CEU r2 with rs3811647 is 0.18) that was associated with both our serum-transferrin concentration and the expression of SRPRB mRNA (p = 2.0 × 10⁻⁵ and 2.1 × 10⁻⁸, respectively) (Tables S6 and S7). These observations are consistent with a possible causative relationship between SRPRB-transcript variation and serum-transferrin concentration.
The presented statistical significances and the estimated effect sizes should be viewed in terms of the complexity of the present study. First, all presented p values were unadjusted for multiple comparison. For the 100K GWAS, the reference p values after Bonferroni correction that correspond to global significance at 5% and 1% were 5 × 10⁻⁷ and 10−7, respectively. The corresponding p values for the 300K GWAS were 1.6 × 10⁻⁷ and 3.2 × 10⁻⁸, respectively. Second, the estimated proportions of genetic variance explained by SNPs were based on the assumption that the estimated proportion of phenotypic variance and heritability were accurate.
The samples used in this study were adolescent twins and their siblings (the 100K GWAS) and adult female MZ twins (the 300K GWAS). There were a number of issues that were related to these samples and that are worth discussion. First, the generalization of the results from samples of twins may not be applicable to the general population. However, to our knowledge there is no evidence to suggest that there are phenotypic differences in the relevant age groups between twins and nontwins in relation to serum markers of iron status. Second, the subjects who participated in this study were volunteers and may not be a random sample from the population. However, it is difficult to see how this type of participation bias will have effects on the association between SNPs and phenotypes such as serum markers of iron status. Third, the association between the genetic variant in TF (rs1830084 or rs3811647) and serum transferrin was evident in two samples with different age ranges. This indicated that the SNPs were associated with serum transferrin in both adolescent and adult samples.
Variations in serum markers for iron status are known to be influenced by the time of the day when the blood was collected (particularly for serum iron)2 and menopausal status (particularly for serum ferritin).21 In the 100K GWAS, the subjects were adolescents and their bloods were collected at approximately the same time of the day for all subjects. However, in the 300K GWAS, the bloods were collected differently throughout the day and some subjects had reached menopause. To check whether the effects of SNPs on the serum markers of iron status were confounded by the effect of the collection time and menopausal status, we performed additional association analyses in the 300K GWAS by adjusting for the effects of the collection time and menopausal status. The correlations between −log10(p) of the association tests by including and excluding the collection time and menopausal status as covariates were very high (range: 0.89–0.99) (Figure S5). Importantly, this adjustment did not have any effect on the top hits (top right-hand corners in Figure S5). Hence, the results presented were not confounded by the effects of the collection time and menopausal status.
Overall, the genetic variants identified in 300K GWAS (three SNPs in TF [rs3811647, rs1799852, and rs2280673] and the C282Y mutation in HFE) explained 26% of the serum-transferrin level variation between MZ means, or ∼20% of the phenotypic variance. Whitfield et al.2 estimated the heritability of serum transferrin for women to be 0.49. Therefore, ∼40% of the genetic variation in serum transferrin in the population can be explained by only a handful of genetic variants in two genes. This finding is remarkably different from that reported for other disease and quantitative traits.22,23 All significant TF SNPs had pleiotropic effects on serum ferritin, but only rs3811647 had a pleiotropic effect on transferrin saturation. The pleiotropic effects of the TF SNPs on serum iron were not statistically significant. In addition, we have replicated results showing that the C282Y mutation in HFE has a significant effect on iron status and provide evidence that common variation in TMPRSS6 is associated with serum iron and transferrin saturation. Our results are important for understanding of iron metabolism and iron-related disorders, such as anemia and iron overload. Because a large proportion of genetic variation in serum-transferrin levels can be explained by only a handful of SNPs at two loci, this is an example of a relatively simple genetic architecture of an endophenotype. GWASs on such traits may be more efficient and effective than GWASs for disease.
Acknowledgments
This work was supported by the National Health and Medical Research Council of Australia (NHMRC). The genotyping was performed at the Australian Genome Research Facility and the Finnish Genome Center. The GenomEUtwin project is supported by the European Commission under the programme “Quality of Life and Management of the Living Resources” of 5th Framework Programme (QLG2-CT-2002–01254). We acknowledge support from the Center of Excellence in Complex Disease Genetics of the Academy of Finland. We thank Stuart Macgregor, Rita Middelberg, Harry Beeby, and Dale Nyholt of the Queensland Institute of Medical Research (QIMR) for assistance in data preparation and analysis. We thank Leanne Wallace and Megan Campbell for assistance with sample preparation. We thank Dongliang Ge of Duke Institute for Genome Sciences & Policy for advice on using the WGAViewer software. We thank Nathan Subramaniam and Greg Anderson (QIMR) for helpful discussions. The authors declare that they have no competing financial interests.
Supplemental Data
Web Resources
The URL for data presented herein is as follows:
Online Mendelian Inheritance in Man (OMIM), http://www.ncbi.nlm.nih.gov/Omim/
References
- 1.Njajou O.T., Alizadeh B.Z., Aulchenko Y., Zillikens M.C., Pols H.A., Oostra B.A., Swinkels D.W., van Duijn C.M. Heritability of serum iron, ferritin and transferrin saturation in a genetically isolated population, the Erasmus Rucphen Family (ERF) Study. Hum. Hered. 2006;61:222–228. doi: 10.1159/000094777. [DOI] [PubMed] [Google Scholar]
- 2.Whitfield J.B., Cullen L.M., Jazwinska E.C., Powell L.W., Heath A.C., Zhu G., Duffy D.L., Martin N.G. Effects of HFE C282Y and H63D polymorphisms and polygenic background on iron stores in a large community sample of twins. Am. J. Hum. Genet. 2000;66:1246–1258. doi: 10.1086/302862. [DOI] [PMC free article] [PubMed] [Google Scholar]
- 3.Zhu G., Evans D.M., Duffy D.L., Montgomery G.W., Medland S.E., Gillespie N.A., Ewen K.R., Jewell M., Liew Y.W., Hayward N.K. A genome scan for eye color in 502 twin families: Most variation is due to a QTL on chromosome 15q. Twin Res. 2004;7:197–210. doi: 10.1375/136905204323016186. [DOI] [PubMed] [Google Scholar]
- 4.Wright M.J., Martin N.G. Brisbane adolescent twin study: Outline of study methods and research projects. Aust. J. Psychol. 2004;56:65–78. [Google Scholar]
- 5.Lange K., Weeks D., Boehnke M. Programs for pedigree analysis: MENDEL, FISHER, and dGENE. Genet. Epidemiol. 1988;5:471–472. doi: 10.1002/gepi.1370050611. [DOI] [PubMed] [Google Scholar]
- 6.Abecasis G.R., Cardon L.R., Cookson W.O. A general test of association for quantitative traits in nuclear families. Am. J. Hum. Genet. 2000;66:279–292. doi: 10.1086/302698. [DOI] [PMC free article] [PubMed] [Google Scholar]
- 7.Peltonen L. GenomEUtwin: A strategy to identify genetic influences on health and disease. Twin Res. 2003;6:354–360. doi: 10.1375/136905203770326358. [DOI] [PubMed] [Google Scholar]
- 8.Purcell S., Neale B., Todd-Brown K., Thomas L., Ferreira M.A., Bender D., Maller J., Sklar P., de Bakker P.I., Daly M.J. PLINK: A tool set for whole-genome association and population-based linkage analyses. Am. J. Hum. Genet. 2007;81:559–575. doi: 10.1086/519795. [DOI] [PMC free article] [PubMed] [Google Scholar]
- 9.Ge D., Zhang K., Need A.C., Martin O., Fellay J., Urban T.J., Telenti A., Goldstein D.B. WGAViewer: Software for genomic annotation of whole genome association studies. Genome Res. 2008;18:640–643. doi: 10.1101/gr.071571.107. [DOI] [PMC free article] [PubMed] [Google Scholar]
- 10.Finberg K.E., Heeney M.M., Campagna D.R., Aydinok Y., Pearson H.A., Hartman K.R., Mayo M.M., Samuel S.M., Strouse J.J., Markianos K. Mutations in TMPRSS6 cause iron-refractory iron deficiency anemia (IRIDA) Nat. Genet. 2008;40:569–571. doi: 10.1038/ng.130. [DOI] [PMC free article] [PubMed] [Google Scholar]
- 11.Du X., She E., Gelbart T., Truksa J., Lee P., Xia Y., Khovananth K., Mudd S., Mann N., Moresco E.M. The serine protease TMPRSS6 is required to sense iron deficiency. Science. 2008;320:1088–1092. doi: 10.1126/science.1157121. [DOI] [PMC free article] [PubMed] [Google Scholar]
- 12.Delanghe J., Verstraelen H., Pynaert I., Debels L., Taes Y., Verhasselt B., De Henauw S., Temmerman M. Human transferrin G277S mutation and iron deficiency in pregnancy. Br. J. Haematol. 2006;132:249–250. doi: 10.1111/j.1365-2141.2005.05871.x. [DOI] [PubMed] [Google Scholar]
- 13.Lee P.L., Halloran C., Beutler E. Polymorphisms in the transferrin 5′ flanking region associated with differences in total iron binding capacity: Possible implications in iron homeostasis. Blood Cells Mol. Dis. 2001;27:539–548. doi: 10.1006/bcmd.2001.0418. [DOI] [PubMed] [Google Scholar]
- 14.Lee P.L., Halloran C., Trevino R., Felitti V., Beutler E. Human transferrin G277S mutation: A risk factor for iron deficiency anaemia. Br. J. Haematol. 2001;115:329–333. doi: 10.1046/j.1365-2141.2001.03096.x. [DOI] [PubMed] [Google Scholar]
- 15.Lee P.L., Ho N.J., Olson R., Beutler E. The effect of transferrin polymorphisms on iron metabolism. Blood Cells Mol. Dis. 1999;25:374–379. doi: 10.1006/bcmd.1999.0267. [DOI] [PubMed] [Google Scholar]
- 16.Sarria B., Navas-Carretero S., Lopez-Parra A.M., Perez-Granados A.M., Arroyo-Pardo E., Roe M.A., Teucher B., Vaquero M.P., Fairweather-Tait S.J. The G277S transferrin mutation does not affect iron absorption in iron deficient women. Eur. J. Nutr. 2007;46:57–60. doi: 10.1007/s00394-006-0631-x. [DOI] [PubMed] [Google Scholar]
- 17.The International HapMap Consortium A haplotype map of the human genome. Nature. 2005;437:1299–1320. doi: 10.1038/nature04226. [DOI] [PMC free article] [PubMed] [Google Scholar]
- 18.Clayton D.G., Walker N.M., Smyth D.J., Pask R., Cooper J.D., Maier L.M., Smink L.J., Lam A.C., Ovington N.R., Stevens H.E. Population structure, differential bias and genomic control in a large-scale, case-control association study. Nat. Genet. 2005;37:1243–1246. doi: 10.1038/ng1653. [DOI] [PubMed] [Google Scholar]
- 19.Dixon A.L., Liang L., Moffatt M.F., Chen W., Heath S., Wong K.C., Taylor J., Burnett E., Gut I., Farrall M. A genome-wide association study of global gene expression. Nat. Genet. 2007;39:1202–1207. doi: 10.1038/ng2109. [DOI] [PubMed] [Google Scholar]
- 20.Miller J.D., Tajima S., Lauffer L., Walter P. The beta subunit of the signal recognition particle receptor is a transmembrane GTPase that anchors the alpha subunit, a peripheral membrane GTPase, to the endoplasmic reticulum membrane. J. Cell Biol. 1995;128:273–282. doi: 10.1083/jcb.128.3.273. [DOI] [PMC free article] [PubMed] [Google Scholar]
- 21.Whitfield J.B., Treloar S., Zhu G., Powell L.W., Martin N.G. Relative importance of female-specific and non-female-specific effects on variation in iron stores between women. Br. J. Haematol. 2003;120:860–866. doi: 10.1046/j.1365-2141.2003.04224.x. [DOI] [PubMed] [Google Scholar]
- 22.Visscher P.M. Sizing up human height variation. Nat. Genet. 2008;40:489–490. doi: 10.1038/ng0508-489. [DOI] [PubMed] [Google Scholar]
- 23.The Wellcome Tust Case Control Consortium Genome-wide association study of 14,000 cases of seven common diseases and 3,000 shared controls. Nature. 2007;447:661–678. doi: 10.1038/nature05911. [DOI] [PMC free article] [PubMed] [Google Scholar]
Associated Data
This section collects any data citations, data availability statements, or supplementary materials included in this article.