

Abstract
Observed linkage disequilibrium (LD) between genetic markers in different populations descended independently from a common ancestral population can be used to estimate their absolute time of divergence, because the correlation of LD between populations will be reduced each generation by an amount that, approximately, depends only on the recombination rate between markers. Although drift leads to divergence in allele frequencies, it has less effect on divergence in LD values. We derived the relationship between LD and time of divergence and verified it with coalescent simulations. We then used HapMap Phase II data to estimate time of divergence between human populations. Summed over large numbers of pairs of loci, we find a positive correlation of LD between African and non-African populations at levels of up to ∼0.3 cM. We estimate that the observed correlation of LD is consistent with an effective separation time of approximately 1,000 generations or ∼25,000 years before present. The most likely explanation for such relatively low separation times is the existence of substantial levels of migration between populations after the initial separation. Theory and results from coalescent simulations confirm that low levels of migration can lead to a downward bias in the estimate of separation time.
Main Text
High-density genetic marker data are increasingly used to infer population genetic and evolutionary parameters that have shaped today's human genome, including selection,1–4 effective population size,5,6 recombination rate,7 and population differentiation.8,9 Estimation of the classical measure FST shows substantial variation between human populations, for example 0.12 between the Yoruban from Nigeria and individuals from China and Japan.8,10 The existence of genetic differences between populations is important for gene-mapping studies, because spurious associations can arise from population stratification.
There is strong evidence that modern human populations originated in Africa and that multiple waves of migration out of Africa occurred. There is no consensus about the amount of genetic interchange and interbreeding (not replacement) between human populations after migration out of Africa.11–16 Can we use molecular marker data to estimate the timing of major population splits around the latest major out-of-Africa migration event? Traditionally, the divergence time between species is estimated from DNA sequence data from the divergence in sequences and the mutation rate. There are sophisticated statistical methods to estimate divergence time between (sub)species from sequence data in the presence of ancestral migration.17,18 These methods are not suitable to estimate divergence time between human populations because not enough time has elapsed for mutations to occur and diverge between groups. Differences in allele frequencies between and within populations can be used to estimate FST, but to estimate an absolute divergence time from these we need to know the effective population sizes of the populations after a split. Goldstein et al.19 proposed an absolute dating method based upon a stepwise mutation model of microsatellite markers, assuming that the mutation rate is known. Coalescent methods have been proposed and applied to estimate population parameters (e.g., 14,20), but estimates of divergence times and migration rate are scaled by effective population size, so absolute dating can be made only by making additional assumptions.
In this study we propose a method to estimate divergence time between populations. We exploit the result that linkage disequilibrium (LD) between markers between populations after a population split does, approximately, not depend on their effective population sizes. We show by coalescent simulations that the method based upon LD works well to estimate divergence times and apply our method to Phase II HapMap data.
We restrict our derivation and estimation procedure to pairs of biallelic loci. Although multiple locus and continuous length statistics exist,21 the better-developed theory for pairs of loci facilitates the analysis. For a pair of nonallelic loci, the level of LD can be measured either with the parameter D, or the correlation parameter r, which is equal to the normalized value of D.22 In an infinite population, recombination is expected to reduce the value of D by a fraction (1 − c) in each generation. Because gene frequencies remain unaltered in the infinite population case, the same relationship follows for the correlation, r′ = r(1 − c), where the prime indicates the value in the next generation. In the case of two populations that branch from an original population and diverge, the fall in r values will be independent in the two populations. If the correlations are r1 and r2 in the two populations, then after one generation of separation,
| (1) |
For two populations that exist at a point in time with correlations r1 and r2, respectively, then if the two diverged T generations previously, r1r2 = r2[0] (1 − c)2T, where r2[0] measures LD in the generation where the populations split. This equation can be rearranged to allow estimation of T, the number of generations since split of two populations. It can be rewritten with little loss of accuracy as r1r2 = r2[0]e−2cT. Taking logarithms and rearranging gives
| (2) |
The derivation of Equation (1) assumes an infinite population size. For finite populations with effective size N1 and N2 after the separation, and a correlation r0 in the ancestral population, E(r1) ≈ r0(1 − c)T and E(r2) ≈ r0(1 − c)T, if the total amount of inbreeding is relatively small after separation.22,23 Moreover, because drift is independent in the two populations in the absence of migration, E(r1r2) = E(r1)E(r2) ≈ r2[0](1 − c)2T, as before.23 Therefore, the expectation of the correlation in LD between the two populations is approximately the same as for infinite populations if the total amount of inbreeding after divergence is small, i.e., if T/Ni is small.
In addition to finite population size, the experimental sample size (n) has an effect on E(r2), but not on E(r1r2). Weir and Hill24 augmented E(r2) by 1/n, which is an approximation that is appropriate for small values of r2. However, for very small values of c, we expect large values of r2 and the adjustment of 1/n is too large (at the limit when E(r2) → 1 it is not influenced by experimental sample size at all). A more precise adjustment is to use the expectation of r2 from linear regression theory when the population value ρ2 is not equal to zero,
| (3) |
Given the observed r2 from data, the quadratic Equation (3) can be solved to give a less biased estimate of ρ2. For small values of r2 and a large value of n, the adjustment is very close to 1/n.
The quantities r1 and r2 can be directly observed and c can be estimated from pedigree or population data.7 The value of r2[0] can either be estimated from the data, assuming that LD within the current populations is representative of that in the ancestral population, or, assuming that the effective population size in the ancestral population is known, derived from the theoretical relationship between LD and effective population size.26
The measure of LD with r2 is per definition for the case in which alleles at both loci are still segregating in the population. If the population sizes since divergence are small relative to the time since separation, as measured by T/Ni, then there can be fixation of alleles at one or both loci. This means that the observed LD at both loci in both populations is from a selected set of loci with respect to all pairwise segregating loci in the ancestral population.22 The effect of this selection on the variance of disequilibrium is known.22,27 For the purpose of the current study, a question is whether this fixation can lead to a different expectation of E(r1r2) and therefore to a bias in the estimate of divergence time. There appears to be no simple explicit expression for E(ri|r0,c,T), but we can derive an expression for E(ri|r0) when c = 0 and T is very large, so that only two of the initial four haplotypes are still segregating. Littler28 has shown that in a finite population with frequencies p1, p2 …. pk, the chance that alleles i and j will be the last two segregating is approximately pipj[(1 − pi)−1 + (1 − pj)−1]. In the 2-locus example without recombination, the initial haplotype frequencies are pq + D, (1 − p)(1 − q) + D, p(1 − q) − D and q(1 − p) − D, respectively, with p and q the allele frequencies at the first and second locus. At the limit, r = 1 if the first two haplotypes are the remaining segregation haplotypes and r = −1 if the last two haplotypes are still segregation. The correlation is undefined for other combinations of haplotypes because there is fixation at one of the two loci. Because D = r0√[p(1 − p)q(1 − q)], we can derive an expression for E(r) given r0 with the probabilities for r = 1 and r = −1. This expression (not shown) depends on initial allele frequencies. For the special case of p = q = 1/2, the explicit solution is E(r) = r0(7 + r02)/(3 + 5r02). Hence E(r)/r0 = (7 + r02)/(3 + 5r02), which is always greater than 1. Hence, at least for this (arbitrary) choice of initial allele frequencies, the expected value of the correlation at the limit is always greater than what it was initially. This result was verified by a 2-locus simulation study without recombination and mutation (results not shown). For a general quantification of bias in the estimate of divergence time resulting from fixation of alleles, we use multilocus coalescent simulations.
Hudson's “ms” program29 was used to simulate a split population. Parameters were chosen to mimic the simulation of 1 Mb regions of the genome (θ = 400, ρ = 400, the scaled mutation and recombination rate, respectively, 106 sites, corresponding to, for example, Ne = 10,000, a mutation rate μ = 10−8, and a recombination rate of 1 cM/Mb). A total of n chromosomes were sampled, n/2 from each population.
The parameters that were varied were the sample size (n = 800 or n = 240 chromosomes in total, the latter to reflect the sample size of the HapMap populations), the time since splitting (0 generations, 100 generations, 1000 generations), and selection on minor allele frequency (MAF > 0.01, > 0.05, or > 0.10 in each subsample). The reason for selection on MAF is that more common alleles are likely to reflect alleles that were segregating in the ancestral population and because of the strong dependence of r2 values on MAF.30,31 For each set of parameters, 100 replicate samples were created and analyzed, corresponding to taking the average of more than 100 independent 1 Mb regions in the genome. Analyses were restricted to SNPs that were ≤0.1 cM apart. For each pair of “eligible” SNPs, the r2 in each subsample was calculated as well as the signed value of r1r2. SNPs were grouped in 20 bins with mean distances of ∼2.5 kb, ∼5 kb, …∼97.5 kb. For each bin, the mean value of r1r2 was computed as well as the average value of r2 in the two samples. LD quantities were summed over all 100 replicates, to mimic a genome-wide analysis by taking 100 independent regions of the genome. A correction was made for the mean r2 value for experimental sample size according to Equation (3). Divergence time (T) was estimated for each bin as
| (4) |
with c the (known) recombination fraction. The observed mean adjusted r2 in Equation (4) is used as a proxy for the unobserved r2[0] in Equation (2). For very small values of c (c → 0), both the numerator and denominator of Equation (4) tend to zero, so that unstable or indeterminate estimates are to be expected. Therefore, for both the simulations and analysis of real data, we avoided mean values for c < 0.00005.
We first investigated the case when two samples are from the same population (i.e., T = 0). In Figure 1 the estimate of T is given for the recombination rate range of 0.005 to 0.0975, as a function of MAF and experimental sample size. For very small values of c, the estimates are unstable and biased estimates are obtained. There is also a bias as a function of MAF, in that the estimates are too low when MAF > 0.01. This bias is particularly strong in combination with the smallest experimental sample size (n = 240, i.e., two samples of 120 chromosomes), where the estimate ranges from −250 at c = 0.005 to −50 at c = 0.0975. A negative bias implies that the mean adjusted value of r2 is smaller than the mean value of r1r2. With little restriction on MAF, the expected value of r2 is smaller than when only common segregating alleles are used30,31 and therefore the adjustment for experimental sample size becomes more important. Because Equation (2) is only an approximation, it may contribute to the observed downward bias. For a MAF threshold of 0.10 the estimates are unbiased, irrespective of experimental sample size (Figure 1). Therefore, for subsequent simulations, only results are given for MAF > 0.10.
Figure 1.
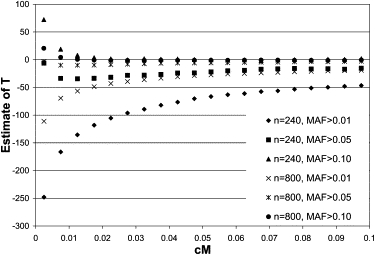
Estimate of Divergence Time from LD when Taking Two Samples from the Same Population
T = 0.
In Figure 2 the estimates of T are given for true divergence times of 0, 100, and 1000 generations. The estimates for T = 0 are unbiased (see also Figure 1), whereas estimates for T = 100 and 1000 are biased downwards by about 10% to 20%. A more stringent MAF threshold of 0.3 gave very similar results (not shown). The bias is likely because of the fixation of alleles, as described above. Estimates for a true divergence time of T = 3500, which may be appropriate for some human populations,32 are given in Supplemental Data available online and show a similar bias.
Figure 2.
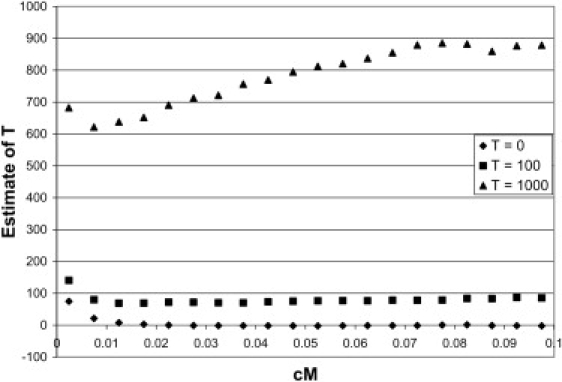
Estimate of Divergence Time when the Two Populations Split 0, 100, or 1000 Generations Ago
n = 240, MAF > 0.10.
From the simulation studies, it seems that the method works well when segregating loci are selected on MAF, but that a small downward bias of 10%–20% can be expected. We next applied the method to real data. We used autosomal HapMap phase II data10 to estimate the LD parameters and used estimates of recombination rates from the Oxstats map.7,33 To simplify the calculation of billions of pairwise r2 values, phased haplotype data were downloaded from the HapMap website and used to calculate D and r (which can be positive or negative) for each population. For each pair of populations, autosomal SNP pairs were eligible to be included in the analysis if their minor allele frequency (MAF) was above a predefined threshold and their recombination distance was <0.3 cM. We compared the LD between the African (YRI) and European (CEU) populations. We combined the Japanese and Chinese sample to create a single Asian (ASI) sample because of their similarity in LD.34 The haploid sample size (n) of the YRI and CEU samples was 120 (60 parents) and 180 for the ASI sample (2 × 45 unrelated individuals).
There is a strong effect of MAF on E(r2)30,31,34 and the mean r2 is a strong determinant of the estimate of divergence time. Therefore, care should be taken which mean r2 to use in Equation (5). We used the average r2 values from the YRI sample as a proxy for the unobservable r2[0]. For the YRI-ASI and YRI-CEU comparison, the MAF threshold was 0.10 for the YRI sample and 0.00 for the ASI (CEU) sample. The underlying assumption is that LD in the current YRI reflects that of the ancestral population, at least at the short recombination distances that we consider, and that the ASI and CEU populations are the derived populations. At short recombination distances, the estimate of T is not sensitive with respect to a changed effective population size in the ancestral population (Supplemental Data). It is important not to select the ASI and CEU samples on MAF, because the loci for which both populations have a large MAF are a biased sample with respect to the r2 in the ancestral population at the same recombination distance. Common alleles in the current ASI/CEU populations that are also common in the YRI population are likely to have r2[0] values that are larger than the current YRI r2 values if there has been substantial drift since the population split. Therefore, the mean of the observed YRI r2 values is too low under this ascertainment scheme and the estimate of divergence time biased downwards. This was confirmed with simulation studies (results not shown).
Figure 3 shows the estimate of divergence time of the YRI and CEU populations and the YRI and ASI populations, with r2[0] as the observed mean r2 values in the YRI sample (adjusted for experimental sample size) and a MAF threshold of 0.10 in the YRI sample only. The estimates of T for the YRI-CEU comparison are a few hundred generations smaller than those for the YRI-ASI comparison. This is consistent with recent migration out of Africa in the direction of Asia followed by subsequent migration out of Africa toward Europe.
Figure 3.
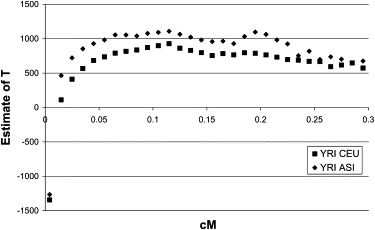
HapMap Results: YRI versus CEU and YRI versus ASI
At very low values of c (∼0.01 cM), the estimates of T are negative. Negative values imply that the adjusted mean value of r2 is smaller than the mean value of r1r2. Apart from the case of T = 0 and MAF > 0.01 (Figure 1), we did not observe such negative estimates in the previous simulations. However, if we invoke strong drift in one of the populations after a split, then we observe the same pattern in simulations. For example, if Ne in the ancestral and one of the subpopulations is 10,000 but only 1,000 in the other subpopulation, and there have been 1000 generation since divergence, the estimates of T are highly negative for c < 0.01 (results not shown).
The absolute values, taking into account a downward bias of 10%–20%, suggest a divergence time of 800–1200 generations, or ∼20,000 to 30,000 years before the present. This seems low and not consistent with models of recent human population migration and archaeological findings.11–14 Recent estimates from nuclear sequence data and mitochondrial data have suggested a timing of the exit out of Africa of ∼50k–60k years before present.14 The assumption of the estimation of T from LD is that there was a “clean” population split. What if there was migration subsequent to the population split? Migration will create a stronger correlation of LD (larger values of r1r2), thereby biasing the estimate of divergence time downwards. We investigated this further via simulations. A migration parameter was added to the simulations with ms.29 A value of 4Nem of 4 and 40 was used, with m the fraction of each subpopulation that is made up of new migrants each generation. For Ne = 10,000, this corresponds to 0.01% and 0.1%, respectively. The results for n = 240, T = 1000, and MAF > 0.10 are in Figure 4. Clearly, as expected, the estimates of T are severely biased downwards for these migration rates. For the migration rate of 0.1% per generation, the estimates are biased downwards by a factor of 4 to 5. Theoretical derivations (J.A.S., unpublished data) also show a bias in the presence of migration.
Figure 4.
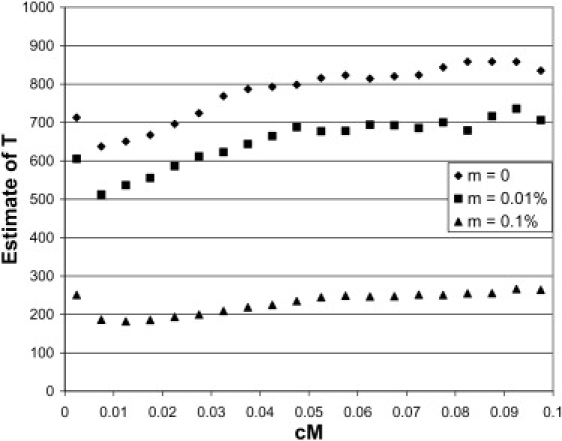
Estimate of Divergence Time when the Two Populations Split 1000 Generations Ago and Had a Subsequent Constant Migration Rate of 0%, 0.01%, or 0.1% per Generation
n = 240, MAF > 0.10.
We have proposed a method that uses observed decay in linkage disequilibrium across populations to estimate their time of divergence from a common ancestral population. We have shown by simulations that the method works well if common SNPs are used, although there is a downward bias of 10%–20%. We applied the method to millions of SNP pairs from HapMap samples and estimated time of divergence for loci that are <0.3 cM apart. In livestock genetics, LD decay between populations was investigated in breeds of cattle23 and lines of chickens,35 to answer the question whether, for association studies, the same genetic markers can be used across populations.
The simulation studies show a downward bias, which implies that either the observed mean r2 is too small or that the mean r1r2 is too large. The quantity that we do not directly observe but which is needed to estimate T is the r2[0], the LD in the ancestral population. As an estimate for r2[0], we have used the observed r2 in the samples at the same recombination rates. For populations in recombination-drift-mutation balance, this appears to be the correct value. A third assumption of the prediction equation is that E(r1r2|r0) is only a function of recombination rate. As we have shown above, this is not the case for very small values of c and a lot of drift (small population size since separation and/or a long time since separation). A value of T/Ne = 1 results in an estimate of T that is approximately 50% too low (Supplemental Data), even though the effect of divergence on interpopulation LD remains stronger than drift (Supplemental Data). Therefore, the most likely explanation of the observed bias is fixation. Because we used “backward” (coalescent) sampling, we did not observe the r0 in the ancestral population to verify this explanation. Further evidence for fixation is suggested by the estimate of the CEU-YRI and ASI-YRI divergence times for small values of c (Figure 3). It is generally accepted that migration out of Africa was accompanied by one or more population bottlenecks. At times of bottlenecking, some loci may have gone to fixation and the absolute value of r tends to increase among unfixed populations. The non-African HapMap samples have considerably less nucleotide variation than has the YRI sample,8 consistent with substantial fixation since divergence.
The estimated separation times are substantially less than previous estimates.36 It is obviously important to examine all assumptions and all aspects of the calculations that lead to this result very carefully. The Out-of-Africa hypothesis postulates that migrant populations that gave rise to the current non-African populations went through a bottleneck over a number of generations. One result of such bottlenecks is a decrease of variability, and a second result is an increase in LD.6 The only ascertainment that we placed on the non-African population was that eligible pairs of loci (selected on MAF and distance in the YRI sample) had to be segregating. We did not use the observed r2 in the non-African population. Therefore, drift subsequent to the population split has an effect on our estimate of T only if it influences the mean value of r1r2. We investigated this in simulations by reducing the size of one of the populations after a split (from 10,000 to 1,000), but selecting on MAF in the larger (“ancestral”) population only. Drift in the smaller population biased the estimate of divergence time downwards, in particular for small values of c, as predicted by the theory of bias because of fixation of alleles.
A strong requirement in the application of Equation (4) is for an accurate measure of recombination. The T estimates of Figure 3 use the Oxstats recombination estimates, which in turn are substantially based on disequilibrium estimates.33 There is a possible bias in using values calculated in this way. However, when we used a separate estimate of c from a meiotic map that does not account for fine-scale recombination rate,6 we obtained much lower values of T. This result strongly suggests that the Oxstats estimates are giving a more accurate estimate of recombination than did the meiotic estimates. If the location of recombination cold and hotspots are different in the subpopulations, then this would introduce a bias in the estimate of T.
Schaffner et al.32 used a complex demographic model to calibrate coalescent simulation results to the observed pattern of SNP frequency patterns and LD in sampled described previously.37 The autosomal data set was based upon 3738 markers in 54 regions of the genome. Their model contained many parameters (21, 7 of which were fixed) and the authors do not claim accuracy of their proposed historical and recombination model. Nevertheless, their best-fitted model resembled the observed data well. In their best-fitting model, the timing of the migration out of Africa was fixed to 3500 generations, and a Africa-Europe and Africa-Asia migration rate of 0.0032% and 0.0008% per chromosome was estimated. Setting the migration rate to 0 did not change the fit of the model substantially.32 The model we have used in the current study is much simpler in that it has fewer parameters and makes fewer assumptions. Our inference is based upon much more data than the Schaffner et al.,32 so that our estimates of divergence time are likely to be more precise, if biased. In the absence of any other explanations, the most likely reason of the low estimates of divergence time is migration. A migration rate of 1 in 10,000 individuals per generation results in a downward bias of nearly 50% (Figure 4). There is empirical evidence from genetic data of relatively recent migration from African into Europe,38 but to our knowledge no such admixture has been detected in the HapMap CEU sample.
In conclusion, we have proposed and evaluated a simple method to estimate divergence time from population data on linkage disequilibrium and have applied it to genome-wide SNP data in three human populations. The estimate of their divergence time is about 1000 generation, which may be biased downward because of migration.
Acknowledgments
This study was supported by Australian Research Council grant DP0770096. We thank Bill Hill, Warren Ewens, and Mike Goddard for helpful comments and discussions and the referees for their suggestions. A.F.M. and P.M.V. are supported by the Australian National Health and Medical Research Council.
Supplemental Data
Web Resources
The URLs for data presented herein are as follows:
HapMap, http://www.hapmap.org/
Hudson's ms program, http://home.uchicago.edu/∼rhudson1/source/mksamples.html
References
- 1.Sabeti P.C., Reich D.E., Higgins J.M., Levine H.Z., Richter D.J., Schaffner S.F., Gabriel S.B., Platko J.V., Patterson N.J., McDonald G.J. Detecting recent positive selection in the human genome from haplotype structure. Nature. 2002;419:832–837. doi: 10.1038/nature01140. [DOI] [PubMed] [Google Scholar]
- 2.Sabeti P.C., Schaffner S.F., Fry B., Lohmueller J., Varilly P., Shamovsky O., Palma A., Mikkelsen T.S., Altshuler D., Lander E.S. Positive natural selection in the human lineage. Science. 2006;312:1614–1620. doi: 10.1126/science.1124309. [DOI] [PubMed] [Google Scholar]
- 3.Sabeti P.C., Varilly P., Fry B., Lohmueller J., Hostetter E., Cotsapas C., Xie X., Byrne E.H., McCarroll S.A., Gaudet R. Genome-wide detection and characterization of positive selection in human populations. Nature. 2007;449:913–918. doi: 10.1038/nature06250. [DOI] [PMC free article] [PubMed] [Google Scholar]
- 4.Voight B.F., Kudaravalli S., Wen X., Pritchard J.K. A map of recent positive selection in the human genome. PLoS Biol. 2006;4:e72. doi: 10.1371/journal.pbio.0040072. [DOI] [PMC free article] [PubMed] [Google Scholar]
- 5.Conrad D.F., Jakobsson M., Coop G., Wen X., Wall J.D., Rosenberg N.A., Pritchard J.K. A worldwide survey of haplotype variation and linkage disequilibrium in the human genome. Nat. Genet. 2006;38:1251–1260. doi: 10.1038/ng1911. [DOI] [PubMed] [Google Scholar]
- 6.Tenesa A., Navarro P., Hayes B.J., Duffy D.L., Clarke G.M., Goddard M.E., Visscher P.M. Recent human effective population size estimated from linkage disequilibrium. Genome Res. 2007;17:520–526. doi: 10.1101/gr.6023607. [DOI] [PMC free article] [PubMed] [Google Scholar]
- 7.McVean G.A., Myers S.R., Hunt S., Deloukas P., Bentley D.R., Donnelly P. The fine-scale structure of recombination rate variation in the human genome. Science. 2004;304:581–584. doi: 10.1126/science.1092500. [DOI] [PubMed] [Google Scholar]
- 8.Altshuler D., Brooks L.D., Chakravarti A., Collins F.S., Daly M.J., Donnelly P. A haplotype map of the human genome. Nature. 2005;437:1299–1320. doi: 10.1038/nature04226. [DOI] [PMC free article] [PubMed] [Google Scholar]
- 9.Crawford D.C., Carlson C.S., Rieder M.J., Carrington D.P., Yi Q., Smith J.D., Eberle M.A., Kruglyak L., Nickerson D.A. Haplotype diversity across 100 candidate genes for inflammation, lipid metabolism, and blood pressure regulation in two populations. Am. J. Hum. Genet. 2004;74:610–622. doi: 10.1086/382227. [DOI] [PMC free article] [PubMed] [Google Scholar]
- 10.Frazer K.A., Ballinger D.G., Cox D.R., Hinds D.A., Stuve L.L., Gibbs R.A., Belmont J.W., Boudreau A., Hardenbol P., Leal S.M. A second generation human haplotype map of over 3.1 million SNPs. Nature. 2007;449:851–861. doi: 10.1038/nature06258. [DOI] [PMC free article] [PubMed] [Google Scholar]
- 11.Templeton A. Out of Africa again and again. Nature. 2002;416:45–51. doi: 10.1038/416045a. [DOI] [PubMed] [Google Scholar]
- 12.Templeton A.R. Haplotype trees and modern human origins. Am. J. Phys. Anthropol. 2005;(Suppl 41):33–59. doi: 10.1002/ajpa.20351. [DOI] [PubMed] [Google Scholar]
- 13.Templeton A.R. Genetics and recent human evolution. Evolution Int. J. Org. Evolution. 2007;61:1507–1519. doi: 10.1111/j.1558-5646.2007.00164.x. [DOI] [PubMed] [Google Scholar]
- 14.Fagundes N.J., Ray N., Beaumont M., Neuenschwander S., Salzano F.M., Bonatto S.L., Excoffier L. Statistical evaluation of alternative models of human evolution. Proc. Natl. Acad. Sci. USA. 2007;104:17614–17619. doi: 10.1073/pnas.0708280104. [DOI] [PMC free article] [PubMed] [Google Scholar]
- 15.Garrigan D., Hammer M.F. Ancient lineages in the genome: A response to Fagundes et al. Proc. Natl. Acad. Sci. USA. 2008;105:E3. doi: 10.1073/pnas.0710521105. [DOI] [PMC free article] [PubMed] [Google Scholar]
- 16.Garrigan D., Hammer M.F. Reconstructing human origins in the genomic era. Nat. Rev. Genet. 2006;7:669–680. doi: 10.1038/nrg1941. [DOI] [PubMed] [Google Scholar]
- 17.Hey J., Nielsen R. Integration within the Felsenstein equation for improved Markov chain Monte Carlo methods in population genetics. Proc. Natl. Acad. Sci. USA. 2007;104:2785–2790. doi: 10.1073/pnas.0611164104. [DOI] [PMC free article] [PubMed] [Google Scholar]
- 18.Becquet C., Przeworski M. A new approach to estimate parameters of speciation models with application to apes. Genome Res. 2007;17:1505–1519. doi: 10.1101/gr.6409707. [DOI] [PMC free article] [PubMed] [Google Scholar]
- 19.Goldstein D.B., Ruiz Linares A., Cavalli-Sforza L.L., Feldman M.W. Genetic absolute dating based on microsatellites and the origin of modern humans. Proc. Natl. Acad. Sci. USA. 1995;92:6723–6727. doi: 10.1073/pnas.92.15.6723. [DOI] [PMC free article] [PubMed] [Google Scholar]
- 20.Nielsen R., Slatkin M. Likelihood analysis of ongoing gene flow and historical association. Evolution Int. J. Org. Evolution. 2000;54:44–50. doi: 10.1111/j.0014-3820.2000.tb00006.x. [DOI] [PubMed] [Google Scholar]
- 21.Hayes B.J., Visscher P.M., McPartlan H.C., Goddard M.E. Novel multilocus measure of linkage disequilibrium to estimate past effective population size. Genome Res. 2003;13:635–643. doi: 10.1101/gr.387103. [DOI] [PMC free article] [PubMed] [Google Scholar]
- 22.Hill W.G., Robertson A. Linkage disequilibrium in finite populations. Theor. Appl. Genet. 1968;38:226–231. doi: 10.1007/BF01245622. [DOI] [PubMed] [Google Scholar]
- 23.de Roos A.P., Hayes B.J., Spelman R.J., Goddard M.E. Linkage disequilibrium and persistence of phase in Holstein-Friesian, Jersey and Angus cattle. Genetics. 2008;179:1503–1512. doi: 10.1534/genetics.107.084301. [DOI] [PMC free article] [PubMed] [Google Scholar]
- 24.Weir B.S., Hill W.G. Effect of mating structure on variation in linkage disequilibrium. Genetics. 1980;95:477–488. doi: 10.1093/genetics/95.2.477. [DOI] [PMC free article] [PubMed] [Google Scholar]
- 25.Hall P. Multiple and partial correlation coefficients in the case of an n-fold variate system. Biometrika. 1927;19:100–109. [Google Scholar]
- 26.Sved J.A. Linkage disequilibrium and homozygosity of chromosome segments in finite populations. Theor. Popul. Biol. 1971;2:125–141. doi: 10.1016/0040-5809(71)90011-6. [DOI] [PubMed] [Google Scholar]
- 27.Hill W.G. Correlation of gene frequencies between neutral linked genes in finite populations. Theor. Popul. Biol. 1977;11:219–248. doi: 10.1016/0040-5809(77)90026-0. [DOI] [PubMed] [Google Scholar]
- 28.Littler R.A. Linkage disequilibrium in two-locus, finite, random mating models without selection or mutation. Theor. Popul. Biol. 1973;4:259–275. doi: 10.1016/0040-5809(73)90011-7. [DOI] [PubMed] [Google Scholar]
- 29.Hudson R.R. Generating samples under a Wright-Fisher neutral model of genetic variation. Bioinformatics. 2002;18:337–338. doi: 10.1093/bioinformatics/18.2.337. [DOI] [PubMed] [Google Scholar]
- 30.Hudson R.R. The sampling distribution of linkage disequilibrium under an infinite allele model without selection. Genetics. 1985;109:611–631. doi: 10.1093/genetics/109.3.611. [DOI] [PMC free article] [PubMed] [Google Scholar]
- 31.Uimari P., Kontkanen O., Visscher P.M., Pirskanen M., Fuentes R., Salonen J.T. Genome-wide linkage disequilibrium from 100,000 SNPs in the East Finland founder population. Twin Res. Hum. Genet. 2005;8:185–197. doi: 10.1375/1832427054253086. [DOI] [PubMed] [Google Scholar]
- 32.Schaffner S.F., Foo C., Gabriel S., Reich D., Daly M.J., Altshuler D. Calibrating a coalescent simulation of human genome sequence variation. Genome Res. 2005;15:1576–1583. doi: 10.1101/gr.3709305. [DOI] [PMC free article] [PubMed] [Google Scholar]
- 33.Myers S., Bottolo L., Freeman C., McVean G., Donnelly P. A fine-scale map of recombination rates and hotspots across the human genome. Science. 2005;310:321–324. doi: 10.1126/science.1117196. [DOI] [PubMed] [Google Scholar]
- 34.Consortium T.I.H. A haplotype map of the human genome. Nature. 2005;437:1299–1320. doi: 10.1038/nature04226. [DOI] [PMC free article] [PubMed] [Google Scholar]
- 35.Andreescu C., Avendano S., Brown S.R., Hassen A., Lamont S.J., Dekkers J.C. Linkage disequilibrium in related breeding lines of chickens. Genetics. 2007;177:2161–2169. doi: 10.1534/genetics.107.082206. [DOI] [PMC free article] [PubMed] [Google Scholar]
- 36.Cavalli-Sforza L.L., Feldman M.W. The application of molecular genetic approaches to the study of human evolution. Nat. Genet. 2003;33(Suppl):266–275. doi: 10.1038/ng1113. [DOI] [PubMed] [Google Scholar]
- 37.Gabriel S.B., Schaffner S.F., Nguyen H., Moore J.M., Roy J., Blumenstiel B., Higgins J., DeFelice M., Lochner A., Faggart M. The structure of haplotype blocks in the human genome. Science. 2002;296:2225–2229. doi: 10.1126/science.1069424. [DOI] [PubMed] [Google Scholar]
- 38.King T.E., Parkin E.J., Swinfield G., Cruciani F., Scozzari R., Rosa A., Lim S.K., Xue Y., Tyler-Smith C., Jobling M.A. Africans in Yorkshire? The deepest-rooting clade of the Y phylogeny within an English genealogy. Eur. J. Hum. Genet. 2007;15:288–293. doi: 10.1038/sj.ejhg.5201771. [DOI] [PMC free article] [PubMed] [Google Scholar]
Associated Data
This section collects any data citations, data availability statements, or supplementary materials included in this article.