

Abstract
OBJECTIVES
To evaluate the relationship between mild anemia and executive function in community-dwelling older women.
DESIGN
Cross-sectional.
SETTING
Community-based.
PARTICIPANTS
High-functioning subjects participating in the baseline assessment of the Women’s Health and Aging Study (WHAS) II, Baltimore, Maryland, 1994 to 1996. WHAS II eligibility criteria included aged 70 to 80, a Mini-Mental State Examination score of 24 or greater, and absence of advanced disability (difficulty in no more than 1 domain of physical function). Included in this study were 364 subjects with a hemoglobin concentration 10 g/dL or greater and known executive function status.
MEASUREMENTS
Trail Making Test (TMT) Parts B and A. Tertiles of time to complete each test were used to define best (bottom), intermediate, and worst (top) performance. Tertiles of the difference TMT-B minus TMT-A were calculated. Anemia defined as hemoglobin concentration less than 12 g/dL.
RESULTS
The percentage of subjects in the worst TMT-B, TMT-A, and TMT-B minus TMT-A performance tertile was highest for those with anemia. Prevalent anemia substantially increased the likelihood of performing worst (as opposed to best) on the TMT-B (odds ratio (OR) = 5.2, 95% confidence interval (CI) = 1.3–20.5), TMT-A (OR = 4.8, 95% CI = 1.5–15.6), and TMT-B minus TMT-A (OR = 4.2, 95% CI = 1.0–17.2), even after controlling for age, education, race, prevalent diseases, and relevant physiological and functional parameters.
CONCLUSION
This study provides preliminary evidence in support of the hypothesis that mild anemia might be an independent risk factor for executive function impairment in community-dwelling older adults. Whether such an association is causal or noncausal remains to be determined.
Keywords: anemia, elderly, executive function, Trail Making Test
Executive function impairment occurs commonly in older adults1 and is a risk factor for major adverse functional outcomes in community-dwelling older adults, including disability performing instrumental activities of daily living (IADLs),2,3 diminished performance in objective performance-based tests of IADLs4 and mobility function,5 and decreased driving competence.6
Executive function reflects a set of higher-order cognitive abilities involved with the planning, initiation, sequencing, and monitoring of goal-directed activities, as well as problem solving in response to environmental feedback; thus, it is plausible that executive function impairment causally contributes to decline in physical function in older adults. A recent study of high-functioning community-dwelling older women showed that impairment in executive function but not in three other cognitive subdomains— verbal memory, spatial learning, and general memory—was associated with early IADL decline.4 Current literature suggests that executive function impairment might occur early in the disablement process experienced by older adults and might be important in causally mediating the onset and progression of functional decline. Thus, the identification of potentially modifiable risk factors for executive function impairment in relatively healthy community-dwelling older adults could ultimately contribute to the development of novel preventive opportunities aimed at the maintenance of autonomy in older ages.
Recent studies have suggested that greater aerobic fitness produced by aerobic exercise may be protective against executive function impairment in older adults.7,8 Anemia, a common9 and potentially modifiable physiological impairment in older adults, may adversely affect physical conditioning and aerobic fitness.10 Thus, it is possible that anemia could negatively affect executive function in community-dwelling older adults. To the authors’ knowledge, this hypothesis has not been assessed.
The objective of this study was to investigate, in a population-based sample of nondemented community-dwelling older women without advanced physical disability, the a priori hypothesis that mild anemia would be independently associated with executive function impairment, as measured by performance on the Trail Making Tests11 Part B (TMT-B) and Part A (TMT-A), and the difference between TMT-B and TMT-A (TMT-B – TMT-A).
METHODS
Study Population
The Women’s Health and Aging Study (WHAS) II was designed to evaluate the epidemiology of disability onset in 436 high-functioning, community-dwelling women aged 70 to 80.12 WHAS II eligibility criteria included a Mini-Mental State Examination (MMSE)13 score of 24 or higher, and self-reported difficulty in no more than one domain of physical function. Baseline assessments were performed at the Johns Hopkins General Clinical Research Center, Baltimore, Maryland, from 1994 to 1996. The Johns Hopkins Medical Institutions institutional review board approved research protocols. Informed consent was obtained from all participants.
Measures of Executive Function
TMT-B performance was selected a priori as the primary outcome. TMT-B reflects mental flexibility and psychomotor processing speed and is a well-established and widely used indicator of executive function. In prior analysis of the WHAS II cohort, of all neuropsychological tests, performance on the TMT-B explained the greatest proportion of the variance in objective performance-based measures of IADL function.4 A recent study consistently identified TMT-B as one of the two tests of executive function most strongly related to physical functioning in older adults,14 along with the Wisconsin Card Sorting Test (not done in WHAS II). Additionally, in a pilot clinical trial in anemic patients, TMT-B performance was shown to be sensitive in detecting cognitive improvements that occurred in connection with an increment in hematocrit.15
The administration of the TMT-B in WHAS II has been described elsewhere.4 The time to complete the test was recorded; those who could not complete it because of obvious cognitive impairment (n = 5) were assigned the maximum time allowed for test completion (600 seconds). Those who did not take test because of sensory impairment were excluded (n = 3). Fifteen subjects had missing TMT-B because of reasons other than cognitive or sensory impairments. These subjects did not differ from those with a valid TMT-B measure in a meaningful or statistically significant way with regard to age, education, or MMSE. For these 15 subjects, TMT-B values were imputed as follows. For those with a MMSE score of 27 or greater (n = 11), the median TMT-B score of WHAS II participants with a MMSE score of 27 or greater was imputed; for those with a MMSE score less than 27 (n = 4), the median TMT-B score of WHAS II participants with a MMSE score less than 27 was imputed. TMT-B performance categories created based on tertiles were 93 seconds or less (best), greater than 93 but 132 seconds or less (intermediate), and greater than 132 seconds (worst).
For supporting validity, the relationship between hemoglobin concentration (Hb) and two other measures was assessed: one derived from performance on the TMT-A, the other calculated as the difference between TMT-B and TMT-A (TMT-B – TMT-A). TMT-A measures motor speed and visuospatial ability and is a less-demanding test of executive function than TMT-B. TMT-B – TMT-A has been increasingly used5 as a theoretically “purer” measure of executive function measure than TMT-B in the sense that the confounding effects of motor agility on executive function assessment would “less influence” the former.16 TMT-A and TMT-B – TMT-A categories were created based on tertiles, with the bottom and top tertiles representing, respectively, best and worst performance.
Hemoglobin Assessment
Hb was measured in blood samples collected using venipuncture in sterile vacuum tubes with ethylenediaminetetraacetic acid using the traditional cyanmethemoglobin method. Baseline Hb was available for 370 (84.9%) subjects. Given that the focus of this analysis was to study the effect of mild to moderate Hb reduction on executive function, as well as to minimize the effect of outliers on the results, subjects with Hb of less than 10 g/dL were excluded (n = 3). Anemia was defined according to the World Health Organization (WHO) criterion (Hb<12.0 g/dL).
Additional Independent Variables
Data were available on age, race, education, living arrangement, smoking status, and drinking habit. History of hypertension and clinical stroke and adjudicated diagnoses of “definite” cardiovascular disease (CVD, i.e., angina pectoris, myocardial infarction, congestive heart failure, or peripheral vascular disease), diabetes mellitus, and prevalent cancer were ascertained. Additional comorbidity burden indicators included depressive symptoms, assessed using the 30-item Geriatric Depression Scale;17 creatinine clearance (mL/min per 1.73 m2) calculated according to the Cockcroft-Gault equation;18 forced expiratory volume in the first second; thyroid stimulating hormone (TSH) levels (tertiles: ≤1.2, 1.2–2.1, ≥2.1 mIU/mL); total cholesterol levels (mg/dL), interleukin (IL)-6 (≥3.0 vs <3.0 pg/mL); body mass index (BMI, ≤21.0, 21.1–25.0, 25.1–30.0, >30 kg/m2); self-perceived health status; self-reported difficulty with IADLs (shopping for personal items, preparing meals, using the telephone, managing own money, taking own medication); self-reported mobility difficulty (walking half a mile or climbing up 10 steps); and usual walking speed based on a 4-m course (m/s). Unless indicated here, variable units are indicated in Table 1.
Table 1.
Characteristics of Study Participants Stratified by Trail Making Test (TMT) Part B Performance Tertiles
| Tertiles of TMT-B Performance |
|||||
|---|---|---|---|---|---|
| Characteristic | All n = 364 | Best n = 122 | Intermediate n = 121 | Worst n = 121 | P-value |
| Demographics and health habits | |||||
| Age, mean ± SD | 73.9 ± 2.8 | 73.1 ± 2.4 | 74.1 ± 2.8 | 74.5 ± 3.0 | <.0001 |
| Race, n (%) | |||||
| White | 302 (83.0) | 113 (92.6) | 101 (83.5) | 88 (72.7) | <.001 |
| Black | 62 (17.0) | 9 (7.4) | 20 (16.5) | 33 (27.3) | |
| Education ≥12 years, n (%) | 267 (73.6) | 110 (90.2) | 84 (69.4) | 73 (60.8) | <.001 |
| Living alone, n (%) | 194 (53.4) | 67 (54.9) | 68 (56.2) | 59 (49.2) | .51 |
| Smoking status, n (%) | |||||
| Never | 195 (53.7) | 57 (46.7) | 68 (56.2) | 70 (58.3) | .327 |
| Former | 128 (35.3) | 52 (42.6) | 39 (32.2) | 37 (30.8) | |
| Current | 40 (11.0) | 13 (10.7) | 14 (11.6) | 13 (10.8) | |
| Cognitive tests | |||||
| Mini-Mental State Examination score ≥27, n (%) | 294 (82.6) | 117 (98.3) | 103 (87.3) | 74 (62.2) | <.001 |
| TMT, seconds, median (25th–75th percentile) | |||||
| B | 107 (83–150) | 77 (65–85) | 108 (101–119) | 181 (152–240) | <.001 |
| A | 42 (34–52) | 33 (29–39) | 41 (37–49) | 54 (44–70) | <.001 |
| B– A | 64 (47–104) | 41 (30–50) | 64 (59–75) | 128 (105–175) | <.001 |
| Disease and physiological parameters | |||||
| Hemoglobin concentration, g/dL, mean ± SD | 13.4 ± 1.0 | 13.6 ± 0.90 | 13.3 ± 0.95 | 13.2 ± 1.2 | .002 |
| Anemia (hemoglobin concentration < 12 g/dL), n (%) | 30 (8.2) | 4 (3.3) | 8 (6.6) | 18 (14.9) | .003 |
| Hypertension, n (%) | 187 (51.5) | 54 (44.3) | 65 (53.7) | 68 (56.7) | .14 |
| History of stroke, n (%) | 18 (5.0) | 7 (5.7) | 5 (4.1) | 6 (5.0) | .85 |
| Cardiovascular disease, n (%)* | 62 (17.0) | 19 (15.6) | 18 (14.9) | 25 (20.3) | .43 |
| Diabetes mellitus, n (%) | 27 (7.4) | 4 (3.3) | 10 (8.3) | 13 (10.7) | .08 |
| Cancer, n (%) | 22 (6.0) | 10 (8.2) | 7 (5.8) | 5 (4.1) | .41 |
| Depression (30-item Geriatric Depression Scale score22 ≥11), n (%) | 28 (7.7) | 3 (2.5) | 13 (10.7) | 12 (10.0) | .03 |
| Creatinine clearance, mL/min/1.73 m2, n (%)†,‡ | |||||
| <30 | 3 (1.0) | 0 (0) | 2 (1.9) | 1 (1.0) | .69 |
| 30–60 | 152 (48.3) | 51 (47.2) | 50 (48.5) | 51 (49.0) | |
| >60 | 160 (50.8) | 57 (52.8) | 51 (49.5) | 52 (50.0) | |
| Forced expiratory volume in 1 second, L, n (%) | |||||
| ≥1.8 | 144 (39.6) | 63 (51.6) | 48 (39.7) | 33 (27.3) | .009 |
| 1.7–1.5 | 74 (20.3) | 22 (18.0) | 27 (22.3) | 25 (20.7) | |
| ≤1.4 | 71 (19.5) | 18 (14.8) | 23 (19.0) | 30 (24.8) | |
| Missing | 75 (20.6) | 19 (15.6) | 23 (19.0) | 33 (27.3) | |
| Thyroid-stimulating hormone <0.4 or ≥4.2 mIU/L, n (%) | 48 (13.3) | 15 (12.3) | 14 (11.9) | 15.8 (19) | .61 |
| Interleukin-6 ≥3.0 pg/mL, n (%) | 169 (48.2) | 50 (42.0) | 60 (52.6) | 50.0 (59) | .24 |
| Self-rated health status excellent or very good | 184 (50.7) | 84 (68.9) | 62 (51.2) | 38 (31.7) | <.001 |
| Instrumental activity of daily living difficulty, n (%) | 24 (6.7) | 4 (3.3) | 10 (8.4) | 10 (8.3) | .19 |
| Walking speed, m/sec, median (25th–75th percentile)‡ | 0.71 (0.59–0.83) | 0.77 (0.67–0.91) | 0.67 (0.59–0.83) | 0.67 (0.55–0.77) | <.001 |
Note: Percentages were calculated as the number of subjects with that characteristic of all subjects in each TMT-B performance tertile.
Definite diagnosis of angina pectoris, myocardial infarction, congestive heart failure, or peripheral vascular disease according to standardized algorithms.21
Calculated according to the Cockcroft-Gault equation.23
Based on a 4-m straight course using usual pace.
SD = standard deviation.
Statistical Analysis
This analysis did not include participants who had missing Hb (n = 66), Hb less than 10.0 g/dL (n = 3), or missing TMT-B (n = 3); the final sample size was 364. Means and medians were compared across tertiles of TMT-B performance using nonparametric tests; for categorical variables, chi-square tests were used. Polytomous logistic regression was used to model the cross-sectional relationship between TMT-B tertiles and Hb, while adjusting for major confounders, such as demographics, diseases, and other relevant physiological and functional indicators of comorbidity burden. The best, rather than the worst, tertile was chosen as the reference group. This was done as an attempt to facilitate interpretation of results, which are thus expressed as the likelihood of being in the worst or the intermediate performance group, as opposed to in the best tertile, as a function of anemia.
The following covariates were entered into the fully adjusted model based on a priori decisions: age, race, education, MMSE, CVD, diabetes mellitus, hypertension, depression, calculated creatinine clearance, TSH, IL-6, walking speed, and mobility difficulty. Although adjustment for the last two variables could be considered over-adjustment, it was decided to do so as an attempt to minimize the potential confounding effect of prevalent functional limitation and disability on executive function at baseline. Additionally, drinking habit, smoking status, BMI, forced expiratory volume in the first second, and total cholesterol were also considered as potential confounders. Each of these latter variables were entered one at a time in a model containing an indicator for anemia plus all the covariates that were selected a priori for inclusion one at a time. If they did not reach statistical significance (likelihood ratio test, P<.05), they were removed. Using this approach, only smoking was additionally included in the final fully adjusted model. Stata 8.0 (Stata Corp., College Station, TX) was used for analysis.
RESULTS
Participants were predominantly white and highly educated and had a mean age of 73.9 ± 2.8 (Table 1). The majority of participants had 12 or more years of formal education, lived alone, and had never smoked. More than 80% of participants had a MMSE score of 27 or greater. The vast majority of participants had Hb in the normal range according to the WHO criterion, with only 8.6% (n = 30) with Hb less than 12.0 g/dL. Participants had good physical functioning, with more than half rating their health status as excellent or very good and less than 7% reporting difficulty performing IADLs.
Better TMT-B performance was positively associated with younger age, white race, more years of education, higher Hb, fewer depressive symptoms, better pulmonary function, better self-perceived health status, and faster 1-m usual walking speed (Table 1). No statistically significant associations (P > .05) were found in bivariate analysis between TMT-B performance and the following variables: smoking status, hypertension, stroke, diabetes mellitus, cancer, calculated creatinine clearance, BMI, total cholesterol, TSH, IL-6, and drinking habit. Approximately 10% of WHAS II subjects were not included in this analysis because of missing TMT-B or Hb. Those not included were more likely to be African American and have less education than those in the analytic sample but did not vary according to the other characteristics presented in Table 1.
Figure 1 displays the observed relationship between Hb and TMT-B, TMT-B – TMT-A, and TMT-A scores. The percentage of subjects in the best TMT-B performance tertile was lowest for levels of Hb within the range of 10.0 to 11.9 g/dL, intermediate for Hb within the range of 12.0 to 12.9 g/dL, and highest for the categories including Hb concentrations of 13 g/dL or greater (Figure 1A). Conversely, having Hb within the range of 13.0 to 13.9 g/dL was associated with the lowest percentage of participants in the worst TMT-B performance group. The number of participants with Hb of 15.0 g/dL or greater was small (n = 21). There was strong statistical evidence against the null hypothesis of TMT-B performance homogeneity across the different Hb categories (i.e., chi-square test of 24.6 with 8 degrees of freedom, P= .04. Consistent with what was observed between Hb and TMT-B, the percentage of those in the best tertile of the TMT-A and TMT-B – TMT-A measures was lowest within the Hb range of 10.0 to 11.9 g/dL (Figures 1B, C).
Figure 1.
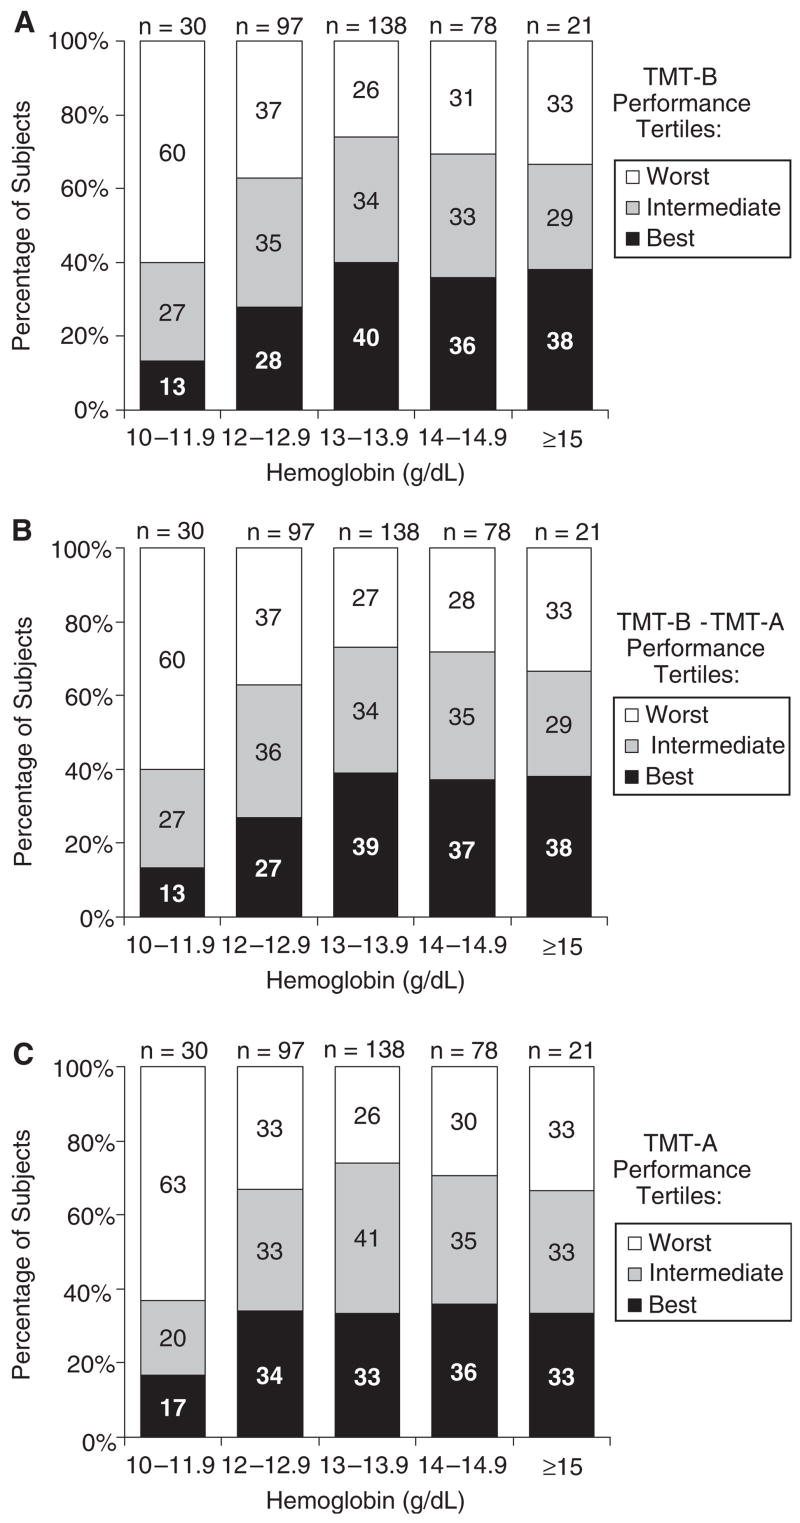
Distribution of study subjects according to hemoglobin categories and performance on tests of executive function. Indicated is the percentage of subjects in each performance group (based on distribution tertiles) as measured using the (A) Trail Making Test Part B (TMT-B), (B) TMT-B minus the Trail Making Test Part A (TMT-A), and (C) TMT-A stratified by hemoglobin categories. The sum of percentages in each column may not add exactly to 100% because of rounding.
Table 2 shows the results of polytomous logistic regression models estimating the likelihood of being in the worst (top) rather than the best (bottom) or intermediate tertile of TMT-B, TMT-B – TMT-A, and TMT-A performance “independently” associated with presence of WHO-defined anemia. For example, the likelihood of being in the worst, as opposed to being in the best, TMT-B tertile was more than five times as high (odds ratio (OR) = 5.2, 95% confidence interval (CI) = 1.3–20.5) for subjects with anemia as for those without anemia after controlling for major potential confounders such as age, education, CVD, renal function, and other major indices of disease, disease severity, and physiological impairment. Similar analysis conducted after excluding the 15 subjects for whom TMT-B performance data were imputed led to analogous results (data not shown). Consistent results were obtained for the relationship between anemia and decline in TMT-B – TMT-A and TMT-A performance.
Table 2.
Multivariate Polytomous Logistic Regression Estimates of the Likelihood of Being in the Worst or Intermediate (Rather than in the Best) Tertiles of Trail-Making Test (TMT)-B, TMT-A, and TMT-B–TMT-A Performance Linked to Prevalent Anemia)
| Likelihood of Being in the Worst as Opposed to the Best Performance Group |
Likelihood of Being in the Intermediate as Opposed to the Best Performance Group |
|||||||
|---|---|---|---|---|---|---|---|---|
| Adjusted for Age, Race, Education, and MMSE | Fully Adjusted* | Adjusted for Age, Race, Education, and MMSE | Fully Adjusted* | |||||
| Measure | Odds Ratio (95% Confidence Interval) P-value | |||||||
| TMT-B | 4.7 (1.3–16.4) | .02 | 5.2 (1.3–20.5) | .02 | 2.2 (0.6–7.9) | .24 | 2.9 (.72–12.0) | .13 |
| TMT-A | 3.4 (1.1–10.3) | .03 | 4.8 (1.5–15.6) | .008 | .87 (0.3–3.1) | .83 | 0.88 (0.2–4.0) | .87 |
| TMT-B 3TMT-A | 4.4 (1.2–15.3) | .02 | 4.2 (1.0–17.2) | .046 | 2.1 (0.6–7.4) | .26 | 1.9 (0.5–7.8) | .34 |
Note: Major independent variable: anemia (hemoglobin concentration < 12 g/dL), which was compared with non-anemia (hemoglobin concentration ≥12 g/dL).
Adjusted for age, race, education, Mini-Mental Status Examination (MMSE) score (≥27 vs<27),13 prevalent cardiovascular disease (angina pectoris, myocardial infarction, congestive heart failure, peripheral vascular disease, or stroke), diabetes mellitus, hypertension, depression, Cockcroft-calculated creatinine clearance (continuous), usual gait speed, mobility difficulty, smoking status, interleukin-6, and thyroid-stimulating hormone (tertiles). If not listed here, covariate units were the same as listed in Table 1. Additional variables that were considered but not included because of lack of statistical significance according to modeling approach defined a priori were drinking habit, body mass index, forced expiratory volume in 1 second, and total cholesterol.
Additional polytomous logistic regression analysis was done to further quantify the increase in the percentage of subjects in the worst tertile of TMT-B across the first three Hb categories observed in Figure 1. In this analysis, given the similar distribution of TMT-B performance across Hb levels of 13.0 to 13.9 g/dL, 14.0 to 14.9 g/dL, and 15.0 g/dL or more, these Hb categories were grouped together. Using this approach, the fully adjusted odds of being in the worst as opposed to in the best TMT-B tertile were 4.9 (95% CI = 1.2–19.7) and 5.9 (95% CI = 1.3–26.4) times as great for subjects with Hb levels of 12.0 to 12.9 g/dL and less than 12 g/dL, respectively, as for those with Hb of 13.0 g/dL or greater (data not shown).
DISCUSSION
This study reported a strong, independent association between mild anemia and a greater likelihood of having executive function impairment in nondemented community-dwelling older women without advanced physical disability. This novel contribution adds to the limited understanding about potentially modifiable physiological impairments linked to executive function impairment in older adults.
Data are scarce on the relationship between mild anemia and overall cognitive impairment and even scarcer in regard to executive function impairment in community-dwelling older adults. Two studies have reported an independent association between anemia and incident dementia.19,20 A cross-sectional association between anemia and MMSE score of less than 24 has also been described,21 although that study did not adjust for major potential confounders. In clinical setting–based studies, associations between severely low Hb and cognitive impairment have also been reported, and moderate and severe anemia has been linked to cognitive impairment. For example, in cancer patients undergoing chemotherapy, anemia severity has been shown to be negatively correlated with MMSE scores,22 and Hb increment associated with erythropoietin therapy has been associated with cognitive dysfunction attenuation during chemotherapy.23 Analogously, in hemodialysis patients with severe anemia, increment in hematocrit after treatment with recombinant erythropoietin has been linked to short-term benefits in cognitive function measured in terms of performance on neuropsychological tests including the TMT-B15 and electroencephalogram parameters,24 although the mechanism explaining this association remains to be better understood. This study builds on the body of literature by contributing novel data on mild anemia and impairment in a specific cognitive function domain that is particularly relevant for physical functioning in community-dwelling older adults.
Whether the relationship between mild anemia and executive function impairment in community-dwelling older adults reported here is causal or noncausal remains to be determined. A possible causal pathway could involve chronic reduction of cerebral oxygenation secondary to decreased oxygen-carrying capacity of the blood linked to anemia. The direct testing of such a hypothesis has remained a challenge, given the methodological difficulty associated with measuring potential changes in cerebral oxygenation as a function of mild Hb reductions in epidemiological studies. Another potential causal pathway could be through the negative effect of anemia on physical function25,26 and conditioning.10 Experimental studies have shown that aerobic exercise training leading to greater aerobic fitness may result in selective improvement in executive control processes in healthy older7 and younger27 adults. It has been speculated that the beneficial effects of cardiorespiratory fitness on executive function could be modulated through an increase in brain-derived neurotrophin factor or a parasympathetic-related increase in efficiency of prefrontal neural function.27
Alternatively, the possibility that anemia might be just a marker of diseases and processes associated with chronic cerebral hypoperfusion in the prefrontal cortex28,29 or neurodegenerative processes such as inflammation cannot be excluded. Anemia could also indirectly reflect the adverse effect of low testosterone levels on cognition, although the latter association remains controversial. Additionally, anemia could be a marker of vitamin B12 deficiency, although vitamin B12 deficiency (serum B12 <200 pg/mL)9 was present in only 23 participants in the current study and was not associated with executive function performance in bivariate or multivariate analysis.
This study has several limitations. First, because of the cross-sectional nature of this study, the risk of incident executive function impairment as a function of baseline anemia or change in Hb over time was not assessed. Second, a few caveats about the operational definition used for executive function impairment should be acknowledged. The definition was based on only a few measures of executive abilities. Also, there is currently no well-established clinical criterion to define executive function impairment in older adults. Thus, although the TMT-B cutoff used to define executive impairment in this study was consistent with thresholds corresponding to 2 standard deviations below the mean in older populations,29,30 it is possible that a significant fraction of older adults in the intermediate or even best groups may also have had some degree of impairment relative to young adults. Third, to minimize confounding, analysis controlled for a number of physical indicators, such as walking speed and mobility difficulty. Because impaired executive function might in fact be a mediator of the relationship between anemia and impaired physical function, this may be considered statistical overadjustment. Despite this, the possibility cannot be excluded that positive confounding from unmeasured disease-related factors, such as subclinical cerebrovascular disease, might still have affected the results. Fourth, this study’s sample size was small, and the effect of the different types of anemia on executive function was not assessed. Fifth, because previous analysis in WHAS II has suggested that variability in tests of performance in cognitive subdomains other than executive function was somewhat limited at baseline, it was not possible to test whether anemia was associated with impaired performance in tests reflecting other domains of cognition or whether it was selective for executive function. Finally, only U.S. urban women aged 70 to 80 who were high functioning and highly educated were assessed; thus, the generalizability of these results to the older population at large may be limited.
In summary, a renewed interest on the topic of anemia and its adverse clinical effect in older adults has been recently observed, with a number of studies reporting associations between mild anemia and physical function–related outcomes25,26 and mortality31 in community-dwelling older adults, although investigation of the relationship between anemia and cognition has lagged behind. Findings from this study support the hypothesis that mild anemia might be an independent risk factor for executive function impairment in community-dwelling older adults. If this association is causal, this could offer an opportunity for preventing executively mediated functional decline through correction of reversible anemia. If it is noncausal, information on this association could still be potentially useful for screening vis-à-vis the identification of those at risk for functional decline. Further investigation of the effect of Hb on executive function in older adults through prospective epidemiological and experimental studies is warranted.
Acknowledgments
Financial Disclosure: Funding for this study was provided by the National Institute on Aging (NIA) Claude D. Pepper Older Americans Independence Center at the Johns Hopkins University (Grant P30 AG021334); NIA Grant R01 AG11703; General Clinical Research Center, National Institutes of Health, National Center for Research Resources Grant M01-RR000052; and a research grant from Ortho Biotech Products, L.P. Dr. Chaves has served as a paid consultant to Ortho Biotech Products, L.P. The terms of this arrangement are being managed by the Johns Hopkins University in accordance with its conflict of interest policies. None of the other coauthors had any financial interest or conflict of interest to disclose.
Sponsor’s Role: The sponsors did not have any role in the design, methods, subject recruitment, data collection, analysis, or preparation of this paper.
Footnotes
This study was previously presented at the 2005 Gerontological Society of America Annual Scientific Meeting in Orlando, Florida, and the 2005 American Society of Hematology Annual Meeting, Atlanta, Georgia.
Author Contributions: Dr. Chaves participated in study concept, design of the study, analysis and interpretation of data, and preparation of manuscript. Dr. Carlson and Dr. Ferrucci participated in the design of the study, interpretation of the data, and preparation of manuscript. Dr. Guralnik and Dr. Fried participated in data collection, interpretation of the data, and preparation of manuscript. Dr. Semba participated in the interpretation of data and preparation of the manuscript.
References
- 1.Royall DR, Lauterbach EC, Cummings JL, et al. Executive control function: A review of its promise and challenges for clinical research. A report from the Committee on Research of the American Neuropsychiatric Association. J Neuropsychiatry Clin Neurosci. 2002;14:377–405. doi: 10.1176/jnp.14.4.377. [DOI] [PubMed] [Google Scholar]
- 2.Royall DR, Palmer R, Chiodo LK, et al. Declining executive control in normal aging predicts change in functional status: The Freedom House Study. J Am Geriatr Soc. 2004;52:346–352. doi: 10.1111/j.1532-5415.2004.52104.x. [DOI] [PubMed] [Google Scholar]
- 3.Grigsby J, Kaye K, Baxter J, et al. Executive cognitive abilities and functional status among community-dwelling older persons in the San Luis Valley Health and Aging Study. J Am Geriatr Soc. 1998;46:590–596. doi: 10.1111/j.1532-5415.1998.tb01075.x. [DOI] [PubMed] [Google Scholar]
- 4.Carlson MC, Fried LP, Xue QL, et al. Association between executive attention and physical functional performance in community-dwelling older women. J Gerontol B Psychol Sci Soc Sci. 1999;54B:S262–S270. doi: 10.1093/geronb/54b.5.s262. [DOI] [PubMed] [Google Scholar]
- 5.Ble A, Volpato S, Zuliani G, et al. Executive function correlates with walking speed in older persons: The InCHIANTI study. J Am Geriatr Soc. 2005;53:410–415. doi: 10.1111/j.1532-5415.2005.53157.x. [DOI] [PubMed] [Google Scholar]
- 6.Daigneault G, Joly P, Frigon JY. Executive functions in the evaluation of accident risk of older drivers. J Clin Exp Neuropsychol. 2002;24:221–238. doi: 10.1076/jcen.24.2.221.993. [DOI] [PubMed] [Google Scholar]
- 7.Kramer AF, Hahn S, Cohen NJ, et al. Ageing, fitness and neurocognitive function. Nature. 1999;400:418–419. doi: 10.1038/22682. [DOI] [PubMed] [Google Scholar]
- 8.Colcombe S, Kramer AF. Fitness effects on the cognitive function of older adults: A meta-analytic study. Psychol Sci. 2003;14:125–130. doi: 10.1111/1467-9280.t01-1-01430. [DOI] [PubMed] [Google Scholar]
- 9.Guralnik JM, Eisenstaedt RS, Ferrucci L, et al. Prevalence of anemia in persons 65 years and older in the United States: Evidence for a high rate of unexplained anemia. Blood. 2004;104:2263–2268. doi: 10.1182/blood-2004-05-1812. [DOI] [PubMed] [Google Scholar]
- 10.Evans WJ. Physical function in men and women with cancer. Effects of anemia and conditioning. Oncology (Williston Park) 2002;6(9 Suppl 10):109–115. [PubMed] [Google Scholar]
- 11.Reitan RM, Wolfson D. The Hasltead-Reitan Neuropsychological Test Battery: Therapy and Clinical Interpretation. Tucson, AZ: Neuropsychological Press; 1985. [Google Scholar]
- 12.Chaves PHM, Garrett ES, Fried LP. Predicting the risk of mobility difficulty in older women with screening nomograms. The Women’s Health and Aging Study II. Arch Intern Med. 2000;160:2525–2533. doi: 10.1001/archinte.160.16.2525. [DOI] [PubMed] [Google Scholar]
- 13.Folstein MF, Folstein SE, McHugh PR. ‘Mini-mental state’ A practical method for grading the cognitive state of patients for the clinician. J Psychiatr Res. 1975;12:189–198. doi: 10.1016/0022-3956(75)90026-6. [DOI] [PubMed] [Google Scholar]
- 14.Bell-McGinty S, Podell K, Franzen M, et al. Standard measures of executive function in predicting instrumental activities of daily living in older adults. Int J Geriatr Psychiatry. 2002;17:828–834. doi: 10.1002/gps.646. [DOI] [PubMed] [Google Scholar]
- 15.Marsh JT, Brown WS, Wolcott D, et al. rHuEPO treatment improves brain and cognitive function of anemic dialysis patients. Kidney Int. 1991;39:155–163. doi: 10.1038/ki.1991.20. [DOI] [PubMed] [Google Scholar]
- 16.Mitrushina M, Boone KB, Razani J, et al., editors. Handbook of Normative Data for Neuropsychological Assessment. 2. New York: Oxford University Press, Inc; 2005. [Google Scholar]
- 17.Yesavage JA, Brink TL, Rose TL, et al. Development and validation of a geriatric depression screening scale: A preliminary report. J Psychiatr Res. 1982;17:37–49. doi: 10.1016/0022-3956(82)90033-4. [DOI] [PubMed] [Google Scholar]
- 18.Cockcroft DW, Gault MH. Prediction of creatinine clearance from serum creatinine. Nephron. 1976;16:31–41. doi: 10.1159/000180580. [DOI] [PubMed] [Google Scholar]
- 19.Beard CM, Kokmen E, O’Brien PC, et al. Risk of Alzheimer’s disease among elderly patients with anemia: Population-based investigations in Olmsted County. Minnesota Ann Epidemiol. 1997;7:219–224. doi: 10.1016/s1047-2797(97)00015-x. [DOI] [PubMed] [Google Scholar]
- 20.Atti AR, Palmer K, Volpato S, et al. Anaemia increases the risk of dementia in cognitively intact elderly. Neurobiol Aging. 2006;27:278–284. doi: 10.1016/j.neurobiolaging.2005.02.007. [DOI] [PubMed] [Google Scholar]
- 21.Argyriadou S, Vlachonikolis I, Melisopoulou H, et al. In what extent anemia coexists with cognitive impairment in elderly: A cross-sectional study in Greece. BMC Fam Pract. 2001;2:5. doi: 10.1186/1471-2296-2-5. [DOI] [PMC free article] [PubMed] [Google Scholar]
- 22.Mancuso A, De Migliorino MSS, et al. Correlation between anemia and functional/cognitive capacity in elderly lung cancer patients treated with chemotherapy. Ann Oncol. 2006;17:146–150. doi: 10.1093/annonc/mdj038. [DOI] [PubMed] [Google Scholar]
- 23.O’Shaughnessy JA, Vukelja SJ, Holmes FA, et al. Feasibility of quantifying the effects of epoetin alfa therapy on cognitive function in women with breast cancer undergoing adjuvant or neoadjuvant chemotherapy. Clin Breast Cancer. 2005;5:439–446. doi: 10.3816/cbc.2005.n.002. [DOI] [PubMed] [Google Scholar]
- 24.Stivelman JC. Benefits of anaemia treatment on cognitive function. Nephrol Dial Transplant. 2000;15(Suppl 3):29–35. doi: 10.1093/oxfordjournals.ndt.a027973. [DOI] [PubMed] [Google Scholar]
- 25.Chaves PHM, Ashar B, Guralnik JM, et al. Looking at the relationship between hemoglobin concentration and prevalent mobility difficulty in older women. Should the criteria currently used to define anemia in older people be reevaluated? J Am Geriatr Soc. 2002;50:1257–1264. doi: 10.1046/j.1532-5415.2002.50313.x. [DOI] [PubMed] [Google Scholar]
- 26.Chaves PHM, Semba RD, Leng SX, et al. Impact of anemia and cardiovascular disease on frailty status of community-dwelling older women: The Women’s Health and Aging Studies I and II. J Gerontol A Biol Sci Med Sci. 2005;60A:M729–M735. doi: 10.1093/gerona/60.6.729. [DOI] [PubMed] [Google Scholar]
- 27.Hansen AL, Johnsen BH, Sollers JJ, III, et al. Heart rate variability and its relation to prefrontal cognitive function: The effects of training and detraining. Eur J Appl Physiol. 2004;93:263–272. doi: 10.1007/s00421-004-1208-0. [DOI] [PubMed] [Google Scholar]
- 28.Pugh KG, Kiely DK, Milberg WP, et al. Selective impairment of frontal-executive cognitive function in African Americans with cardiovascular risk factors. J Am Geriatr Soc. 2003;51:1439–1444. doi: 10.1046/j.1532-5415.2003.51463.x. [DOI] [PMC free article] [PubMed] [Google Scholar]
- 29.Saxton J, Ratcliff G, Newman A, et al. Cognitive test performance and presence of subclinical cardiovascular disease in the cardiovascular health study. Neuroepidemiology. 2000;19:312–319. doi: 10.1159/000026270. [DOI] [PubMed] [Google Scholar]
- 30.Cahn DA, Salmon DP, Butters N, et al. Detection of dementia of the Alzheimer type in a population-based sample: Neuropsychological test performance. J Int Neuropsychol Soc. 1995;1:252–260. doi: 10.1017/s1355617700000242. [DOI] [PubMed] [Google Scholar]
- 31.Chaves PHM, Xue QL, Guralnik JM, et al. What constitutes normal hemoglobin concentration in community-dwelling disabled older women? J Am Geriatr Soc. 2004;52:1811–1816. doi: 10.1111/j.1532-5415.2004.52502.x. [DOI] [PubMed] [Google Scholar]