

Abstract
Using data from InCHIANTI, a prospective population-based survey of older persons, we examined the relationship of peroneal nerve conduction velocity (NCV, a measure of nerve myelination) and compound muscle action potential (CMAP, a measure of axonal degeneration) with calf muscle mass and density, two complementary measures of sarcopenia.
NCV and CMAP were assessed by surface electroneurography of the right peroneal nerve conducted in 1162 participants, 515 men and 647 women, age 21–96 years, free of major neurological diseases. Cross-sectional muscle area and calf muscle density were measured using peripheral quantitative computerized tomography (pQCT). Both nerve and muscle parameters declined with age although in most cases the decline was not linear. In both sexes, CMAP, but not NCV, was independently and significantly associated with calf muscle density. These findings suggest that intrinsic changes in the muscle tissue are partially caused by a reduction in the number of motor axons.
Keywords: Axonal degeneration, Surface ENG, Peroneal CMAP, Muscle density, Sarcopenia
1. Introduction
Observational studies conducted in representative cohorts have demonstrated that skeletal muscle mass and contractile force decline with aging. The rate of age-associated decline in muscle mass and force is extremely variable among individuals due to a mixture of genetic and environmental factors [6,12,20,28,31]. Studying factors that determine accelerated sarcopenia in selected individuals may open new opportunities for prevention, early detection and treatment of this important geriatric condition.
Sarcopenia results from the withdrawal of anabolic stimuli to skeletal muscle, leaving catabolic processes unopposed. The strongest anabolic stimulus to skeletal muscle is the continuous neurological activity of motoneurons. The loss of alpha-motoneurons due to pathology and the consequent reduction in neurological input on muscle fibers is a well-established cause of muscle atrophy [21]. Motor unit number estimation and direct counts of nerve axons have shown that the number of alpha-motoneurons tends to decline with aging in rodents as well as in humans [4,19]. Accordingly, researchers have suggested that the age-associated loss of alpha-motoneurons and the reduction of electrical activity are major causes of sarcopenia [19]. In support of this hypothesis, Metter et al. found an independent, direct relationship between median nerve conduction velocity and grip strength in 197 male participants of the Baltimore Longitudinal Study of Aging [24].
Poor nerve conduction velocity (NCV) mostly reflects the degree of demyelination rather than primary damage to the alpha-motoneurons with consequent axonal degeneration. When axonal degeneration is the prominent phenomenon and the largest axons are preserved, the NCV of the residual axons may be within normal limits. However, the amplitude of the compound muscle action potential (CMAP) is substantially reduced, with consequent weaker muscle response [7,8,30]. The discrimination between demyelinating and axonal peripheral neuropathies is unlikely to be clear-cut, especially in the advanced stages of disease. However, cases of relatively isolated mild motoneuron loss are likely to escapes detection since the overall function is preserved.
We analyzed nerve conduction studies performed at baseline in the participants of the InCHIANTI study. We hypothesized that axonal degeneration in the lower motor neurons expressed by CMAP rather than demyelination expressed by NCV, would be associated with a reduced calf muscle mass and muscle density, two complementary measures of age-related sarcopenia.
2. Methods
2.1. Study population
InCHIANTI is an epidemiological study of factors contributing to the decline of mobility in late life. The InCHIANTI study population is a representative sample of the population living in Greve in Chianti and Bagno a Ripoli, two small towns located in the Chianti countryside of Tuscany, Italy. Participants were all of Caucasian race. The study design, data collection and overall characteristics of the study population were previously described elsewhere [10]. Briefly, 1270 persons aged 65 years or more were selected randomly from the population registry of the two sites. Another 29 subjects were selected randomly from among those who were aged 90 years or older. Finally, men and women randomly sampled from the age strata 20–29, 30–39, 40, 49, 50–59 and 60–64 years were sequentially invited to participate in the study until at least 30 men and 30 women for each decade from 20 to 59 years, and 10 men and 10 women aged from 60 to 64 years had been enrolled.
Of the 1530 subjects originally sampled, 1453 (94%) agreed to participate in the study. Of these, 1263 underwent standard surface electroneurography of the right peroneal nerve. Participants with major neurologic diseases such as stroke (n = 67) and Parkinson’s diseases (n = 10) and those receiving treatment with neuroleptics (n = 24) were excluded from the analysis.
The final study population included 1162 persons, 515 men and 647 women, dispersed over a wide age-range (21–96 years). The study protocol was examined and approved by the INRCA ethical committee. All participants received a detailed description of the purpose and design of the study and all signed an informed participation consent.
2.2. Measures
Standard surface electroneurographic studies (ENG) of the right peroneal nerve were conducted within 3 weeks of the home interview [3]. All studies were performed on an ENG-Neuro MYTO device (Florence, Italy) using standard ENG-Neuro disposable electrodes. A flexible measuring tape was used for measuring distances between stimulating and recording points. The recording electrode was placed on the skin above the extensor digitorum brevis muscle. Stimulation was done using standard supramaximal technique, proximally at the fibular head and distally over the anterior ankle. The measurements were obtained while dorsal foot skin temperature was between 30 and 34 °C [30].
As measures of nerve conduction, we assessed the amplitude of the compound muscle action potential and the nerve conduction velocity. CMAP, which is related to the number of axons that conduct impulses from the stimulus point to the muscle and the number of functioning motor endplates, was measured from peak to peak of the action potential [26,30]. Since the correlation between amplitudes obtained during the proximal and the distal stimulation was very high (r = 0.92; p < 0.0001), we only reported data on distal CMAP in this manuscript. NCV, which reflects the conduction velocity of the fastest motor axons, was calculated by dividing the length of the nerve segment between the two stimulation points by the difference between the proximal and distal time latency [30].
A lower leg pQCT was performed in all study participants using the Stratec XCT 2000. A detailed description of the pQCT exams has been published elsewhere [27]. Standard 2.5mm thick transverse scans at 14 and 38% of the tibial length, proximal to the terminal tip of the tibia were obtained. In this study, we selected measures of the calf cross-sectional muscle area and the average calf muscle density. Muscle density is calculated from X-ray attenuation, expressed in mg/cm3 and is a reliable and valid measure of fatty degeneration of muscle tissue that always accompanies sarcopenia [15]. Images were analyzed using the BonAlyse software (BonAlyse Oy, Jyvaskyla-Finland), and measures of the cross-sectional muscle area and average muscle density were obtained [5].
2.3. Other measures
Weight was measured to the nearest 0.1 kg using a high precision mechanical scale with the participant wearing light clothes and without shoes. Height without shoes was measured to the nearest 0.1 cm. Body mass index (BMI) was calculated as kg/m2.
Levels of physical activity in the year prior to the interview were coded into an ordinal scale, based on responses to a standard questionnaire as: (1) hardly any physical activity; (2) mostly sitting (occasional walks, easy gardening); (3) light exercise (no sweating) 2–4 h/week; (4) moderate exercise (sweat) 1–2 h/week (level 4); (5) moderate exercise >3 h/week; (6) intense exercise (at the limits) >3 times/week. According to this classification, we grouped the participants as: 1–3, inactive or light physical activity; 4–5, moderate physical activity; 6, intense physical activity. Blood samples were obtained from participants after a 12-h fast, and after the participant had been resting in a sitting or supine position for at least 15 min. Hemoglobin levels were analyzed using the hematology auto-analyzer Dasit SE 9000 (Sysmex Corp., Kobe, Japan).
Ankle extension strength was measured with a hand-held dynamometer (Nicholas Muscle Tester, Sammon Preston, Inc., Chicago, IL). Participants were tested while lying in lateral decubitus (opposite to the examined limb) with the hip and knee extended and the ankle in neutral position. The average of two efforts was used for the present analyses. This measure has been previously used as a muscular strength parameter of the lower limb and has been found to have high reliability [1].
Alcohol intake was assessed from the food frequency questionnaire originally developed and validated for the assessment of dietary intake in Italian volunteers participating into the European Prospective Investigation into Cancer and Nutrition (EPIC), a multi-center study conducted in 10 European countries, and aimed at investigating the relationship between diet and cancer [2].
One experienced geriatrician performed all neurological examinations through the entire period of the project, using a highly standardized method [11].
Disease status was ascertained according to standard, pre-established criteria that combined information from self-reported physician diagnosis, current pharmacological treatment, medical records, clinical examinations and blood tests. Diagnostic algorithms were modified versions of those created for the Women’s Health and Aging Study [29]. Diseases included in the current analysis were diabetes, hypertension and peripheral artery disease (PAD), defined as an ankle-arm index of 0.9 or less.
3. Statistical analyses
All analyses were performed separately in men and women. The relationships between age and muscle and nerve conduction parameters were examined by scatter plots. To test whether the cross-sectional relationship between age and each muscle and nerve parameter was linear, we fitted linear models and second-order polynomial models. In all cases of a non-linearity, a two-segment piecewise model allowing for different slopes was fitted to the data and the age-threshold that best discriminated the two slopes was identified using a recursive method as the value providing the best regression fit (highest R2).
Age- and body mass index-adjusted values of cross-sectional muscle area and muscle density across peroneal NCV and peroneal CMAP were estimated from linear and, where appropriate, piecewise regression models [14]. Relationships were summarized by scatter plots with superimposed plots of linear or piecewise regression predicted values.
Using a piecewise regression recursive approach, we identified the threshold in CMAP that best discriminated participants with low muscle density. Both in men and in women, such threshold was close to 4 mV, which is the threshold considered clinically significant in the literature [26]. Using sex-specific logistic models we tested the hypothesis that a peroneal CMAP <4 mV compared to ≥4 mV was independently associated with at least 1 S.D. reduction of muscle cross-sectional area and muscle density. All analyses were adjusted for potential confounders including age, BMI, physical activity, hemoglobin, ankle extension strength, peripheral artery diseases, diabetes, hypertension and alcohol intake. An age-adjusted logistic regression analysis was utilized to examine the differences between participants having peroneal CMAP <4 mV versus ≥4 mV.
The SAS 8.2 statistical package was used for all analyses (SAS Institute, Inc., Cary, NC, USA).
4. Results
In both men and women, we found a strong relationship between age and NCV with no significant departure from linearity as confirmed by the lack of improvement in fit in the second-order polynomial compared to the linear model (Table 1 and Fig. 1). Peroneal CMAP, muscle cross-sectional area and calf muscle density were also lower at older ages but in most cases, the form of the relationship was non-linear. A visual exploration of the data (Figs. 1 and 2) suggested that such relationships could be summarized as two-segment models where the effect of age on the dependent variable became higher after a certain age-threshold. Thus, we fitted the data again using piecewise regression models (third section of models in Tables 1 and 2). The age-threshold that best divided the “slow decline” from the “fast decline” age-ranges was identified recursively as the value yielding the maximum R2-value between 20 and 80 years (Fig. 3). Interestingly, for all the three variables considered (CMAP, cross-sectional muscle area and muscle density), the “fast paced” decline started earlier in women compared to men. The results of the final models are shown in Figs. 1 and 2. On average, NCV was higher in women than in men (p < 0.0001), while the rate of age-associated decline was significantly steeper in men than women (p = 0.0074 for the age × sex interaction). Average CMAP, cross-sectional muscle area and muscle density were significantly higher in men compared to women (p < 0.0001 for all three variables). Over the “slow decline” age-range, the rate of age-associated decline was similar in men and women. However, over the “fast decline” age-range, CMAP and muscle cross-sectional area declined more rapidly with age in men compared to women (age × sex interactions p = 0.0011 for CMAP and p < 0.0001 for muscle area).
Table 1.
Simple, polynomial and piecewise linear regression model summarizing the cross-sectional relationship between age and ENG parameters in both sexes
| Peroneal NCV (m/s) |
Peroneal CMAP (mV) |
|||||||||||
|---|---|---|---|---|---|---|---|---|---|---|---|---|
| Men |
Women |
Men |
Women |
|||||||||
| b±S.E. | p | R2 | b±S.E. | p | R2 | b±S.E. | p | R2 | b±S.E. | p | R2 | |
| Linear | 0.20 | 0.21 | 0.23 | 0.16 | ||||||||
| Intercept | 51.24 ± 0.68 | <0.0001 | 50.94 ± 0.61 | <0.0001 | 15.18±0.66 | <0.0001 | 11.86 ± 0.51 | <0.0001 | ||||
| Age (years) | −0.11 ± 0.01 | <0.0001 | −0.08 ± 0.01 | <0.0001 | −0.12±0.01 | <0.0001 | −0.08 ± 0.01 | <0.0001 | ||||
| Second-order polynomial | 0.20 | 0.21 | 0.24 | 0.19 | ||||||||
| Intercept | 52.87 ± 1.75 | <0.0001 | 48.31 ± 1.51 | <0.0001 | 11.38±1.67 | <0.0001 | 6.53 ± 1.23 | <0.0001 | ||||
| Age (years) | −0.18 ± 0.06 | 0.005 | 0.02 ± 0.05 | 0.70 | 0.03±0.06 | 0.64 | 0.12 ± 0.04 | 0.006 | ||||
| Age2 (years) | 0.00 ± 0.00 | 0.31 | −0.00 ± 0.00 | 0.06 | −0.001±0.005 | 0.013 | −0.002 ± 0.00 | <0.0001 | ||||
| Piecewise | 0.24 | 0.19 | ||||||||||
| Intercept | 13.53±0.89 | <0.0001 | 8.94 ± 0.78 | <0.0001 | ||||||||
| Age 1a | −0.08±0.02 | <0.0001 | −0.01 ± 0.02 | 0.37 | ||||||||
| Age 2a | −0.18±0.02 | <0.0001 | −0.14 ± 0.05 | 0.004 | ||||||||
Sex and variable specific age-threshold between the first and the second age period were identified by recursively evaluating the increment in fit (R2) piecewise models were of the age-threshold was progressively incremented from 20 to 80 years of age (Fig. 3). Note: piecewise model is not reported for peroneal NCV because the simple linear regression provided the best fit to the data both in men and in women.
Beta coefficient for the first (Age 1) and second (Age 2) period considered in the regression model.
Fig. 1.
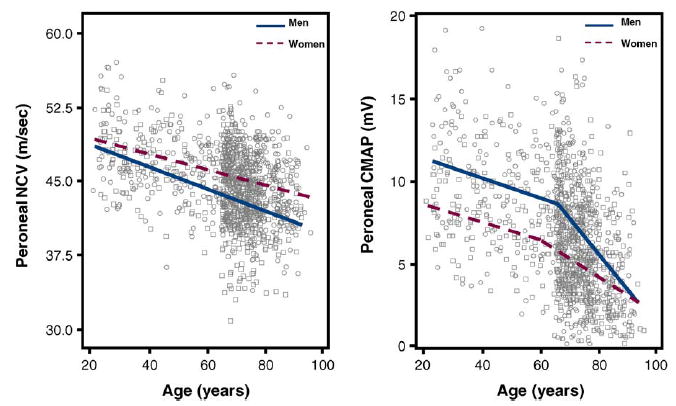
Scatter plots of the peroneal NCV and peroneal CMAP according to age in both sexes. Relationships are summarized by plotting expected values from piecewise adjusted models. Single values are plotted as circles for men and squares for women.
Fig. 2.
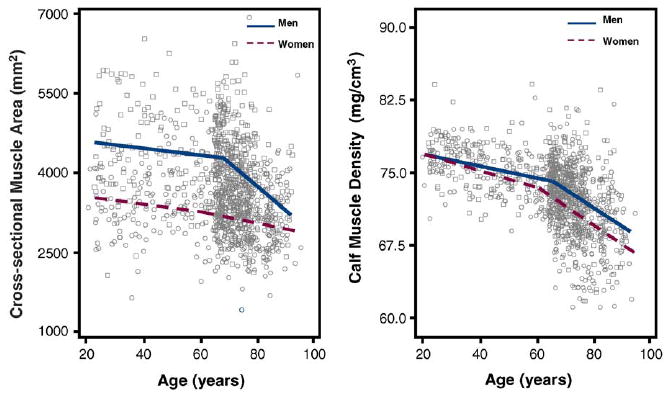
Scatter plots of the calf cross-sectional muscle area and muscle density according to age in both sexes. Relationships are summarized by plotting expected values from piecewise adjusted models. Single values are plotted as circles for men and squares for women.
Table 2.
Simple, polynomial and piecewise linear regression model summarizing the cross-sectional relationship between age and calf muscle parameters in both sexes
| Cross-sectional muscle area (mm2) |
Calf muscle density (mg/cm3) |
|||||||||||
|---|---|---|---|---|---|---|---|---|---|---|---|---|
| Men |
Women |
Men |
Women |
|||||||||
| b ± S.E. | p | R2 | b±S.E. | p | R2 | b±S.E. | p | R2 | b±S.E. | p | R2 | |
| Linear | 0.10 | 0.02 | 0.25 | 0.28 | ||||||||
| Intercept | 5265.9 ± 154.3 | <0.0001 | 3752.8 ± 119.0 | <0.0001 | 80.58 ± 0.58 | <0.0001 | 81.02 ± 0.58 | <0.0001 | ||||
| Age (years) | −17.1 ± 2.27 | <0.0001 | −6.12 ± 1.72 | 0.0004 | −0.11 ± 0.01 | <0.0001 | −0.13 ± 0.01 | <0.0001 | ||||
| Second-order polynomial | 0.13 | 0.03 | 0.26 | 0.30 | ||||||||
| Intercept | 3735.4 ± 389.1 | <0.0001 | 2983.4 ± 292.8 | <0.0001 | 76.30 ± 1.46 | <0.0001 | 75.13 ± 1.41 | <0.0001 | ||||
| Age (years) | 42.62 ± 14.11 | 0.0028 | 23.03 ± 10.30 | 0.03 | 0.06 ± 0.05 | 0.27 | 0.094 ± 0.05 | 0.06 | ||||
| Age2 (years) | −0.50 ± 0.10 | <0.0001 | −0.25 ± 0.09 | 0.004 | −0.001 ± 0.00 | 0.016 | −0.002 ± 0.00 | <0.0001 | ||||
| Piecewise | 0.14 | 0.04 | 0.28 | 0.31 | ||||||||
| Intercept | 4823.0 ± 181.0 | <0.0001 | 3204.9 ± 194.8 | <0.0001 | 78.94 ± 0.74 | <0.0001 | 77.90 ± 0.89 | <0.0001 | ||||
| Age 1a | −8.13 ± 3.02 | 0.007 | 6.80 ± 4.00 | 0.09 | −0.07 ± 0.01 | <0.0001 | −0.06 ± 0.02 | 0.0006 | ||||
| Age 2a | −45.68 ± 6.70 | <0.0001 | −16.50 ± 3.40 | <0.0001 | −0.18 ± 0.02 | <0.0001 | −0.20 ± 0.02 | <0.0001 | ||||
Sex and variable specific age-threshold between the first and the second age period were identified by recursively evaluating the increment in fit (R2) piecewise models were of the age-threshold was progressively incremented from 20 to 80 years of age (Fig. 3).
Beta coefficient for the first (Age 1) and second (Age 2) period considered in the regression model.
Fig. 3.

Value of the regression coefficient for peroneal CMAP, calf muscle density and cross-sectional muscle area on age in both sexes. R2 increment compared to linear models obtained by fitting piecewise models with different age-thresholds between 20 and 80 years.
Independent of age and BMI, in both men and women, peroneal NCV and peroneal CMAP were not associated with cross-sectional muscle area (Table 3 and Fig. 4). Analogously, independent of age and BMI, peroneal NCV was not associated with muscle density (Fig. 5 and Table 3). On the contrary, independent of age and BMI, peroneal CMAP was significantly, although non-linearly associated with calf muscle density (Fig. 5 and Table 3). In the right panel of Fig. 5, the relationship is summarized using a spline. Interestingly, in both sexes, most of the association is limited to values of CAMP below 4mV. We used recursive piecewise model to identify the threshold that best divided the two CAMP regions characterized by different slopes. The changes in R2 associated with all possible thresholds over the range 0.5–8mV are shown in Fig. 6. We found that both in men and in women, the association of CMAP with muscle density was limited to CMAP values below approximately 4 mV. These findings confirm suggestion from the literature that CMAP values <4 mV should be considered clinically important.
Table 3.
Simple and polynomial linear regression model summarizing the cross-sectional relationship between peroneal NCV and CMAP and calf muscle parameters in both sexes
| Cross-sectional muscle area (mm2) |
Calf Muscle Density (mg/cm3) |
|||||||||||
|---|---|---|---|---|---|---|---|---|---|---|---|---|
| Men |
Women |
Men |
Women |
|||||||||
| b±S.E. | p | R2 | b±S.E. | p | R2 | b±S.E. | p | R2 | b±S.E. | p | R2 | |
| Linear | 0.003 | |||||||||||
| Intercept | 2990.1 ± 287.9 | <0.0001 | 0.0002 | 4016.6 ± 352.6 | <0.0001 | 73.5 ± 1.4 | <0.0001 | 0.00 | 73.9 ± 1.5 | <0.0001 | 0.002 | |
| Peroneal NCV (m/s) | 7.61 ± 6.33 | 0.53 | 2.72 ± 8.03 | 0.74 | −0.00 ± 0.0 | <0.97 | −0.04 ± 0.03 | 0.27 | ||||
| Intercept | 3287.6 ± 53.1 | <0.0001 | 0.000 | 4139.7 ± 68.8 | <0.0001 | 0.002 | 72.5 ± 0.3 | <0.0001 | 0.03 | 71.3 ± 0.3 | <0.0001 | 0.02 |
| Peroneal CMAP (mV) | 7.92 ± 7.51 | 0.29 | 0.74 ± 8.34 | 0.93 | 0.13 ± 0.03 | 0.0004 | 0.14 ± 0.04 | 0.0004 | ||||
| Second-order polynomial | ||||||||||||
| Intercept | 71.6 ± 0.4 | <0.0001 | 0.04 | 70.0 ± 0.5 | <0.0001 | 0.04 | ||||||
| Peroneal CMAP (mV) | 0.40 ± 0.12 | 0.0007 | 0.60 ± 0.14 | <0.0001 | ||||||||
| Peroneal CMAP2 (mV) | 0.02 ± 0.001 | 0.02 | −0.03 ± 0.001 | 0.0008 | ||||||||
Note: second-order polynomial model is not reported for cross-sectional muscle area because the simple linear regression provided the best fit to the data both in men and in women.
Fig. 4.
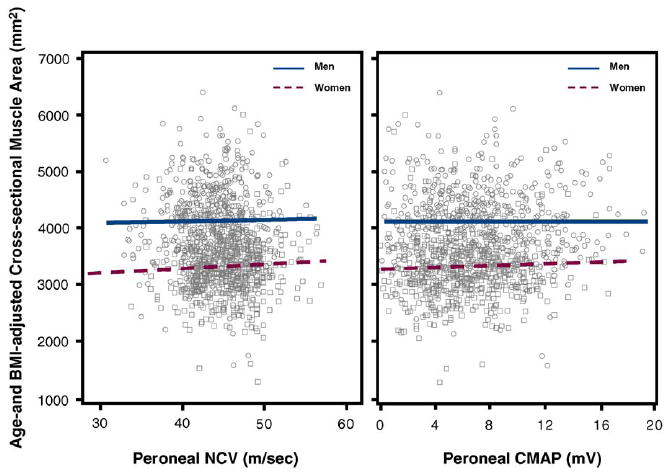
Scatter plots for age- and BMI-adjusted calf cross-sectional muscle area on peroneal NCV and peroneal CMAP in both sexes. Relationships are summarized by plotting estimated values from linear regression models. Single values are plotted as circles for men and squares for women.
Fig. 5.
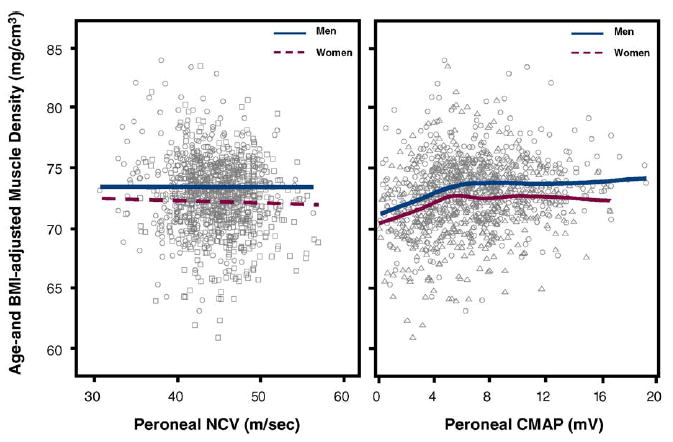
Scatter plots for age- and BMI-adjusted calf muscle density on peroneal NCV and peroneal CMAP in both sexes. In the left panel, the relationship is summarized by plotting values predicted from a linear regression model, while in the left panel, by using a spline with 6 d.f. Single values are plotted as circles for men and squares for women.
Fig. 6.
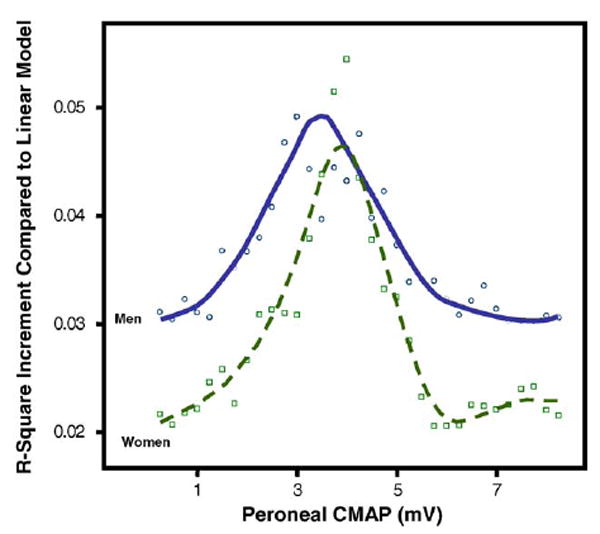
R2 increment compared to linear model obtained by fitting a series of piecewise regression models of the relationship between peroneal CMAP and muscle density, with CMAP threshold progressively changed from 0.5 to 8mV.
In logistic regression models adjusted for age (Table 4, Model A) and for multiple potential confounders (Table 4, Model B), a peroneal CMAP lower than 4mV was associated with a significantly higher probability of having low muscle density (≤1 S.D.). Similar findings were obtained after exclusion of the participants with diabetes and PAD (Table 4, Model C), suggesting that a reduction of the peroneal CMAP is per se independently associated with intrinsic changes in muscle density.
Table 4.
Odds ratios and 95% confidence intervals relating peroneal CMAP <4 mV and the probability of having muscle density 1 S.D. or more lower than the average value calculated in young adults (20–49 years; 86 men and 87 women)
| Age-adjusted OR (Model A) | Fully adjusted OR (Model B) | Fully adjusted OR (Model C) | |
|---|---|---|---|
| Men | |||
| Muscle density 14% | 1.9 (1.2–3.1) | 1.9 (1.2–3.3) | 1.8 (1.1–3.1) |
| Muscle density 38% | 2.1 (1.3–3.4) | 2.3 (1.3–3.9) | 2.1 (1.2–3.8) |
| Women | |||
| Muscle density 14% | 2.1 (1.3–3.6) | 2.3 (1.3–3.8) | 2.2 (1.2–4.0) |
| Muscle density 38% | 2.4 (1.5–4.0) | 2.4 (1.4–4.3) | 2.2 (1.3–3.9) |
Model A was adjusted for age. Model B was adjusted for age, BMI, hemoglobin, physical activity, diabetes, hypertension, plantar flexor strength, peroneal artery disease and alcohol intake. Model C was fully adjusted and restricted to participants free of diabetes and peripheral artery disease (n = 1001).
To understand whether participants with low peroneal CMAP could be clinically detected at the neurological examination, we examined the distribution of major neurological signs suggestive of peripheral neuropathy between participants with a peroneal CMAP <4 mV versus ≥4 mV (Table 5).
Table 5.
Prevalence of peroneal clinical signs of peripheral nerve dysfunction at the lower extremities in InCHIANTI participants, with normal (≥4 mV) vs. low (<4 mV) CMAP
| Neurological signs | Men |
Women |
||||
|---|---|---|---|---|---|---|
| CMAP ≥4 mV (n = 390), n (%) | CMAP <4 mV (n = 117), n (%) | p* | CMAP ≥4 mV (n = 470), n (%) | CMAP <4 mV (n = 165), n (%) | p* | |
| Deep tendon reflexes | ||||||
| Achilleus | ||||||
| Normal or hyperactive | 312 (80.0) | 77 (65.8) | <0.05 | 411 (87.5) | 118 (71.5) | <0.05 |
| Diminished | 78 (20.0) | 40 (34.2) | 59 (12.0) | 47 (28.5) | ||
| Rotuleus | ||||||
| Normal or hyperactive | 347 (89.0) | 36 (66.7) | <0.05 | 449 (95.5) | 144 (87.3) | <0.05 |
| Diminished | 43 (11.0) | 18 (33.3) | 21 (5.5) | 21 (12.7) | ||
| Abnormal touch sensitivity | ||||||
| Lower extremity | 11 (2.8) | 13 (11.1) | NS | 14 (2.9) | 21 (12.7) | <0.05 |
| Abnormal vibration sensitivity | ||||||
| Lower extremity | 45 (11.5) | 25 (21.4) | NS | 56 (11.9) | 38 (23.0) | <0.01 |
| Romberg test | 9 (2.3) | 8 (6.7) | <0.05 | 22 (4.6) | 19 (11.2) | <0.05 |
Using an age-adjusted logistic regression analyses.
Adjusting for age, men with low peroneal CMAP were significantly more likely to have a- or hypo-reflexia in the achilleus reflex (p < 0.05) and positive Romberg test with closed eyes (p < 0.05). Women with a low, compared to normal, peroneal CMAP were more likely to have a- or hypo-reflexia (p < 0.05) in the achilleus reflex, impaired touch sensitivity (p < 0.05), impaired vibration sensitivity (p < 0.01) and positive Romberg test (p < 0.05).
5. Discussion
Using data from a representative sample of the general population, we found that both in men and in women, peroneal CMAP assessed by surface electroneurography was independently and significantly associated with calf muscle density, but not with cross-sectional muscle area. Surprisingly, we found no relationship of NCV with either calf cross-sectional muscle area or average muscle density.
These findings suggest that intrinsic changes in the muscle fibers and the structural organization of muscle tissue that occur with aging evolve in parallel with a progressive degeneration of the peripheral nerves, and in particular, a progressive loss of motor neurons and consequent reduction of motor axons. In fact, the CMAP amplitude assessed by surface electroneurography is directly related to the number of axons that conduct impulses to the muscle [8,9]. These findings are analagous to the substantial reduction of CMAP amplitude that occurs after nerve injuries or compression, and is followed by muscle atrophy. Our findings of an association between CMAP and muscle density are also consistent with our hypothesis that age-associated muscle atrophy is at least in part secondary to motoneuron loss. In fact, previous research has shown that secondary muscle atrophy is often followed by fatty and fibrous degeneration, which results in reduction of muscle density in tomography images [21]. This is in accordance with the findings of Kaminska et al. who reported extensive muscle fiber fragmentation and fat infiltration in extremely old rats [18].
Interestingly, we could not detect any clear association of either peroneal NCV or CMAP with calf cross-sectional muscle area. This finding suggests that the effect of peripheral nerve derangement on sarcopenia cannot be detected by simply looking at macroscopic changes in muscle mass, but rather, should be addressed by looking at muscle tissue structure.
Age-related sarcopenia is only partially detected by looking at macroscopic changes in muscle mass. This view is also consistent with results reported by Hakkinen et al., who suggested that changes in neural drive cause qualitative rather than quantitative changes in the muscle [16]. It is well documented that the relationship between muscle quality (i.e. force generated per unit of muscle mass) and age appears to be dependent on how muscle mass is estimated [25]. A large body of literature in animal as well as in human studies suggest that the development of sarcopenia evolves through at least three separate processes: (1) changes in the intrinsic force-generating capacity of the actin–myosin sarcomeric complex; (2) reduction in size of muscle fibers (fiber atrophy); (3) reduction in the number of muscle fibers per unit volume of muscle mass assessed macroscopically [17,21,23]. Additionally, studies have shown a progressive muscle fatty degeneration reflected in part by the macroscopic “marbling” of the muscle tissue and in part, at a microscopic level, as the growth of a thin layer of fat between muscle fibers. Both these changes resulted in a reduction of muscle density in CT images. Interestingly, a recent study demonstrated that greater muscle fatty degeneration is a risk factor for loss of mobility in older persons [33].
Considered together, our findings are consistent with the hypothesis that aging is associated with a loss of motoneurons and a consequent loss of motor units as originally defined by Galea [13] and Liddel and Sherrington [22]. Tomlinson and Irving showed a similar patter of motoneuronal loss in humans that had been previously observed in rat and mouse studies. These authors assessed the number of motoneurons in the lumbosacral region of the spinal cord in subjects of different ages (13–95 years) and found little age-related difference before the age of 60 years. However, after 60 years, the number of motoneurons declined rapidly, such that subjects in their 1990s had about 70% of the number of motoneurons of subjects up to 60 years of age [32]. These findings confirm the previous observation by Campbell et al., who showed that from 60 to 95 years of age, the number of motor units in the extensor digitorum brevis declined linearly with age and are consistent with our finding of a decline in CMAP and muscle parameters that is especially steeper after the age of 60 years [4].
Participants with low peroneal amplitude showed clinical features of tendon hypo-reflexia, impaired touch sensitivity, impaired vibration sense and mild imbalance, suggesting that the reduction in CMAP was associated with a parallel reduction of sensory spinal neurons. These results are also in accordance with the observation of Vrancken et al., who reported that neurological symptoms and signs suggestive of impaired peripheral nerves occur frequently in older persons, even in those who are not affected by neurological diseases and functional limitations [34]. Thus, our data suggest that in the older population, the prevalence of a mild pre-clinical form of peripheral neuropathy is higher than previously suggested. Interestingly, the detection of neurological signs suggestive of peripheral neuropathy, such as patellar hypo-reflexia, are often considered as a “normal” finding in older persons.
To the best of our knowledge, our study is the only population-based study where parameters of peripheral nervous system integrity and functioning were correlated with calf muscle density, and providing evidence that the peripheral nerve contribution to sarcopenia is mediated by motoneurons loss rather than demylination. Interestingly, our data confirm empirically, in a population-based sample that the critical threshold below which peroneal CMAP should be considered “abnormal” is around 4mV both in men and in women.
The main limitation of this study is its cross-sectional design, which precludes the determination of causation between observed phenomena. Although we took into account several factors known to influence peripheral nerves, we cannot exclude the possibility of unaccounted residual confounding. Another limitation of this study is the possibility that factors other than motoneuron loss could interfere with ENG amplitude. As recently demonstrated, the thickness of subcutaneous tissue, the recruitment strategy and the peak discharge rates of different motor unit (MU) rates can all affect amplitude [9]. Finally, we studied muscles that are not directly innervated by the nerves that were examined.
According to most literature, the amplitude of the surface ENG is directly dependent on the net MU activity and it has been suggested that amplitude [9] should be used as an index of the level of activation provided by the spinal cord. Thus, the loss of muscle fibers and the decreased number of functioning motor units may be secondary to motor neuron death with an incomplete renervation of abandoned muscle fibers by the surviving motor neurons. Our findings contribute to this literature by showing a close relationship between axonal degeneration of the peripheral nerve and age-associated sarcopenia. These findings should be confirmed in a longitudinal study. Further research is needed to investigate the proportion of muscle loss in old age that is explained by axonal degeneration versus other causes.
Acknowledgments
Supported as a “targeted project” (ICS 110.1\RS97.71) by the Italian Ministry of Health and in part by the U.S. National Institute on Aging (Contracts 916413 and 821336).
References
- 1.Bandinelli S, Benvenuti E, Del Lungo I, Baccini M, Benvenuti F, Di Iorio A, et al. Measuring muscular strength of the lower limbs by hand-held dynamometer: a standard protocol. Aging (Milano) 1999 October 5;11:287–93. doi: 10.1007/BF03339802. [DOI] [PubMed] [Google Scholar]
- 2.Bartali B, Turrini A, Salvini S, Lauretani F, Russo CR, Corsi AM, et al. Dietary intake estimated using different methods in two Italian older populations. Arch Gerontol Geriatr. 2004 January–February 1;38:51–60. doi: 10.1016/s0167-4943(03)00084-0. [DOI] [PubMed] [Google Scholar]
- 3.Buschbacher RM. Peroneal nerve motor conduction to the extensor digitorum brevis. Am J Phys Med Rehabil. 1999 November–December;78(Suppl 6):26–S31. doi: 10.1097/00002060-199911001-00006. [DOI] [PubMed] [Google Scholar]
- 4.Campbell MJ, McComas AJ, Petito F. Physiological changes in ageing muscles. J Neurol Neurosurg Psychiatr. 1973 April 2;36:174–82. doi: 10.1136/jnnp.36.2.174. [DOI] [PMC free article] [PubMed] [Google Scholar]
- 5.Cesari M, Penninx BW, Lauretani F, Russo CR, Carter C, Bandinelli S, et al. Hemoglobin levels and skeletal muscle: results from the InCHIANTI study. J Gerontol A Biol Sci Med Sci. 2004 March 3;59:249–54. doi: 10.1093/gerona/59.3.m249. [DOI] [PubMed] [Google Scholar]
- 6.Corsi AM, Ferrucci L, Gozzini A, Tanini A, Brandi ML. Myostatin polymorphisms and age-related sarcopenia in the Italian population. J Am Geriatr Soc. 2002 August 8;50:1463. doi: 10.1046/j.1532-5415.2002.50376.x. [DOI] [PubMed] [Google Scholar]
- 7.Doherty TJ, Brown WF. The estimated numbers and relative sizes of thenar motor units as selected by multiple point stimulation in young and older adults. Muscle Nerve. 1993 April 4;16:355–66. doi: 10.1002/mus.880160404. [DOI] [PubMed] [Google Scholar]
- 8.Falck B, Stalberg E. Motor nerve conduction studies: measurement principles and interpretation of findings. J Clin Neurophysiol. 1995 May 3;12:254–79. [PubMed] [Google Scholar]
- 9.Farina D, Merletti R, Enoka RM. The extraction of neural strategies from the surface EMG. J Appl Physiol. 2004 April 4;96:1486–95. doi: 10.1152/japplphysiol.01070.2003. [DOI] [PubMed] [Google Scholar]
- 10.Ferrucci L, Bandinelli S, Benvenuti E, Di Iorio A, Macchi C, Harris TB, Guralnik JM. Subsystems contributing to the decline in ability to walk: bridging the gap between epidemiology and geriatric practice in the InCHIANTI study. J Am Geriatr Soc. 2000 December 12;48:1618–25. doi: 10.1111/j.1532-5415.2000.tb03873.x. [DOI] [PubMed] [Google Scholar]
- 11.Ferrucci L, Bandinelli S, Cavazzini C, Lauretani F, Corsi A, Bartali B, et al. Neurological examination findings to predict limitations in mobility and falls in older persons without a history of neurological disease. Am J Med. 2004 June 12;116:807–15. doi: 10.1016/j.amjmed.2004.01.010. [DOI] [PubMed] [Google Scholar]
- 12.Fielding RA. The role of progressive resistance training and nutrition in the preservation of lean body mass in the elderly. J Am Coll Nutr. 1995 December 6;14:587–94. doi: 10.1080/07315724.1995.10718547. [DOI] [PubMed] [Google Scholar]
- 13.Galea V. Changes in motor unit estimates with aging. J Clin Neurophysiol. 1996 May 3;13:253–60. doi: 10.1097/00004691-199605000-00010. [DOI] [PubMed] [Google Scholar]
- 14.Goodpaster BH, Carlson CL, Visser M, Kelley DE, Scherzinger A, Harris TB, et al. Attenuation of skeletal muscle and strength in the elderly: the Health ABC Study. J Appl Physiol. 2001 June 6;90:2157–65. doi: 10.1152/jappl.2001.90.6.2157. [DOI] [PubMed] [Google Scholar]
- 15.Goodpaster BH, Kelley DE, Thaete FL, He J, Ross R. Skeletal muscle attenuation determined by computed tomography is associated with skeletal muscle lipid content. J Appl Physiol. 2000 July 1;89:104–10. doi: 10.1152/jappl.2000.89.1.104. [DOI] [PubMed] [Google Scholar]
- 16.Hakkinen K, Kraemer WJ, Kallinen M, Linnamo V, Pastinen UM, Newton RU. Bilateral and unilateral neuromuscular function and muscle cross-sectional area in middle-aged and elderly men and women. J Gerontol A Biol Sci Med Sci. 1996 January 1;51:B21–9. doi: 10.1093/gerona/51a.1.b21. [DOI] [PubMed] [Google Scholar]
- 17.Holloszy JO, Chen M, Cartee GD, Young JC. Skeletal muscle atrophy in old rats: differential changes in the three fiber types. Mech Ageing Dev. 1991 October 2;60:199–213. doi: 10.1016/0047-6374(91)90131-i. [DOI] [PubMed] [Google Scholar]
- 18.Kaminska AM, Fidzianska A, Schulze G, Coper H, Ossowka K, Wolfarth S, et al. Ultrastructural changes in the skeletal muscle of senile rats with significant age-dependent motor deficits. Basic Appl Myol. 1998;8:185–90. [Google Scholar]
- 19.Kawamura Y, Okazaki H, O’Brien PC, Dych PJ. Lumbar motoneurons of man: (I) number and diameter histogram of alpha and gamma axons of ventral root. J Neuropathol Exp Neurol. 1977 September–October 5;36:853–60. doi: 10.1097/00005072-197709000-00009. [DOI] [PubMed] [Google Scholar]
- 20.Lauretani F, Russo CR, Bandinelli S, Bartali B, Cavazzini C, Di Iorio A, et al. Age-associated changes in skeletal muscles and their effect on mobility: an operational diagnosis of sarcopenia. J Appl Physiol. 2003 November 5;95:1851–60. doi: 10.1152/japplphysiol.00246.2003. [DOI] [PubMed] [Google Scholar]
- 21.Lexell J, Taylor CC, Sjostrom M. What is the cause of the ageing atrophy? Total number, size and proportion of different fiber types studied in whole vastus lateralis muscle from 15- to 83-year-old men. J Neurol Sci. 1988 April 2–3;84:275–94. doi: 10.1016/0022-510x(88)90132-3. [DOI] [PubMed] [Google Scholar]
- 22.Liddell EG, Sherrington CS. Recruitment and some other features of reflex inhibition. Proc R Soc. 1925;97:488–518. [Google Scholar]
- 23.Luff AR. Age-associated changes in the innervation of muscle fibers and changes in the mechanical properties of motor units. Ann N Y Acad Sci. 1998 November;854:92–101. doi: 10.1111/j.1749-6632.1998.tb09895.x. [DOI] [PubMed] [Google Scholar]
- 24.Metter EJ, Conwit R, Metter B, Pacheco T, Tobin J. The relationship of peripheral motor nerve conduction velocity to age-associated loss of grip strength. Aging (Milano) 1998 December 6;10:471–8. doi: 10.1007/BF03340161. [DOI] [PubMed] [Google Scholar]
- 25.Metter EJ, Lynch N, Conwit R, Lindle R, Tobin J, Hurley B. Muscle quality and age: cross-sectional and longitudinal comparisons. J Gerontol A Biol Sci Med Sci. 1999 May 5;54:B207–18. doi: 10.1093/gerona/54.5.b207. [DOI] [PubMed] [Google Scholar]
- 26.Oh SJ. Clinical electromyography: nerve conduction studies. second. Baltimore: Williams & Wilkins; 1993. [Google Scholar]
- 27.Russo CR, Lauretani F, Bandinelli S, Bartali B, Di Iorio A, Volpato S, et al. Aging bone in men and women: beyond changes in bone mineral density. Osteoporos Int. 2003 July 7;14:531–8. doi: 10.1007/s00198-002-1322-y. [DOI] [PubMed] [Google Scholar]
- 28.Schuelke M, Wagner KR, Stolz LE, Hubner C, Riebel T, Komen W, et al. Myostatin mutation associated with gross muscle hypertrophy in a child. N Engl J Med. 2004 June 26;350:2682–8. doi: 10.1056/NEJMoa040933. [DOI] [PubMed] [Google Scholar]
- 29.Simonsick EM, Maffeo CE, Rogers SK, Skinner EA, Davis D, Guralnik JM, et al. Methodology and feasibility of a home-based examination in disabled older women: the Women’s Health and Aging Study. J Gerontol A Biol Sci Med Sci. 1997 September 5;52:M264–74. doi: 10.1093/gerona/52a.5.m264. [DOI] [PubMed] [Google Scholar]
- 30.Stalberg E, Fuglsang-Frederiksen A, Bischoff C. Quantitation and standardization in EMG and neurography. Suppl Clin Neurophysiol. 2000;53:101–11. doi: 10.1016/s1567-424x(09)70144-8. [DOI] [PubMed] [Google Scholar]
- 31.Szulc P, Duboeuf F, Marchand F, Delmas PD. Hormonal and lifestyle determinants of appendicular skeletal muscle mass in men: the MINOS study. Am J Clin Nutr. 2004 August 2;80:496–503. doi: 10.1093/ajcn/80.2.496. [DOI] [PubMed] [Google Scholar]
- 32.Tomlinson BE, Irving D. The numbers of limb motor neurons in the human lumbosacral cord throughout life. J Neurol Sci. 1977 November 2;34:213–9. doi: 10.1016/0022-510x(77)90069-7. [DOI] [PubMed] [Google Scholar]
- 33.Visser M, Goodpaster BH, Kritchevsky SB, Newman AB, Nevitt M, Rubin SM, et al. Muscle mass, muscle strength, and muscle fat infiltration as predictors of incident mobility limitations in well-functioning older persons. J Gerontol A Biol Sci Med Sci. 2005 March 3;60:324–33. doi: 10.1093/gerona/60.3.324. [DOI] [PubMed] [Google Scholar]
- 34.Vrancken AF, Franssen H, Wokke JH, Teunissen LL, Notermans NC. Chronic idiopathic axonal polyneuropathy and successful aging of the peripheral nervous system in elderly people. Arch Neurol. 2002 April 4;59:533–40. doi: 10.1001/archneur.59.4.533. [DOI] [PubMed] [Google Scholar]