

Abstract
Study Design
Clinico-epidemiologic study in the Chi-anti area (Tuscany, Italy).
Objectives
To describe prevalence and correlates of back pain in a representative sample of the population.
Summary of Background Data
Back pain is common in old age and is related to functional limitations, but back pain characteristics and correlates in older adults, which may be targeted by specific interventions, are still under-investigated.
Methods
A total of 1,299 persons aged 65 or older were selected from the city registry of Greve in Chianti and Bagno a Ripoli; 1,008 (565 women; 443 men) were included in this analysis. Back pain in the past 12 months was ascertained using a questionnaire. Potential correlates of back pain were identified in age- and sex-adjusted regression analyses, and their independent association with back pain was tested in a multivariate model.
Results
The prevalence of frequent back pain was 31.5%. Back pain was reported less often by men and the very old, was primarily located in the dorsolumbar and lumbar spine, was moderate in intensity and mainly elicited by carrying, lifting, and pushing heavy objects. Among participants who reported frequent back pain, 76.3% had no back pain-related impairments; 7.4% of the overall study population had back pain-related functional limitation. Back pain participants were significantly more likely to report difficulty in heavy household chores, carrying a shopping bag, cutting toenails, and using public transportation. Limited trunk extension, depression, low levels of prior-year physical activity, and hip, knee, and foot pain were independent correlates of back pain.
Conclusions
Frequent back pain is highly prevalent in the older population and is often associated with conditions that are potentially reversible.
Keywords: back pain, elderly, epidemiology
Historically, back pain research has primarily focused on younger, working adults, while little attention was initially given to older persons.1 However, there is evidence that back pain is one of the most frequent complaints in older persons,2,3 and is an independent correlate of functional limitation,4,5 perceived difficulty6 in performing daily life activities, and a risk factor for future disability.7
Studies of younger adults have identified multiple risk factors for back pain, ranging from demographic factors,8 physical and clinical features,9 occupation,10 smoking,11 physical activity,12 and psychologic and socioeconomic conditions,8,13 while comparatively less is known about correlates and risk factors for back pain in older persons. Indeed, most factors identified in the general population as related to back pain are strongly affected by the aging process and, therefore, may have different distributions in older persons.14 Therefore, whether the same factors that predict back pain in younger adults also predict back pain in older persons must be investigated. For instance, job-related features may lose relevance after retirement, while the presence of comorbid conditions may become more important at older ages.
Prevalence estimates of back pain in older populations vary widely because of differences in the definition, sampling strategies, and study designs15 that originate from a mix of clinical and administrative reports that only seldom include information on pain location, intensity, and related functional limitations.
As the elderly population continues to grow, it will become increasingly important to understand the magnitude of back pain and its associated functional limitations on the health and quality of life of the geriatric population, as well as to identify specific correlates that may be potentially reversible.
We used cross-sectional data from the baseline visit of the InCHIANTI study, a clinic-epidemiologic longitudinal survey conducted in Tuscany, Italy, to estimate the prevalence and investigate the characteristics and correlates of back pain in a representative cohort of older Italian persons.
Materials and Methods
InCHIANTI was designed and conducted by the Italian National Research Council on Aging. A detailed description of the study design is reported elsewhere.16 In 1998, a representative cohort of persons aged 65 or more (65+) was selected from the registries of Greve in Chianti (rural area) and Bagno a Ripoli (urban area near Florence). The participation rate was very high (overall 91.6%; 1,154 of 1,260). Baseline data collection (1998–2000) included a structured home interview; instrumental and laboratory tests, a standardized examination by a geriatrician, and a performance assessment by a physiotherapist. Altogether, 565 women and 443 men (total, 1,008) provided complete information for the variables used in this report.
Back Pain Status
Participants were asked if they had any back pain episodes, and eventually, how often they had back pain over the last 12 months. For the purpose of this study, back pain was defined as the presence of frequent back pain (quite often-almost every day).
Back Pain Characteristics and Potential Correlates
Participants who reported frequent back pain were asked specific questions regarding pain severity (on a scale from 0 to 10), usual location of pain, pain-related drug use (past 2 weeks),17 activities that triggered back pain, and functional limitation due to back pain in the last month. Participants who reported the need for another person’s help in selected basic and instrumental activities of daily living (ADLs) (n = 31) were classified as disabled for that specific activity.
For ethical reasons, we could not perform systematically a spine radiograph in all participants. Therefore, to obtain a measure of spinal kyphosis, we measured the distance from the seventh cervical vertebra (C7) to the wall, measured while the participant was standing, heels touching the wall, as a marker of spinal kyphosis.18 Trunk flexion and extension were measured by locating the C7 spinal process and a point on the lower spine along an imaginary line connecting the posterior superior iliac spines; the distance between these two points was measured in centimeters, first while the participant was standing and then following maximal spinal forward flexion and backward flexion (with knees extended).19
Standard algorithms for hypertension, peripheral arteriopathy, diabetes, stroke, cancer, and heart, lung, kidney, and gastric disease, based on history, and drug records and clinical-laboratory findings, were used to assess comorbidity.20 Joint pain in the hip, knee, or foot was evaluated by self report.
Measures of muscle strength assessed bilaterally in eight lower extremity muscle groups were obtained using a hand held dynamometer (Nicholas Manual Muscle Tester, Fred Sammons, Inc.). All measures of lower-extremity muscle strength were highly correlated (Pearson’s correlation coefficients from 0.87 to 0.92).21,22 Therefore, right knee extension torque was used as a marker of lower extremity muscle strength. Upper extremity muscle strength was assessed by a standard handgrip test.23 Lower extremity muscle power was measured in a single leg extension movement using the power rig developed by Bassey and Coll.24 The value of the best performance over 8 repetitions on each side was obtained by dividing crude values of power by individual body weights and multiplying the resulting values by the sex-specific average body weight for the study population.
A lower leg peripheral quantitative computerized tomography (pQCT) was performed (XCT 2000, Stratec, Pforzheim, Germany); standard scans obtained at 66% of the tibia length proximal to the external malleolus provided information on tibial cortical and trabecular mineral bone density, cortical bone area, and muscle hamstring area.25
The participants responded to questions related to current and previous jobs, including a subjective evaluation on a scale from 0 to 10 of the physical demand that each job required. The average physical demand per year was computed for ages 20 to 60 years. Leisure and recreational physical activity during the younger and middle years was assessed by asking: “Did you ever perform any sport or recreational physical activity regularly for at least 3 months during your age periods 20–40 or 40–60 or both?” Physical activity in the previous 12 months was classified as: hardly any physical activity; mostly sitting; light exercise (no sweat); moderate exercise 1–2 hours/wk; moderate exercise 3 hours/wk; intense exercise 3 hours/wk or more. Depressive symptoms were assessed using the Center for Epidemiologic Studies Depression Scale (CES-D).26 Personal mastery (PM), the sense of personal control over health outcomes,27 was evaluated by a standard questionnaire, with lower scores indicating lower mastery. Smoking was investigated by asking “Did you ever smoke consecutively for at least 1 year of your life?”
Statistical Analysis
Statistical analysis was performed using the Stata 7.1 software28 and carried out following a two-step strategy. Age- and sex-adjusted association between frequent back pain and each potential correlate was tested by logistic or linear regression models, as appropriate. Potential correlates significantly associated with frequent back pain in the preliminary analysis were then entered into a stepwise, multiple logistic regression model with frequent back pain as the dependent variable. Type a error was set at P value of 0.05.
Results
Overall, 41.5% of the sample (199 women and 219 men) had not experienced any back pain in the 12 months before baseline, whereas 58.5% (366 women and 224 men) reported at least rare occurrences of back pain. After restricting back pain definition to frequent back pain (quite often-very often-almost always), prevalence was 31.5% (217 women and 101 men): women showed significantly higher prevalence than men (38.4% vs. 22.8%; P < 0.001). Men and women who reported back pain were of similar ages (75.52 ± 6.67 years vs. 75.05 ± 6.85 years).
Figure 1 shows the distribution of back pain among InCHIANTI study participants aged 65 and older, while Table 1 shows the distribution and primary characteristics of back pain in participants with frequent back pain. Prevalence of back pain fluctuated with age, as shown in Table 1, with a statistically significant drop for women aged 85 and older (P < 0.025; data not shown in the table). The prevalence of back pain in men 85 years or older was only negligibly lower than in younger participants and declined significantly only in men 90 year and older (prevalence, 12.5%). The pain was primarily located in the lumbar and dorsolumbar sites, while cervical and upper dorsal pain was rare. Pain severity was generally moderate, ranged from 5.4 ± 2.0 to 6.3 ± 1.7 across gender and age strata (Table 1), and was significantly higher in women than in men (6.1 ± 1.8 vs. 5.5 ± 1.8, P < 0.01) and selectively in women tended to decline with age. Regular use of analgesics and/or nonsteroidal anti-inflammatory drugs in the 2 weeks before the interview was higher in women than in men (16.6% vs. 7.9%, P < 0.05), though substantially moderate (13.5% altogether). Of the whole study population, 7.4% reported back pain-related restriction of their usual activity without significant difference between women and men (25.6% vs. 19.8% of back pain subgroup) while most of the participants who reported back pain (76.3%) were not functionally impaired because of back pain.
Figure 1.
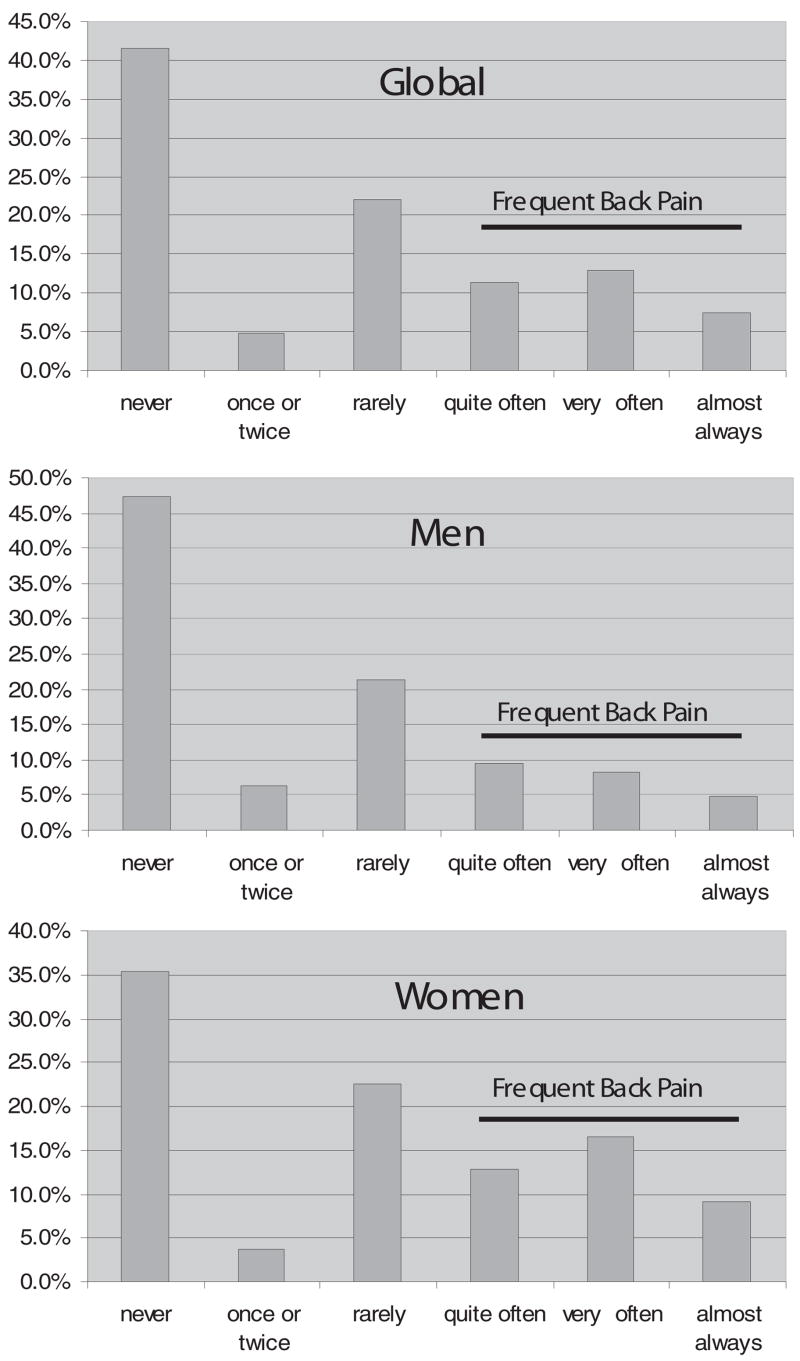
Back pain in the last 12 months among InCHIANTI study participants 65 years of age and older.
Table 1.
One-Year Prevalence and Characteristics of Frequent Back Pain Among InCHIANTI Study Participants 65 Years of Age and Older, According to Gender and Age Group
| Men (n = 443) |
Women (n = 565) |
|||||
|---|---|---|---|---|---|---|
| 65–74 Years (n = 266) | 75–84 Years (n = 133) | 85+ Years (n = 44) | 65–74 Years (n = 302) | 75–84 Years (n = 187) | 85+Years (n = 76) | |
| Entire study population | ||||||
| Prevalence (%) | 20.7 (n = 55) | 26.3 (n = 35) | 25.0 (n = 11) | 38.1 (n = 115) | 44.4 (n = 83) | 25.0 (n = 19) |
| Location of pain (%) | ||||||
| Cervicodorsal | 9.1 | 5.8 | 0.0 | 9.6 | 7.2 | 10.5 |
| Dorsolumbar | 29.1 | 37.1 | 45.5 | 33.0 | 37.4 | 47.4 |
| Lumbar | 61.8 | 57.1 | 54.5 | 57.4 | 55.4 | 42.1 |
| Participants with back pain | ||||||
| Pain severity (mean ± SD) | 5.7 ± 1.7 | 5.4 ± 2.0 | 5.6 ± 1.4 | 6.3 ± 1.7 | 5.9 ± 1.9 | 5.8 ± 1.7 |
| Current use of NSAIDs (%) | 3.6 | 14.3 | 9.1 | 15.6 | 18.1 | 15.8 |
| Functional limitation* (%) | 21.8 | 11.4 | 36.4 | 23.7 | 24.4 | 42.1 |
NSAIDs = nonsteroidal anti-inflammatory drugs.
Functional limitation is defined as reduced activity in the previous years due to BP.
As shown in Figure 2, activities most frequently reported as triggers for back pain were carrying (82%) and lifting (81%) heavy objects, bending over (79%), and pushing heavy objects (74%). After adjusting for age and sex, frequent back pain was significantly associated with disability in heavy household chores (P < 0.01), cutting toenails (P < 0.025), carrying a shopping bag (P < 0.001), and using public transportation (P < 0.05) (Table 2).
Figure 2.

Physical tasks and situations reported to trigger back pain (percentage of participants who reported severe back pain).
Table 2.
Disability in Activities of Daily Living According to Presence Versus Absence of Frequent Back Pain Among InCHIANTI Participants 65 Years of Age and Older
| Presence of Back Pain (n = 318) | Absence of Back Pain (n = 690) | P* | |
|---|---|---|---|
| Indoor mobility (%) | 3.1 | 4.4 | 0.437 |
| Outdoor mobility (%) | 7.9 | 6.7 | 0.379 |
| Climbing/descending stairs (%) | 6.1 | 6.9 | 0.466 |
| Walking 400 m (%) | 10.7 | 8.7 | 0.249 |
| Shopping (%) | 13.2 | 10.4 | 0.121 |
| Washing hands and face (%) | 2.5 | 2.3 | 0.683 |
| Taking a bath (%) | 12.3 | 10.8 | 0.337 |
| Dressing/undressing (%) | 5.7 | 5.2 | 0.457 |
| Eating (%) | 1.0 | 2.2 | 0.256 |
| Cooking (%) | 5.2 | 7.4 | 0.310 |
| Using the toilet (%) | 3.8 | 3.5 | 0.658 |
| Going to/rising from bed (%) | 3.5 | 3.9 | 0.912 |
| Light household chores (%) | 8.2 | 7.9 | 0.344 |
| Heavy household chores (%) | 22.5 | 15.7 | 0.006 |
| Cutting toenails (%) | 25.5 | 18.1 | 0.014 |
| Arms over head (%) | 2.2 | 3.0 | 0.589 |
| Manual dexterity (%) | 6.9 | 5.1 | 0.185 |
| Carrying shopping bag (%) | 24.6 | 11.2 | 0.000 |
| Laundry (%) | 12.2 | 10.9 | 0.136 |
| Using public transport (%) | 22.1 | 16.3 | 0.034 |
From age- and sex-adjusted logistic regression models.
Tables 3 and 4 show the distribution of major covariates in participants who reported and did not report back pain.
Table 3.
BMI, Measures of Kyphosis, Spine Mobility, Muscle Function, and pQCT Derived Bone Parameters According to Presence Versus Absence of Frequent Back Pain in InCHIANTI Participants
| Presence of Back Pain (n = 318) | Absence of Back Pain (n = 690) | P* | |
|---|---|---|---|
| BMI (%) <25 vs. 25–30 (kg/m2) | 28.4 vs. 44.2 | 29.1 vs. 47.2 | 0.965 |
| <25 vs. >30 (kg/m2) | 28.4 vs. 27.4 | 29.1 vs. 23.7 | 0.639 |
| C7-wall distance (cm) | 5.3 ± 1.9 | 5.0 ± 1.5 | 0.026 |
| Trunk extension (cm) (mean ± SD) | 2.7 ± 1.4 | 3.0 ± 1.6 | 0.013 |
| Trunk flexion (cm) (mean ± SD) | 5.7 ± 2.3 | 5.9 ± 2.4 | 0.425 |
| Trunk flexibility: flexion + extension (cm) (mean ± SD) | 8.4 ± 3.4 | 8.9 ± 3.7 | 0.132 |
| Lower extremity strength (N·m) (mean ± SD) | 34.8 ± 15.6 | 39.6 ± 16.4 | 0.047 |
| Upper extremity strength (Kg) (mean ± SD) | 24.2 ± 11.0 | 27.5 ± 11.9 | 0.146 |
| Weight-adjusted power (W) (mean ± SD) | 89.9 ± 59.1 | 106.7 ± 59.0 | 0.126 |
| PQCT trabecular density (g/cm3) (mean ± SD) | 0.257 ± 0.044 | 0.265 ± 0.040 | 0.971 |
| PQCT cortical density (g/cm3) (mean ± SD) | 0.992 ± 0.074 | 0.999 ± 0.081 | 0.896 |
| PQCT cortical area (cm2) (mean ± SD) | 2.8 ± 0.7 | 3.0 ± 0.8 | 0.839 |
| PQCT muscle area (cm2) (mean ± SD) | 61.0 ± 13.0 | 63.0 ± 12.6 | 0.852 |
From age- and sex-adjusted linear or logistic regression models.
Table 4.
Lifestyle, Psychosocial Features, and Comorbidity According to Presence Versus Absence of Frequent Back Pain in InCHIANTI Participants
| Presence of Back Pain (n = 318) | Absence of Back Pain (n = 690) | P | |
|---|---|---|---|
| Years of formal education (mean ± SD) | 5.0 ± 3.0 | 5.6 ± 3.8 | 0.154 |
| Depression (CES-D score) (mean ± SD) | 18.7 ± 5.9 | 16.7 ± 6.0 | 0.000 |
| Personal mastery score (mean ± SD) | 18.6 ± 4.3 | 20.1 ± 4.0 | 0.000 |
| Current or former smoker (%) | 36.2 | 44.1 | 0.527 |
| Physical activity, age 20–40 yr (mean ± SD) | 2.7 ± 1.3 | 2.7 ± 1.3 | 0.325 |
| Physical activity, age 40–60 yr (mean ± SD) | 2.3 ± 1.2 | 2.4 ± 1.2 | 0.997 |
| Physical activity, last year (mean ± SD) | 1.0 ± 0.9 | 1.3 ± 0.9 | 0.000 |
| Work-related physical activity, age 20–60 yr (mean ± SD) | 5.6 ± 3.4 | 5.2 ± 3.6 | 0.002 |
| Heart disease (%) | 12.5 | 12.3 | 0.024 |
| Peripheral arteriopathy (%) | 22.9 | 19.2 | 0.056 |
| Hypertension (%) | 73.0 | 71.0 | 0.728 |
| Diabetes (%) | 10.0 | 11.8 | 0.754 |
| Stroke (%) | 7.0 | 7.2 | 0.794 |
| Gastric disease (%) | 3.0 | 5.7 | 0.341 |
| Lung disease (%) | 7.0 | 7.3 | 0.497 |
| Kidney disease (%) | 2.6 | 1.8 | 0.184 |
| Cancer (%) | 6.6 | 6.4 | 0.78 |
| Hip pain (%) | 23.0 | 6.8 | 0.000 |
| Knee pain (%) | 34.7 | 16.6 | 0.000 |
| Foot pain (%) | 28.9 | 13.1 | 0.000 |
Body mass index (BMI) was not significantly associated with frequent back pain, even after categorization of BMI into <25 kg/m2, 25 to 30 kg/m2 (overweight), and >30 kg/m2 (obesity). Participants with frequent back pain showed significantly larger C7-wall distance (P < 0.05) and reduced trunk extension (P < 0.025) but not flexion. Weight-adjusted power and upper-extremity strength were not significantly associated with frequent back pain, nor were age- and gender-adjusted pQCT measures, while lower-extremity strength was significantly lower in participants with frequent back pain (P < 0.05) (Table 3).
The CES-D score was significantly higher in women than in men, both in the back pain (P = 0.000) and in the no-back pain (P = 0.000) groups. Depressive symptoms (CES-D score) and low PM were significantly associated with frequent back pain (P < 0.001 for both). No association was found between history of leisure-time physical activity and frequent back pain, while reported physical activity in the last year was significant lower (P < 0.001) and history of work-related high physical demand was significantly higher (P < 0.005) in participants with frequent back pain. Frequent back pain was not significantly associated with any other common disorder explored except for pain in other locations, such as the hips, knees, and feet (P < 0.001 for the 3 variables) (Table 4).
After elimination of the variable not independently associated with frequent back pain through stepwise logistic regression, hip pain (P < 0.001), knee pain (P < 0.005), foot pain (P < 0.001), low trunk extension (P < 0.001), depression (P < 0.025), and low score of physical activity in the previous 12 months (P < 0.01) remained significant independent correlates of frequent back pain (Table 5).
Table 5.
Stepwise Logistic Regression Aimed at Identifying Correlates Independently and Significantly Associated With BP in the InCHIANTI Study Population
| Beta | SE(beta) | P | |
|---|---|---|---|
| Hip pain | 1.06 | 0.26 | 0.000 |
| Knee pain | 0.64 | 0.21 | 0.003 |
| Foot pain | 0.85 | 0.22 | 0.000 |
| Trunk extension | −0.20 | 0.06 | 0.001 |
| Depression | 0.03 | 0.02 | 0.005 |
| Physical activity last year | −0.30 | 0.11 | 0.006 |
Final model: LR χ2 = 101.5; probability < χ2 = 0.0000; pseudo R2 = 0.114.
Discussion
In a representative sample of an Italian population aged 65 years and older, the 1-year cumulative prevalence of frequent back pain was 31.5%. This finding consistent with most studies reporting back pain prevalence in the general population (36%–37%).29,30 In particular, the 31.5% 1-year prevalence of frequent back pain found in our study is consistent with the prevalence of back pain reported in the Saskatchewan adult population (6-month prevalence = 23.7%; and following 6-months incidence = 8%).31
In agreement with most studies performed in U.S. populations, back pain was more common in women than men, and the most frequent location was the lower back.29 Women generally report more back pain than men,29 perhaps because of higher incidence of painful spine disease (e.g., vertebral microfractures), to more frequent practice of activities that may trigger back pain (e.g., household chores), and perhaps to “complaining” being more socially acceptable for women than for men. Consistent with most literature,32,33 we found that the prevalence of back pain tended to be lower in the oldest age group, showing a decline above the age of 85 in women and of 90 in men. Previous studies have found that very old persons tend to report systematically less pain,32 perhaps because of a recall bias, the acceptance of some pain as “natural” in old age, and/or underestimation of pain compared with more serious health problems that occur in the same time-frame. It is also possible that the very old experience less pain because they tend to perform less physical efforts and are less likely to be affected by work-related stress. Additionally, older participants may be a selected population that is less affected by back pain.
The 13.5% prevalence of back pain participants who reported regular analgesic drug use in the previous 2 weeks is consistent with the findings of a recent study performed in Spain (14.6%)34 but substantially lower than the 35% to 38% prevalence reported by less recent studies performed in the United States.35 The finding that women presented both significantly more severe pain and were more likely to use drugs than men is consistent with the literature.4 Since high CES-D score was an independent predictor of back pain in our population, and was significantly higher in women, both in the back pain and in the no-back pain group, depression may partially explain this sex-related difference, suggesting that selected older back pain patients may benefit from treatment with antidepressants.
In survivors (70+) of the Framingham study, 18% to 34% of all functional limitations were attributable to back pain, and, similar to our analysis, pushing or pulling a large object was significantly associated with back pain.5 In our study, more than three fourths of our back pain population were not functionally impaired because of back pain, showing that in most cases back pain was not associated with disability. Out of the whole study population, 7.4% reported a back pain-related functional limitation in the past month; our results confirm previous findings of associations between back pain and the self-reported ability to perform heavy household chores, cutting toenails, and carrying a shopping bag.4 Further, we found that back pain was also associated with difficulty in using public transportation, but not with the ability to perform more basic self-care and mobility tasks. Interestingly, the activities that were significantly limited in participants with back pain were often the same activities reported as triggers for back pain onset.
In a recent Danish study, musculoskeletal, lung and cardiovascular disease, gastric ulcer, headache/migraine, and low physical functioning were significant independent correlates of back pain.14 In our analysis, the only comorbidities associated with back pain were suggesting that back pain in the elderly should not necessarily be inscribed into a picture of general poor health.36
In preliminary analyses, we found that both a higher score of depressive symptoms and a lower score on the PM questionnaire were significantly correlated with back pain. The association between back pain and depression has been well documented in the general population; in longitudinal studies, depression was found to be a risk factor for subsequent back pain, while results about the reverse association are conflicting.13 PM is a complex psychologic dimension conveying self-esteem, self-efficacy, and locus of control, a basic determinant of ability to cope with stressful conditions, including disease.37 Both depression and the experience of inescapable loss related to chronic conditions may lower self-esteem and mastery; in particular, it has been hypothesized that depression may produce lower PM and increased psychologic vulnerability in older persons.38 In our multivariate analysis, depression, but not PM, maintained a significant association with back pain, suggesting that, at least in this population, depression may be the mediating mechanism that buffers the association between back pain and PM.
Poor lower-extremity strength was significantly associated with back pain. Because of the cross-sectional nature of our study, no conclusions can be drawn about the direction of causality. Poor strength may be a precursor of back pain or may be the consequence of a back pain episode. To shed more light into the directionality of this causal pathway, the association between leg strength and back pain should be examined in a longitudinal fashion.
Back pain correlates identified in studies performed in younger populations, such as smoking, low education, and high BMI, were not associated with back pain in our analysis, while history of work-related physical activity was no longer statistically significant in the multivariate analysis. Altogether, our findings suggest that many factors significantly associated with back pain in working-age adults may be no longer important in old age.14 This hypothesis should be verified in a longitudinal setting.
A limitation of this study is the lack of radiologic examinations of the spine, which could not be systematically performed in our population sample because of ethical reasons. Limited trunk extension was the only physical measure that maintained an association with back pain in the multivariate analysis. It is well known that lumbar flexion range of motion is poorly related to pain and disability in back pain.30 Prospective studies should evaluate the possibility that variations in trunk extension may have a closer association with back pain in older adults. Our findings are consistent with the notion that the aging spine becomes progressively stenotic. However, because of the lack of spine radiologic images in our assessment, this hypothesis could not be verified. Clinically, movements into trunk extension often tend to exacerbate lumbar symptoms seen in older adults. This hypothesis, if confirmed, would have meaningful implications for the rehabilitative approach to these patients. Thus, our findings should be verified in a clinical series of patients in whom a spine radiograph is available.
Since we could not calculate Cobb’s angle on spinal radiographs, we chose the distance C7-wall as an index of thoracic hyperkyphosis: the independent association between back pain and the distance C7-wall, suggests a possible association of back pain with osteoporotic vertebral microfractures, which are the main cause of thoracic hyperkyphosis in the elderly; this interpretation is not necessarily in contrast with the lack of a significant age- and gender-adjusted association between back pain and bone density evaluated at the lower leg by pQCT, as the individual time-related pattern of bone mass loss may be quite different in the spine and in the lower limbs.39 Claims that vertebral osteoporosis play a role in back pain have not been confirmed.39 It is possible that, apart from the acute pain, the association may occur only when the deformities consequent to vertebral fracture produce into postural disalignment, as represented by the distance C7-wall and/or impaired mobility (trunk extension), and this should also be verified in clinical studies using spinal x-ray images. The significant association found between back pain and the report of pain in other joints suggests that, with increasing age, back pain often presents in the context of a broader pattern of musculoskeletal pain.1 Pain involving the back and one or more lower extremity joint may be related to a generalized disorder, such as osteoarthritis, but may also depend on pain radiation and pain-induced alterations of posture and gait, with consequent joint stress other than the primary source of pain.
Persons affected by back pain were significantly less physically active in the year before the interview. Given the cross-sectional nature of these data, we cannot make inferences on whether back pain was a cause of mobility limitation or a maintained physical activity had a protective effect against the development of back pain.
Conclusion
In this representative sample of the Italian elderly population, frequent back pain had prevalence similar to that reported in most epidemiologic studies. Functional limitation was reported by 7.4% of the study population, while most back pain patients were not impaired by back pain. Back pain showed a significant association with depressed mood and physical activity, conditions that are potentially reversible. Pain in other joints, depression, low trunk extension, and low prior-year physical activity, were all independent correlates of back pain. Longitudinal data are needed to verify whether these factors are implied in the causal pathway to back pain and whether a specific intervention on such correlates may prevent or reduce back pain in old age.
Key Points.
The prevalence of frequent back pain in a representative cohort of Italian persons aged 65 years and older was 31.5%; prevalence was higher in women and in the young.
Back pain was primarily located in the dorsolumbar spine and was generally moderate in intensity. Carrying, lifting, and pushing heavy objects triggered back pain.
No back pain-related impairment was reported by 76.3% of our back pain group; back pain-related functional limitation was reported by 7.4% of the overall study population. Doing heavy household chores, cutting toenails, carrying a shopping bag, and using public transportation were significantly more impaired in persons affected by back pain.
Limited trunk extension, depression, and low prior-year physical activity, as well as hip, knee, and foot pain were independent back pain correlates.
Acknowledgments
The InCHIANTI study was supported by the U.S. National Institute on Aging, NIH.
Institutional funds were received in support of this work. No benefits in any form have been or will be received from a commercial party related directly or indirectly to the subject of this manuscript.
Footnotes
The manuscript submitted does not contain information about medical device(s)/drug(s).
References
- 1.Woolf AD, Pfleger B. Burden of major musculoskeletal conditions. Bull World Health Organ. 2003;8:646–56. [PMC free article] [PubMed] [Google Scholar]
- 2.Koch H, Smith MC. Advanced Data From Vital and Health Statistics (NCHS), No. 110 [DHHS Publication no. PHS 85–1250] Vol. 110. Hyattsville, MD: Public Health Service; 1985. Office-based ambulatory care for patients 75 years old and over. National Ambulatory Medical care Survey, 1980 and 1981; pp. 1–14. [Google Scholar]
- 3.Goel V, Iron K, Williams JL. Indicators of health determinants and health status. In: Goel V, Williams JI, Anderson GM, et al., editors. Patterns of Health Care in Ontario: The ICES Pactice Atlas. 2. Ottawa: Canadian Medical Association; 1996. pp. 5–26. [Google Scholar]
- 4.Lavsky-Shulhan M, Wallace RB, Kohout FJ, et al. Prevalence and functional correlates of low back pain in the elderly: the Iowa 65+ rural health study. J Am Geriatr Soc. 1985;33:23–8. doi: 10.1111/j.1532-5415.1985.tb02855.x. [DOI] [PubMed] [Google Scholar]
- 5.Edmond SL, Felson DT. Function and back symptoms in older adults. J Am Geriatr Soc. 2003;51:1702–9. doi: 10.1046/j.1532-5415.2003.51553.x. [DOI] [PubMed] [Google Scholar]
- 6.Leveille SG, Guralnik JM, Hochberg M, et al. Low back pain and disability in older women: independent association with difficulty but not inability to perform daily living activities. J Gerontol. 1999;54:M487–93. doi: 10.1093/gerona/54.10.m487. [DOI] [PubMed] [Google Scholar]
- 7.Guralnik JM, Kaplan GA. Predictors of healthy aging: prospective evidence from the Alameda County Study. Am J Public Health. 1989;79:703–8. doi: 10.2105/ajph.79.6.703. [DOI] [PMC free article] [PubMed] [Google Scholar]
- 8.Hurwitz EL, Morgenstern H. Correlates of back problems and back related disability in the United States. J Clin Epidemiol. 1997;50:669–81. doi: 10.1016/s0895-4356(97)00018-8. [DOI] [PubMed] [Google Scholar]
- 9.Lundberg G, Gerdle B. Correlations between joint and spinal mobility, spinal sagittal configuration, segmental mobility, segmental pain, symptoms and disabilities in female homecare personnel. Scand J Rehabil Med. 2000;32:124–33. doi: 10.1080/003655000750045479. [DOI] [PubMed] [Google Scholar]
- 10.Linton SJ. Occupational psychological factors increase the risk for back pain: a systematic review. J Occup Rehabil. 2001;11:53–66. doi: 10.1023/a:1016656225318. [DOI] [PubMed] [Google Scholar]
- 11.Goldberg MS, Scott SC, Mayo NE. A review of the association between cigarette smoking and the development of nonspecific back pain and related outcomes. Spine. 2000;25:995–1014. doi: 10.1097/00007632-200004150-00016. [DOI] [PubMed] [Google Scholar]
- 12.Payne N, Gledhill N, Katzmarzyk PT, et al. Health-related fitness, physical activity, and history of back pain. Can J Appl Physiol. 2000;25:236–49. doi: 10.1139/h00-018. [DOI] [PubMed] [Google Scholar]
- 13.Larson SL, Clark MR, Eaton WW. Depressive disorder as a long-term antecedent risk factor for incident back pain: a 13-year follow-up study from the Baltimore Epidemiological Catchment Area sample. Psychol Med. 2004;34:211–9. doi: 10.1017/s0033291703001041. [DOI] [PubMed] [Google Scholar]
- 14.Hartvigsen J, Christensen K, Frederiksen H. Back pain remains a common symptom in old age: a population-based study of 4486 Danish twins aged 70–102. Eur Spine J. 2003;12:528–34. doi: 10.1007/s00586-003-0542-y. [DOI] [PMC free article] [PubMed] [Google Scholar]
- 15.Hartley BB, Warren JK, Rachon PA, et al. The prevalence of low back pain in the elderly: a systematic review of the literature. Spine. 1999;24:1813–9. doi: 10.1097/00007632-199909010-00011. [DOI] [PubMed] [Google Scholar]
- 16.Ferrucci L, Bandinelli S, Benvenuti E, et al. Subsystems contributing to the decline in ability to walk: bridging the gap between epidemiology and geriatric practice in the InCHIANTI Study. J Am Geriatr Soc. 2000;48:1618–25. doi: 10.1111/j.1532-5415.2000.tb03873.x. [DOI] [PubMed] [Google Scholar]
- 17.Heikkinen E, Waters WE. The Elderly in Eleven Countries: A Socio-Medical Survey. Copenhagen: WHO; 1989. [Google Scholar]
- 18.Hammerberg EM, Wood KB. Sagittal profile of the elderly. J Spinal Disord Tech. 2003;16:44–50. doi: 10.1097/00024720-200302000-00008. [DOI] [PubMed] [Google Scholar]
- 19.Alaranta H, Hurri H, Heliovaara M, et al. Flexibility of the spine: normative values of goniometric and tape measurements. Scand J Rehabil Med. 1994;26:147–54. [PubMed] [Google Scholar]
- 20.Guralnik JM, Fried LP, Simonsik EM, et al., editors. [NIH Publication no. 95–4009] Bethesda, MD: National Institute on Aging; 1995. The Women’s Health and Aging Study: Health and Social Characteristics of Older Women With Disability. [Google Scholar]
- 21.Bandinelli S, Benvenuti E, Del Lungo I, et al. Measuring muscular strength of the lower limbs by hand-held dynamometer: a standard protocol. Aging Clin Exp Res. 1999;11:287–93. doi: 10.1007/BF03339802. [DOI] [PubMed] [Google Scholar]
- 22.Lauretani F, Russo CR, Bandinelli S, et al. Age-associated changes in skeletal muscles and their effect on mobility: an operational diagnosis of sarcopenia. J Appl Physiol. 2003;95:1851–60. doi: 10.1152/japplphysiol.00246.2003. [DOI] [PubMed] [Google Scholar]
- 23.Rantanen T, Guralnick JM, Foley D, et al. Midlife handgrip strength as a predictor of old age disability. JAMA. 1999;281:558–60. doi: 10.1001/jama.281.6.558. [DOI] [PubMed] [Google Scholar]
- 24.Bassey EJ, Short AH. New method for measuring power output in a single leg extension: feasibility, reliability and validity. Eur J Appl Physiol. 1990;60:385–90. doi: 10.1007/BF00713504. [DOI] [PubMed] [Google Scholar]
- 25.Braun MJ, Meta MD, Schneider P, et al. Clinical evaluation of a high-resolution new peripheral quantitative computerized tomography (pQCT) scanner for the bone densitometry at the lower limbs. Phys Med Biol. 1998;43:2279–94. doi: 10.1088/0031-9155/43/8/020. [DOI] [PubMed] [Google Scholar]
- 26.Radloff LS. The CED-S scale: a self-report depression scale for research in the general population. Appl Psychol Meas. 1977;1:385–401. [Google Scholar]
- 27.Derogatis LR, Lipman RS, Rickels K, et al. The Hopkins Symptom Checklist (HSCL): a self-report symptom inventory. Behav Sci. 1974;19:1–15. doi: 10.1002/bs.3830190102. [DOI] [PubMed] [Google Scholar]
- 28.Stata Corp. Stata Statistical Software (7.1) College Station, TX: Stata Corp; 2002. [Google Scholar]
- 29.Edmond SL, Felson DT. Prevalence of back symptoms in elders. J Rheumatol. 2000;27:220–5. [PubMed] [Google Scholar]
- 30.Waddell G. The Back Pain Revolution. London: Hartcourt; 1999. [Google Scholar]
- 31.George C. The six-month incidence of clinically significant low back pain in the Saskatchewan adult population. Spine. 2002;27:1778–82. doi: 10.1097/00007632-200208150-00017. [DOI] [PubMed] [Google Scholar]
- 32.Brattberg G, Parker MG, Thorslund M. The prevalence of pain among the oldest old in Sweden. Pain. 1996;67:29–34. doi: 10.1016/0304-3959(96)03047-3. [DOI] [PubMed] [Google Scholar]
- 33.Dawson EG, Kanim LE, Sra P, et al. Low back pain recollection versus concurrent accounts: outcomes analysis. Spine. 2002;27:984–93. doi: 10.1097/00007632-200205010-00020. [DOI] [PubMed] [Google Scholar]
- 34.Bassols A, Bosch F, Campillo M, et al. Back pain in the general population of Catalonia (Spain): prevalence, characteristics and therapeutic behaviour. Gac Sanit. 2003;17:97–107. doi: 10.1016/s0213-9111(03)71706-3. [DOI] [PubMed] [Google Scholar]
- 35.Pitkala KH, Strandberg TE, Tilvis RS. Management of nonmalignant pain in home-dwelling older people: a population-based survey. J Am Geriatr Soc. 2002;50:1861–5. doi: 10.1046/j.1532-5415.2002.50517.x. [DOI] [PubMed] [Google Scholar]
- 36.Hestbaek L, Leboeuf-Yde C, Manniche C. Is low back pain part of a general health pattern or is it a separate and distinctive entity? A critical literature review of comorbidity with low back pain. J Manipulative Physiol Ther. 2003;26:243–52. doi: 10.1016/s0161-4754(03)00003-4. [DOI] [PubMed] [Google Scholar]
- 37.Rodin J. Aging and health: effects of the sense of control. Science. 1986;233:1271–6. doi: 10.1126/science.3749877. [DOI] [PubMed] [Google Scholar]
- 38.Oldehinkel AJ, Van Den Berg MD, Bouhuys AL, et al. Do depressive episodes lead to accumulation of vulnerability in the elderly? Depress Anxiety. 2003;18:67–75. doi: 10.1002/da.10116. [DOI] [PubMed] [Google Scholar]
- 39.Zetterberg C, Mannius S, Mellstrom D. Osteoporosis and back pain in the elderly: a controlled epidemiologic and radiographic study. Spine. 1990;15:783–6. [PubMed] [Google Scholar]