Abstract
Assessing the potential health risks of environmental chemical compounds is an expensive undertaking which has motivated the development of new alternatives to traditional in vivo toxicological testing. One approach is to stage the evaluation, beginning with less expensive and higher throughput in vitro testing before progressing to more definitive trials. In vitro testing can be used to generate a hypothesis about a compound's mechanism of action, which can then be used to design an appropriate in vivo experiment. Here we begin to address the question of how to design such a battery of in vitro cell-based assays by combining data from two different types of assays, cell viability and caspase activation, with the aim of elucidating mechanism of action. Because caspase activation is a transient event during apoptosis, it is not possible to design a single end-point assay protocol that would identify all instances of compound-induced caspase activation. Nevertheless, useful information about compound mechanism of action can be obtained from these assays in combination with cell viability data. Unsupervised clustering in combination with Dunn's cluster validity index is a robust method for identifying mechanisms of action without requiring any a priori knowledge about mechanisms of toxicity. The performance of this clustering method is evaluated by comparing the clustering results against literature annotations of compound mechanisms.
Keywords: cell-based assay, cell viability, caspase-3/7, apoptosis, qHTS, mechanism of action
Introduction
Of late, there has been increased effort in toxicology to develop and validate new approaches to risk assessment. The cost of performing traditional testing combined with the large increase in requests for such testing through initiatives like the REACH (1) have forced the field to consider alternative approaches to risk identification and the prioritization of testing. As part of the NTP Roadmap (2), the NTP is developing high-throughput screening (HTS) as a means to set testing priorities. The EPA, through its TOXCAST program, is developing methods for the use of computational chemistry, HTS and other new technologies to prioritize the use of limited testing resources (3). A recently published report from the National Research Council supports and gives momentum to these efforts (4). These initiatives build upon recent advances in assay technology as well as specific assays for the detection of toxicities (5-7). Here we address one aspect of this work: how best to design a battery of assays such that the integration of the results provides maximal information.
The immediate goal is to develop a science-based system that is capable of prioritizing chemicals for animal testing. These in vitro screens must be robust and decisional. Over-screening, especially with marginal screens, can lead to large opportunity costs. Quantitative HTS (qHTS) (8) as a new platform for in vitro screening can better satisfy the rigorous requirements of toxicological evaluation by providing better data quality, a measure of internal reproducibility, and immediate access to compound potency and efficacy information as compared to single-concentration screening. In particular, qHTS generates concentration-response profiles for each tested compound, reflecting the central mission/need of toxicology: to determine a compound's dose-response relationship.
New methods of compound prioritization must be validated against sets of compounds whose risks are well known. This is known as a “supervised” approach to machine learning; regression models to training data are built to help make predictions on new compounds' mechanisms of action. However, it will also be necessary to identify toxicants with potentially novel mechanisms of toxicity for further characterization. This task will require the development of unsupervised methods to identify such compounds. Here we propose one unsupervised clustering method to complement supervised methods in distinguishing known mechanisms of toxicity and identifying new ones. Moreover, we aim to quantify model confidence using Dunn's Index (9). Such an approach has previously been used in microarray research to qualify cluster quality and aid in data interpretation (10-12); here it is applied to the interpretation of HTS screening data.
Our preliminary approach to identifying mechanisms of toxicity is to characterize how compounds induce in vitro cytotoxicity across a variety of cell types. We explore combining data from an assay that measures cell viability with one that measures caspase activation to address whether compounds kill cells by caspase-induced apoptosis. Apart from this specific question, we can integrate the results of the different cytotoxicity assays to generate patterns/signatures for compounds of interest, and use these to classify these compounds into different toxicity mechanisms. Rabow et al. (13) demonstrated the utility of a similar approach using growth inhibition data; here we explore an application of clustering to data with multiple endpoints. This can help to address the question of how assays with different endpoints can be integrated to elucidate mechanism of action and how many assays need to be screened in order to uncover the maximum number of mechanisms embedded in a given set of compounds. The answers to these questions would form the basis for designing a battery of assays for in vitro toxicity screening and compound prioritization. As the reliability of any hypotheses generating model is limited by the data used to build the model, we also assess the biological relevance of these results by examining the effect of data quality on the convergence of the clustering and compare the results against literature annotations of compound mechanism of action.
Materials and Methods
Compound collection
A collection of 1353 compounds was provided by NTP (14). The compounds were dissolved in DMSO as 10 mM stock solution. There were 55 compounds represented twice in the collection, giving a total of 1408 samples for testing. The structures of these compounds are available at PubChem (15).
Compound plates with 14 concentrations ranging from 0.5 nM to 92 μM were prepared in 1536-well plate format (14). During screening, the 1536-well compound plates were stored at room temperature and sealed when not in use. The other copies of 1536-well compound plates were maintained at -80°C for long-term storage.
Cell lines and culture conditions
Human embryonic kidney cells (HEK293), human hepatocellular carcinoma cells (HepG2), human neuroblastoma cells (SH-SY5Y and SK-N-SH), human leukemia T cells (Jurkat, clone E6-1), normal human foreskin fibroblasts (BJ) from a single donor (newborn male), normal human lung fibroblasts (MRC-5) from a single donor (male; 14 weeks gestation), normal human vascular endothelial cells (HUV-EC-C), rat hepatoma cells (H4-II-E), mouse neuroblastoma cells (N2a), and mouse fibroblast cells (NIH 3T3) were purchased from the American Type Culture Collection (ATCC; Manassas, VA). Human renal mesangial cells, obtained from adult kidney tissue, were kindly provided by Dr. Jeffrey Kopp (NIDDK/NIH, Bethesda, MD). Rat renal proximal tubule cells were freshly isolated from the kidneys of six male Harlan Sprague-Dawley rats at age of 56-60 days and weight of 220-250 grams by In Vitro ADMET Laboratories, LLC (Rockville, MD). Briefly, the cortex of the rat kidneys were dissected out and minced into small (approximately 1 mm diameter) pieces. The pieces were then subjected to collagenase digestion for approximately 30 minutes, after which the digested fragments were screened with 100 μm and 50 μm mesh sieves to obtain the single cells. The cells were cultured in DMEM/F12 medium supplemented with 10% fetal calf serum and ready for use. Most of these were transformed cell lines, but some were non-transformed; the rat tubule cells were primary cells (14). The passage number for each cell line was listed in Supplementary Table 1.
Cells were cultured in ATCC complete Eagle's Minimal Essential medium (N2a, H4-II-E, SK-N-SH, MRC-5, BJ, HepG2, and HEK293), ATCC complete Dulbecco's Minimal Essential Medium (DMEM) (NIH 3T3), RPMI 1640 (Jurkat and human renal mesangial cells), or ATCC complete DMEM/F-12 (SH-SY5Y and rat renal proximal tubule cells). These media were supplemented with 10% fetal bovine serum (Invitrogen, CA), 50 U/mL penicillin and 50 μg/mL streptomycin (Invitrogen, CA). Human HUV-EC-C cells were cultured in ATCC Kaighn's F12K medium supplemented with 0.1 mg/mL heparin (Sigma, MO) and 0.04 mg/mL endothelial cell growth supplement (Sigma, MO). The cells were maintained at 37°C under a humidified atmosphere and 5% CO2.
Quantitative high-throughput screening (qHTS)
Two different types of assays are described: a cell viability assay which measures the cellular ATP concentrations after incubation with compound for 40 hours, and a caspase activity assay which measures the activation of cellular caspase 3 and caspase 7 enzymes after incubation with compound for 16 hours. Generation of the cell viability data was previously reported (Xia et al. 2007). Additional data were generated for this paper using the previous cell viability protocol but reducing compound incubation time to the 16 hours used for the caspase 3/7 assay.
Caspase-3/7 activity was measured using a homogeneous luminescent method (Caspase-Glo® 3/7 Assay, Promega, Madison, WI). In this assay, caspase-3/7 induced by cells cleaves luminogenic substrate containing thetetrapeptide sequence asp-glu-val-asp. This reaction liberates free aminoluciferin which can be used as a substrate by luciferase to generate light. The luminescent signal is proportional to the amount of caspase activity present in the cells (Riss and Moravec, 2004). Cells were dispensed at 1000-2000 cells/5μL/well in tissue culture treated 1536-well white/solid bottom assay plates (Greiner Bio-One North America, NC) using a Flying Reagent Dispenser (Aurora Discovery, CA). All but Jurkat cells (which are grown in suspension) were incubated at 37°C for 5-6 hours to allow for cell attachment, followed by addition of compounds via pin tool (Kalypsys). After compound addition, plates were incubated for 16 hours at 37°C; incubation duration was based on the results of assay optimization experiments demonstrating that the total number of active compounds from the set of 1353 tested was larger at this incubation time than at other time points (data not shown). At the end of the incubation period, 5 μL of Caspase-Glo® 3/7 reagent was added, plates were incubated at room temperature for 1 hr, and luminescence intensity determined using a ViewLux plate reader (PerkinElmer; Shelton, CT).
Compound formatting and qHTS were performed as described previously (14). Staurosporine and tamoxifen were used as a positive control in the caspase-3/7 assays and compounds were dispensed on each plate: tamoxifen in concentration series from 0.23 to 100 μM in DMSO in column 1, and staurosporine in concentration series from1.4 pM to 20 μM in DMSO in column 2. Also, DMSO was present in column 3, and tamoxifen at 100 μM or staurosporine at 20 μM was present in column 4. The final concentration of DMSO in the assay was 0.45% (or 0.90% in wells where compound was transferred twice).
After the cells were dispensed into 1536-well plate and incubated for 5-6 hr, 23 nL of compounds was transferred into the wells using pin tool, resulting in final concentrations of 0.5 nM to 46 μM of compound, and 0.45% DMSO. To achieve the highest final compound concentration of 92 μM (DMSO concentration 0.9%), 23 nL of compounds was transferred twice from the highest concentration mother plate into each well of the assay plate; control plates using DMSO only at this highest concentration were also included.
Data analysis
Analysis of compound concentration-response data was performed as previously described (8). Briefly, raw plate reads for each titration point were first normalized relative to the positive control compound (100%) (Supplementary Table 1) and DMSO-only wells (basal, 0%), and then corrected by applying a pattern correction algorithm using compound-free control plates (i.e., DMSO-only plates) at the beginning and end of the compound plate stack. Concentration-response titration points for each compound were fitted to the Hill equation (16). Compounds were designated as Class 1-4 according to the type of concentration-response curve observed (8). Curve classes are heuristic measures of data confidence, classifying concentration-responses based on efficacy, number of data points showing above background activity, and the quality of fit. Fitting of experimental data to the Hill equation was amended for the caspase assay; concentrations greater than the concentration of maximal response where masked for regression purposes. Efficacies in the caspase assay were calculated relative to control, which was observed to vary between cell types and experimental replicates, likely due to the bell-shaped nature of the concentration-response curve. It is possible then that compound efficacies relative to the maximal caspase activation induced by staurosporine or tamoxifen were overestimated; however, only EC50 values (i.e. the concentration that induces one-half maximal response) are used in the subsequent analyses and this effect should not affect the clustering results. Hierarchical clustering of compound activity patterns across different assays was performed within Spotfire DecisionSite 8.2 (Spotfire Inc., Cambridge, MA, USA) using the correlation of LogEC50 or LogIC50 values as the similarity metric. All the normalized caspase data obtained for the 1408 compounds tested in the 13 cell types have been deposited into PubChem (search term “NCGC [sourcename] AND caspase [AssayName]”) (15).
Compounds were clustered by activity profile to identify common modes of action (MOA) (17). It was assumed that different clusters represent different MOAs, and that compounds which cluster together elicit similar responses across the assays because they operate through a mode of action that affects the same sequence of key cellular and biochemical events. In general, the more diverse the compound responses are across assays, the more MOAs are potentially embedded in the data. While the goal of the clustering is to generate a hypothesis about a compound's specific mechanism of action, the broad nature of these cytotoxicity assays likely prevents any detailed understanding of the molecular basis of the toxic effect; the inclusion of or confirmation of activity in other, more mechanistic assays would obviously improve this aspect of the current study. Data vectors of length 26 were formed using the LogEC50 or LogIC50 values of compounds in all the caspase and viability assays. The maximum concentration (92 μM) was used as a substitute value for every compound that was class 4 in an assay. Data vectors were then Z-score normalized and filtered such that only compounds that were class 1-3 in at least three assays were included in the final data matrix. Compound response patterns were clustered using the K-means algorithm, and the total cluster number was varied to maximize Dunn's Index (νD) (9). Dunn's Index assesses cluster quality by quantifying a type of internal consistency, comparing the variation in response within a cluster to variations between clusters. Dunn's Index was calculated according to Equation (1), where C denotes a data vector, δ(Ci, Cj) is the distance (Euclidean distance in this study) between a vector in cluster i and a vector in cluster j, Δ(Ck) is the distance between two data vectors in cluster k, and K is the total number of clusters. Dunn's Index (νD) is then the ratio of the minimum distance between two vectors from two different clusters over the maximum distance between two vectors within the same cluster. Larger values of νD correspond to good clusters, and the number of clusters that maximizes νD is taken as the optimal number of clusters. Together, K-means and Dunn's Index can be used to generate an activity clustering without any prior assumptions about types of activities expected to be observed, and this approach should be useful for the preliminary assessments of toxicity where the mode of toxicity is not known in advance and may even be novel.
| (1) |
To assess the redundancy of assays and select an optimal panel of assays from the 26 assays, clustering was additionally performed on subsets containing 3 to 25 of the 26 assays. For each subset, assays were randomly selected from the pool of all 26 assays, and compounds were clustered using only data in the selected assays. The number of clusters was enumerated from 2 to 100 and the number that maximized the Dunn's Index was kept as the final cluster count. This procedure was repeated 10,000 times for each assay count. To study whether clustering produced biologically meaningful results, MeSH pharmacological action terms (18) were tested using a Fisher's exact test to assess the enrichment of each term in a cluster. MeSH pharmacological action terms use MeSH's standardized ontology for biology to annotate compound entries. MeSH pharmacological actions are available for 541 of the 1355 compounds (Supplementary Table 2).
Results and Discussion
Assay validation and qHTS QC
Data quality is probably the most important factor influencing the accuracy of any computational toxicity prediction. While every effort is made to ensure data quality, some assay formats are inherently less robust than others. This does not mean that these assays cannot provide useful information that complements other assays, but care must be taken when interpreting data generated from them. This is especially true when comparing caspase activation assays to the cell viability assays. The latter produces excellent data quality statistics (signal/background ratios, Z's, CVs) and works well even in single-concentration format (14). The former requires qHTS - rigorous replication conditions and the elucidation of the full concentration-response curve.
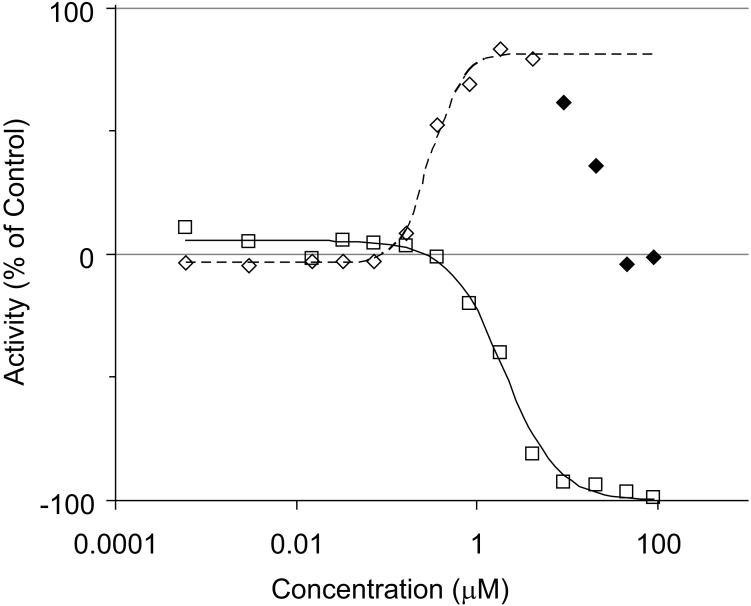
Caspase-3/7 plays an important role as an executioner in the apoptotic cascade (19). Caspase-3/7 activation occurs in the terminal apoptosis cascade before cells die (20). The time from initiation of apoptosis to its completion can be variable and sometimes as short as a few hours. Caspase activity disappears after cell death occurs as proteins begin to degrade in the milieu. Activation is therefore transient, which made selecting a compound incubation time challenging because selecting the wrong incubation time can result in false negative findings (20). Additionally, differences in compound concentration also affect the time course of caspase activation. This can be seen with many compounds in these caspase-3/7 assays, where caspase activation peaks over a small range of compound concentration (see Figure 1 for an example compound curve). Most cell types demonstrated good Z' factors (10 of 13 had Z'>0.5), and all the assays had reasonable S/B ratios (S/B≥2 for all 13 assays). Though Z' factors and/or signal to background ratios for some assays were less than ideal for conventional screening (see Supplementary Table 1), we were able to utilize the data on all assays, since qHTS generates EC50 values on all compounds. Unlike efficacy calculations, EC50 values are unaffected by these parameters, and only EC50 values were used in the subsequent analysis.
Figure 1.
A typical concentration-response for caspase activation (◊) and cell viability (□). Note the decrease in caspase activation at higher concentrations. The data shown is for hexachloropentadiene in the Jurkat human leukemia T cell line. Activity is shown as a percentage of control: -100% connotes complete cell killing, +100% connotes caspase activation equivalent to tamoxifen. Solid diamonds indicate that this data was not used for curve fitting purposes.
The percentage of compounds with a class 1a, 1b or 2a concentration-response (8) ranged from 0.4% to 3.5% (1.5% to 9.7% for class 1-3) for the 13 caspase assays, with HUV-EC-C showing the lowest sensitivity and Jurkat the highest (Supplementary Figure 1(a)). The overall active rate for the caspase assays is significantly lower than that of the cell viability assays, which ranged from 4-11% for class 1a, 1b and 2a compounds (7-20% for class 1-3). Most cell types displayed a wide range of compound potencies from <100 nM to >10 μM, except for HUV-EC-C, which did not have any compounds with EC50 <10 μM (Supplementary Figure 1(b)). Other cell types including the two human fibroblasts MRC-5 and BJ, and the human kidney cells HEK293, also showed low sensitivity with no compound having an EC50 <1 μM. Overall, the primary or normal cells (BJ, MRC-5, HUV-EC-C, mesangial cell, rat kidney proximal tubules) appeared to be less sensitive in terms of caspase activation than the immortal (NIH 3T3) or transformed (Jurkat, SK-N-SH, SH-SY5Y, HEK293, HepG2, H-4-II-E, N2a) cells.
The EC50 values for the 55 compounds represented in duplicate in the 1408 collection were compared in all 13 caspase assays, yielding a satisfactory Pearson correlation coefficient (r2) of 0.78. As another measure of assay reproducibility, qHTS on the 1408 compounds was performed four times in H-4-II-E cells, with all four replicates performed on different days. The correlation of EC50 values between the four experiments range from r2 = 0.87 to 0.52.
Comparison of viability and caspase-3/7 assays
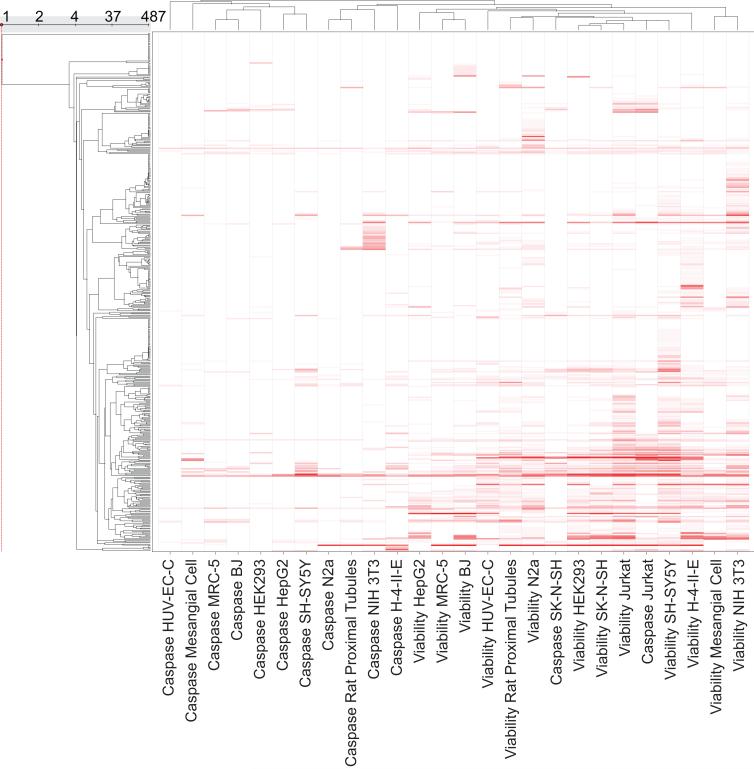
When comparing the results from the two assay platforms, caspase and viability, one has to keep in mind the difference in the measured time points. Cells were incubated with compound for 40 hours in the viability assays, but for only 16 hours in the caspase-3/7 assays. For the purpose of assessing the impact of time on assay outcome, one cell type, HEK293, was additionally screened with the 1408 collection in the viability assay at 16 hr. The viability assay of HEK293 cells at 40 hr. clearly produced more active compounds (5.8% class 1a, 1b, 2a; 11.9% class 1-3); however, the viability of HEK293 cells at 16 hr. still had more actives (2.6% class 1a, 1b, 2a; 6.7% class 1-3) than its corresponding caspase assay (1.3% class 1a, 1b, 2a; 4.3% class 1-3). These results show that the caspase assays do not simply measure cell death, but a particular aspect of cell death. To further determine if there are intrinsic differences between the viability assays and the caspase assays, a heat map was generated hierarchically clustering the 26 caspase and viability assays on the similarity of their EC50/IC50 response patterns (Figure 2). The caspase assays tend to cluster together with themselves as do the viability assays, again indicating that the assays provide different types of information from one another.
Figure 2.
Hierarchical clustering of all caspase and viability assays based on similarity in the compound EC50/IC50 patterns. Caspase assay data and cell viability data generally cluster by assay type. The exception is the Jurkat cell line, where both assay types cluster together.
A notable exception to this was the Jurkat cell type, where both the caspase and viability assays clustered together. In this experiment, Jurkat cells had the highest sensitivity in the caspase assay, had the largest correlation coefficient (r2=0.68) among all the cell types between its caspase activation EC50 and its viability IC50, and was the only cell type with its two different assay readouts (caspase and viability) clustered together by hierarchical clustering. Unlike the other cells types, Jurkat cells appear to uniformly go through caspase activation on the way to cell death. The only exceptions to this rule were the thiol-containing purines, disulfides and mercurial compounds; however, their inactivity in the caspase assay is likely due to their ability to directly interfere with the caspase activation assay (21).
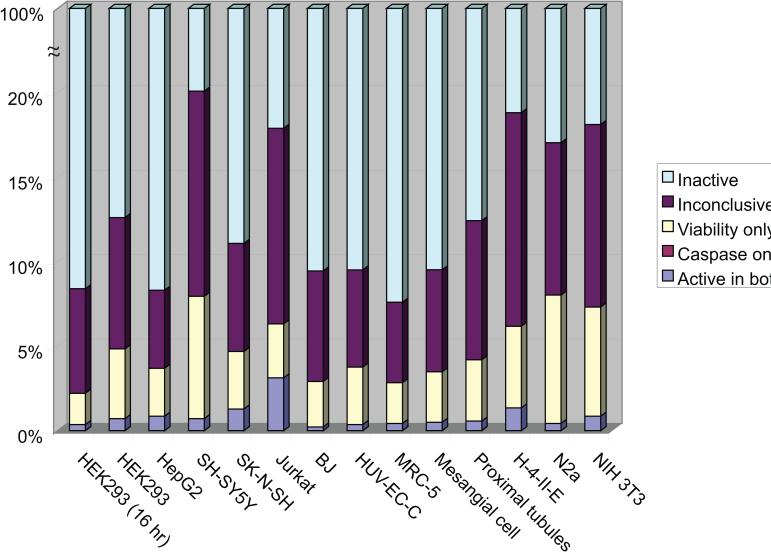
For each cell type, compounds were assigned one of five activity categories based on their activity outcome in each caspase-3/7 assay compared to its viability counterpart: “active in both” (class 1a, 1b or 2a in both caspase and viability assays), “caspase only” (class 1a, 1b or 2a in caspase and class 4 in the corresponding viability assay), “viability only” (class 1a, 1b or 2a in viability and class 4 in the corresponding caspase assay), “inactive” (class 4 in both caspase and viability assays), and “inconclusive” (all other possible outcomes). The distribution of compounds in these five categories for each cell type is shown in Figure 3. Jurkat showed by far the best consistency between its caspase and viability activity (49% active in both), as compared to SK-N-SH, the second most consistent cell type, which had only 27% of its actives active in both. The least consistent cell type was N2a, which had only 5% of its actives active in both the caspase and viability assays. Strong consistency between assays implies that cytotoxic compounds uniformly induce caspase activation, as is the case with Jurkat cells. Conversely, a low consistency found for a cell type indicates that compounds cause toxicity through other mechanisms in addition to caspase activation. These differential activity patterns found across cell types form the basis for distinguishing different modes of action.
Figure 3.
Activity distributions of the set of 1408 compounds in the 13 different cell types in terms of their caspase activity as compared to their activity in the corresponding viability assays. The number of compounds active in both caspase activation and cell viability is a small subset of the total number of active compounds. Many compounds exhibit activity only in the cell viability assay.
There were 58 compounds that were classified as “viability only” in at least 5 cell types. In addition to the possibility that these compounds simply do not induce apoptosis, this lack of caspase activation by clearly cytotoxic compounds was further investigated to explore other mechanistic possibilities. A functional group analysis of these compounds (Leadscope) showed that some chemical groups were significantly enriched in this set. These include the three thiol containing compounds (6-mercaptopurine monohydrate, Azathioprine, 6-thioguanine (6-TG)), three mercuric compounds (phenyl mercuric acetate, mercuric chloride, methyl mercuric (II) chloride), disulfides (tetramethylthiuram disulfide and 2-octyl-3-isothiazolone 6-Hydroxy-2-naphthyl disulfide (DDD)) and other sulfur containing compounds such as zinc pyrithione, methylene bis(thiocyanate), Captan and Captan 90-concentrate (solid). These compounds have the potential to directly react with caspase active-site cysteine thus directly preventing caspase activation. Tetramethylthiuram disulfide is known to inhibit apoptosis by directly inhibiting the processing of the caspase-3 proenzyme (22). Analysis of the compounds that are “viability only” in at least 3 cell types in terms of their pharmacological action (18) revealed that this set of compounds is significantly enriched in cytostatic compounds. These include cancer agents such as adriamycin hydrochloride, colchicine, 5-fluorouracil, etc. Digitonin was “viability only” in 12 of the 13 cell types and is a detergent that is known to disrupt membranes (23). Another example of a true “viability only” compound is α-Solanine, which had class 1a (mostly) or 2a curves (IC50 >10 μM) in all viability assays and was class 4 in all caspase assays. This compound is known to inhibit cholinesterases (24) and to disrupt membranes (25). Thus, when interpreting these results, reasons for negative findings other than the compound not activating the caspases, e.g. inducing apoptosis, must be kept in mind, and include: (1) compounds that directly inhibit the caspase (e.g., tetramethylthiuram disulfide); (2) compounds that are cytostatic (e.g., 5-fluorouracil); and (3) compounds that produce caspase activation outside the time window of the assay (e.g., N,N'-Di-sec-butyl-p-phenylenediamine).
Diversity in compound response space and mode of action
The previous analysis demonstrates how compounds with different modes of action can be identified based on comparisons of their activity in caspase activation and cell viability assays. Next we generalize this approach by correlating mode of action with activity differences across larger sets of assays and address the question of how best to design such a battery of in vitro cell-based assays for this purpose. Unsupervised clustering in combination with Dunn's cluster validity index is useful in identifying modes of action while avoiding spurious associations suggested by noisy assay data and without requiring any a priori knowledge about mechanisms of toxicity. The resulting clusters each suggest a different action, and the total number of clusters can be taken as a measure of the combined information content of the assay battery.
It has previously been shown that clustering compounds by their activity across a panel of cellular growth inhibition assays can provide hypotheses about mode of action, even though the assays were never designed to provide such specific information (13). This example can serve as a principle for toxicity testing, that the whole may be greater than the sum of the parts. Here, we attempt such clustering with data from the set of 26 viability and caspase assays to identify modes of action, but with the added advantage of quantifying the confidence of the cluster hypotheses using K-means in combination with Dunn's Index (9), a measure of cluster validity. With this approach we address whether additional assays always add information and thus help reveal more mechanisms, and how many assays need to be screened to reveal the maximum number of mechanisms embedded in a set of compounds.
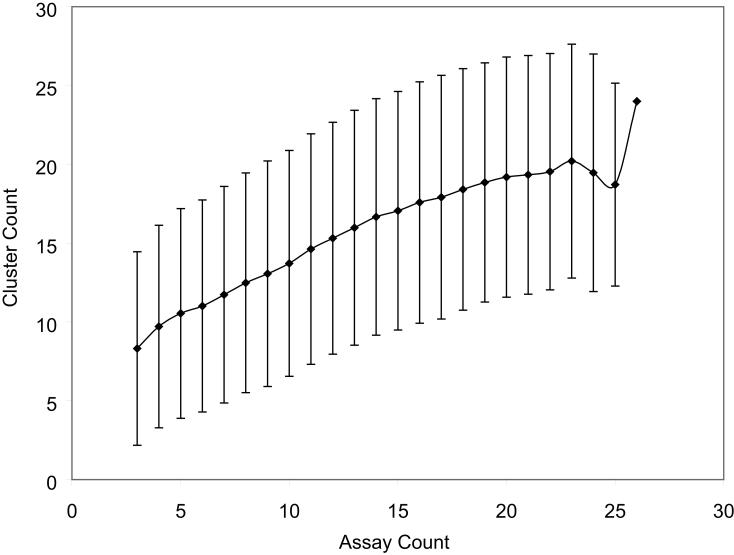
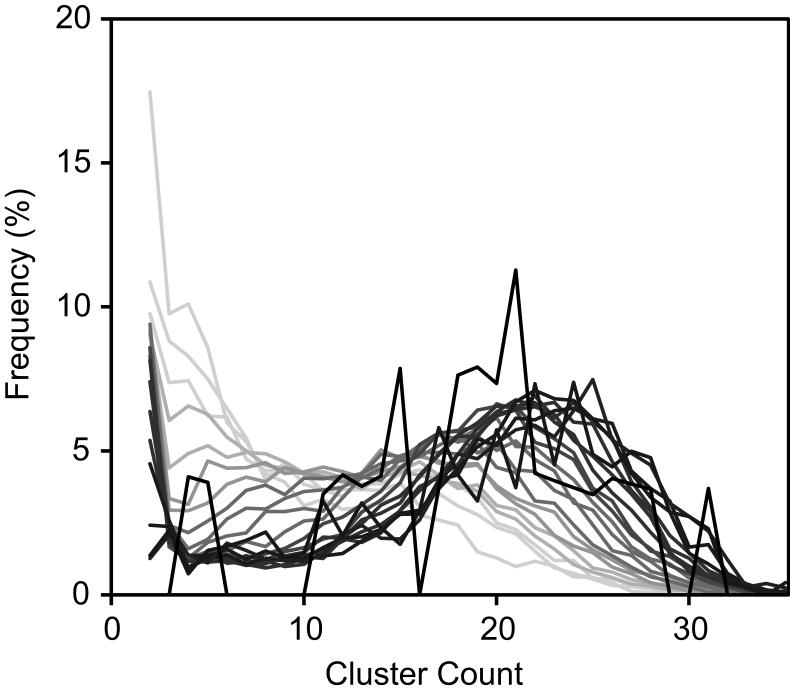
Our assumption is that each distinct cluster of compound response patterns represents one class, or a group of related MOAs; the more diverse the compound response patterns are, the more MOA classes may be embedded or reflected by the data. For each possible panel of assays, the K-means algorithm was used to cluster the compound response patterns in different assays and the Dunn's Index was calculated to assess the cluster quality. For each panel size, a subset of assays was randomly selected from the pool of all 26 assays, and compounds were clustered using only data in the selected assays. The mean and standard deviation of cluster count is plotted as a function of assay count in Figure 4(a) and the full distribution of the cluster count as a function of assay count is plotted in Figure 4(b). As opposed to other clustering methods, especially hierarchical clustering, this method identifies which grouping of compounds is the most meaningful by maximizing a measure of cluster internal consistency. Other methods require either the user to specify the expected number of clusters in advance or just leave it to the end user to guess about the significance of distant relationships as in the case of hierarchical clustering.
Figure 4.
Number of compound mechanisms (clusters) revealed as a function of number of assays screened. Assays were selected from the pool of all caspase and viability assays. (a) As more assays are utilized for clustering, the average number of clusters identified increases. (b) A plot of the distribution of cluster number as a function of the number of assays shows the gradual convergence near 24 clusters as the number of assays increases (line color becomes darker).
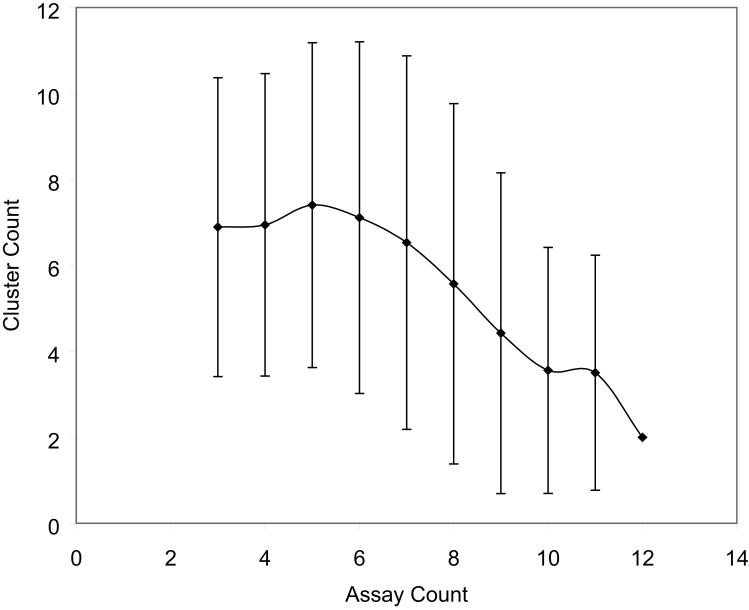
The number of clusters increases when more assays are used in the clustering, which indicates that more assays add to the data diversity or information content. To determine if the increase in cluster number was due to true activity differences among assay cell types and endpoints rather than chance experimental variances, three cell types (NIH 3T3, H-4-II-E and BJ) were tested in the caspase-3/7 assay four times. The data generated from this set of 4×3=12 assays was then used for cluster generation. The results are shown in Figure 5. No increase, but rather a small decrease, in the number of clusters was observed when more assays were included in the clustering. These results show that simply adding replicate datasets does not add to the information content of the panel, and that the clustering results should be resistant to typical experimental variances. That the number of clusters was not static, but decreased, was unexpected and may reflect variability in the replicate experiments obscuring the real differences between cell types when more replicate assay data were included in the analysis. In contrast, the previous gain in information content was derived from the new activities provided by the additional assays and we have observed that for both viability and caspase activation assays.
Figure 5.
Number of compound mechanisms revealed as a function of number of assays screened: effect of noise in data. Assays were selected from the pool of three caspase assays, NIH 3T3, H-4-II-E and BJ, each run in quadruplets. Merely providing more replicates of the same experiment does not increase the number of clusters identified.
Clustering performance was also assessed by comparison with literature annotations of mechanism of action. MeSH annotations were found for 541 compounds from the 1408 compound collection. The EC50/IC50 patterns for these compounds across all caspase and viability assays were clustered (Supplementary Table 3) and the enrichment of the MeSH terms associated with these compounds in each cluster was determined through a Fisher's exact test. MeSH terms indicating specific pharmacological actions were found significantly enriched in individual clusters. For example, antineoplastic antimetabolites were enriched in Cluster 22, hormones and antagonists in Cluster 17, and cytostatics in Cluster 16; the latter included the alkylating agents chlorambucil and melphalan, the DNA intercalator daunomycin, and actinomycin D, which binds to DNA to prevent transcription. In addition, Cluster 16 was found to be significantly enriched with compounds that scored positive in the NTP micronucleus assay (26) based on a Fisher's exact test (p<0.05), or in micronucleus assays reported in the literature (e.g., (27)). Interestingly, based on its being in Cluster 16, colchicine might reasonably be expected to possess micronucleus activity even though no such activity was reported in the NTP database. A search of the literature determined that colchicine, in fact, is known to be a micronucleus inducer (28, 29). Another cluster, Cluster 4, was significantly enriched in estrogens and estrogen mimetics, including ethinyl estradiol, diethylstilbestrol, bisphenol A, methoxyclor, and aldrin (30). Supporting the biological relevance of this cluster, as well as the general notion that caspase and viability assays may assess an aspect of estrogenic activity, apoptotic and estrogenic activities have been reported to be related in Jurkat cells (31, 32).
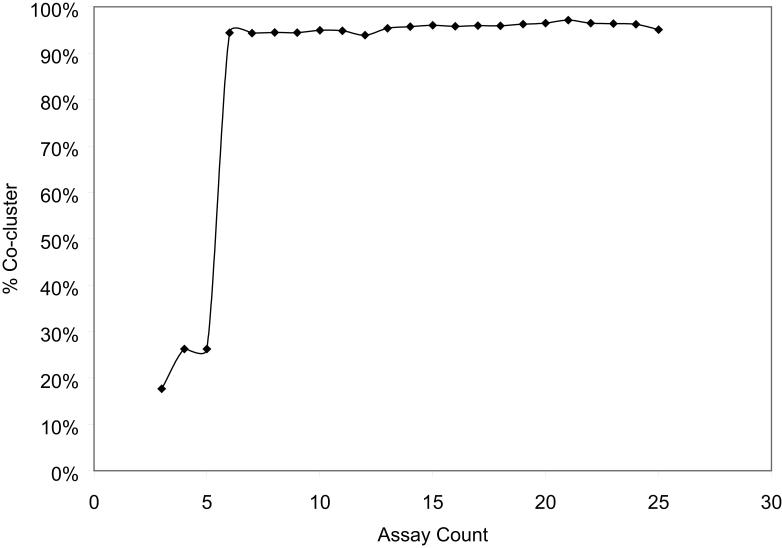
We next examined the clustering quality using fifteen assays selected randomly from the pool of 26 assays to determine whether the same results can be obtained using a smaller panel of assays. Each new clustering result was compared to the clustering using all 26 assays by counting the number of compound pairs that continue to be clustered together in both cases. The average co-cluster rate (defined as the sum of compound pairs that clustered together in both cases and those that did not cluster together in either case, divided by the total number of unique compound pairs) for the clustering result sets was 94-95%, indicating that the clustering results were very stable, i.e. the same limited set of MOAs were identified. In fact, it is possible to choose a set of six assays that have a co-cluster rate of 94%; that is, 94% of the time the compounds clustered together by the 26 assays were clustered by these six assays as well (Figure 6). To do this, Dunn's Index was used to select an optimal subset of assays, which yields not only in the most internally consistent result, but also one that is most similar to the clustering result using all 26 assays. Antineoplastic antimetabolite and cytostatic clusters were still consistent; however, other mechanisms including the cluster of estrogen mimetics were not. While reducing the panel of 26 assays to 6 is a drastic measure, it nevertheless demonstrates the robustness of the clustering which Dunn's Index measures, and suggests that a relatively small number of assay datasets may be used as a proxy for a larger panel.
Figure 6.
Co-cluster rate of clusters generated using various number of assays with clusters generated using all 26 caspase activation and viability assays as a function of number of assays screened. The clusters generated using ≥6 assays are ~95% similar to clusters generated using all 26 assays.
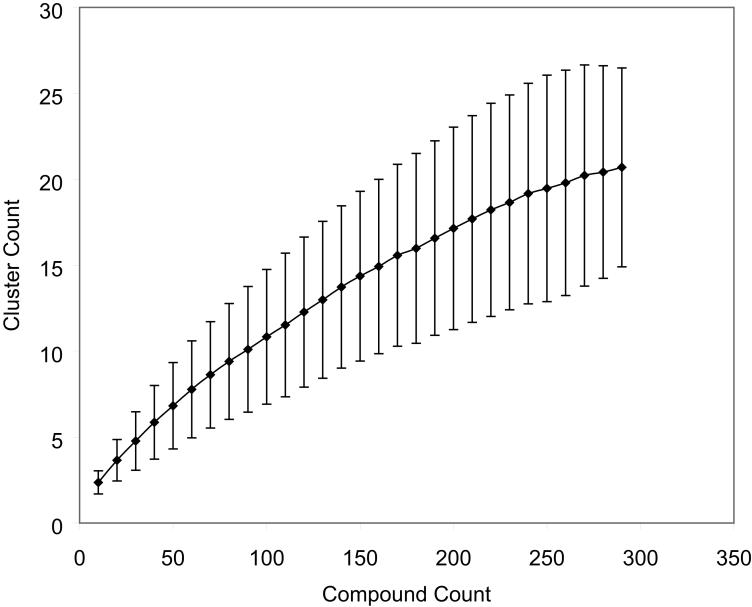
An alternate question is whether the calculated information content is limited by the choice of compounds tested. To test this, the same clustering exercise was carried out using a fixed number of assays (all caspase and viability assays were used) and compounds randomly selected from a pool of 293 compounds that were Class 1-3 in at least three of the 26 assays. The number of clusters generated that gave the optimum Dunn's Index was plotted as a function of the number of compounds employed in the clustering. Compound sets were randomly selected and clustered 10,000 times for each compound set size. As shown in Figure 7, the number of clusters seemed to plateau when the number of compounds used approached 250; the maximum number of modes covered by those compounds was always less than 30. It is important to note that screening additional compounds or a more diverse set of compounds would still likely reveal more modes, if the additional compounds act via modes that are distinct from the existing set of compounds. Cluster integrity would also likely improve with any increase in the number of compounds tested.
Figure 7.
Number of compound mechanisms covered as a function of number of compounds screened. All caspase and viability assays were used in the clustering. Compounds were selected from a pool of 293 compounds that were class 1-3 in at least three of the 26 assays. It appears that the identification of compound mechanisms is limited by the number of compounds in the present experiment; more compounds would likely help differentiate additional mechanisms.
For regulatory decision-making, tools are required to be validated for performance against known compounds, both toxic and non-toxic. However, tools that do not rely upon a priori information, such as unsupervised clustering driven by Dunn's Index, complement formally validated approaches, particularly during the hypothesis generation stage of toxicological assessment, when the possibility of a novel mode of action must be considered.
Finally, it is important to stress that while this approach appears promising, data on many more compounds, assays, and conditions are needed to explore fully the potential of this approach. The inclusion of other assays and compounds will most likely expand the types of activities that can be reliably detected. Certainly, stronger associations between in vivo toxicities and in vitro patterns or signatures remain to be established. This is beyond the scope of the present work, and is the goal of the larger NTP, EPA, and REACH initiatives. Nevertheless, the results presented here suggest that computational methods using robust HTS data can provide useful and biologically meaningful contributions to in vitro toxicological assessment. In particular, a simple battery of cytotoxicity assays was shown useful to distinguish compounds with very different activities, such as those inducing micronuclei formation and those behaving as estrogen mimetics.
Conclusions
Caspase activation is a transient event during apoptosis, and as such, it is not possible to design a single time-point assay protocol that would identify all instances of compound-induced caspase activation. Nevertheless, useful information about compound mechanism of action can be obtained from high-throughput screening of these assays in combination with viability data. In particular, K-means clustering with Dunn's Index produces robust clusters that reflect connections between compound mechanisms of action. The caspase assay data complements the viability data, and this is shown both by the lack of concordance between the assays as well as by clustering. Clusters are biologically meaningful as shown by comparing to MeSH and current literature. Moreover, cluster number is robust to typical experimental variances as shown using replicate data, and by varying the numbers of assays and compounds used to generate the clusters. The information content of a panel of such assays is taken to be proportional to the number of clusters identified, but this measure also depends on the set of assays/compounds used to evaluate the method. This approach should be useful for generating hypotheses about compound mechanism of action, which can then be used to initiate further toxicological evaluation.
Supplementary Material
Acknowledgment
This research was supported by the Intramural Research Program of the National Toxicology Program, National Institute of Environmental Health Sciences and the National Human Genome Research Institute, National Institutes of Health. The authors would like to thank in particular Dr. Raymond Tice and Kristine Witt from the National Toxicology Program for helpful feedback during the development of this project.
This research was supported by the Intramural Research Program of the National Toxicology Program, National Institute of Environmental Health Sciences and the National Human Genome Research Institute, National Institutes of Health.
Footnotes
Supporting Information Available Information is available for the assay performance as measured by plate QC statistics and positive control behavior for all 13 caspase-3/7 assays, the cluster membership for the set of 293 compounds clustered against 26 assays, caspase activation and cell viability in 13 cell types, and the activity and potency distributions of the set of 1408 compounds in the 13 caspase activation assays. This material is available free of charge via the Internet at http://pubs.acs.org.
References
- (1).Hogue C. EU Parliament Committee Beefs Up REACH. Chem. Eng. News. 2006 Online. [Google Scholar]
- (2).NTP . NTP, A National Toxicology Program for the 21st Century: A roadmap to achieve the NTP vision. National Toxicology Program / National Institute of Environmental Health Sciences; Research Triangle Park, NC: 2004. [Google Scholar]
- (3).Dix DJ, Houck KA, Martin MT, Richard AM, Setzer RW, Kavlock RJ. The ToxCast program for prioritizing toxicity testing of environmental chemicals. Toxicol. Sci. 2007;95:5–12. doi: 10.1093/toxsci/kfl103. [DOI] [PubMed] [Google Scholar]
- (4).NRC . A Vision for Toxicity Testing in the 21st Century. The National Academies Press; Washington, DC: 2007. [Google Scholar]
- (5).O'Brien P,J, Irwin W, Diaz D, Howard-Cofield E, Krejsa CM, Slaughter MR, Gao B, Kaludercic N, Angeline A, Bernardi P, Brain P, Hougham C. High concordance of drug-induced human hepatotoxicity with in vitro cytotoxicity measured in a novel cell-based model using high content screening. Arch. Toxicol. 2006;80:580–604. doi: 10.1007/s00204-006-0091-3. [DOI] [PubMed] [Google Scholar]
- (6).O'Brien PJ, Siraki AG. Accelerated cytotoxicity mechanism screening using drug metabolising enzyme modulators. Curr. Drug Metab. 2005;6:101–109. doi: 10.2174/1389200053586082. [DOI] [PubMed] [Google Scholar]
- (7).Pohjala L, Tammela P, Samanta SK, Yli-Kauhaluoma J, Vuorela P. Assessing the data quality in predictive toxicology using a panel of cell lines and cytotoxicity assays. Anal. Biochem. 2007;362:221–228. doi: 10.1016/j.ab.2006.12.038. [DOI] [PubMed] [Google Scholar]
- (8).Inglese J, Auld DS, Jadhav A, Johnson RL, Simeonov A, Yasgar A, Zheng W, Austin CP. Quantitative high-throughput screening: a titration-based approach that efficiently identifies biological activities in large chemical libraries. Proc. Natl. Acad. Sci. U S A. 2006;103:11473–11478. doi: 10.1073/pnas.0604348103. [DOI] [PMC free article] [PubMed] [Google Scholar]
- (9).Bezdek J, Pal NR. Some new indexes of cluster validity. IEEE Trans. Syst. Man Cybern. B. 1998;28:301–315. doi: 10.1109/3477.678624. [DOI] [PubMed] [Google Scholar]
- (10).Azuaje F. Integrative data analysis for functional prediction: a multi-objective optimization approach. Bioinformatics. 2005;21:2099–2100. doi: 10.1093/bioinformatics/bti272. [DOI] [PubMed] [Google Scholar]
- (11).Bolshakova N, Azuaje F, Cunningham P. An integrated tool for microarray data clustering and cluster validity assessment. Bioinformatics. 2005;21:451–455. doi: 10.1093/bioinformatics/bti190. [DOI] [PubMed] [Google Scholar]
- (12).Loganantharaj R, Cheepala S, Clifford J. Metric for Measuring the Effectiveness of Clustering of DNA Microarray Expression. BMC Bioinformatics. 2006;7Suppl 2:S5. doi: 10.1186/1471-2105-7-S2-S5. [DOI] [PMC free article] [PubMed] [Google Scholar]
- (13).Rabow AA, Shoemaker RH, Sausville EA, Covell DG. Mining the National Cancer Institute's tumor-screening database: identification of compounds with similar cellular activities. J. Med. Chem. 2002;45:818–840. doi: 10.1021/jm010385b. [DOI] [PubMed] [Google Scholar]
- (14).Xia M, Huang R,L,WK, Southall N, Fostel J, Cho M, Jadhav A, Smith CS, Inglese J, Portier CJ, Tice RR, Austin CP. Compound Cytotoxicity Profiling Using Quantitative High-Throughput Screening. Environ. Health Perspect. 2007 doi: 10.1289/ehp.10727. in press. doi:10.1289/ehp.10727. [DOI] [PMC free article] [PubMed] [Google Scholar]
- (15).PubChem http://pubchem.ncbi.nlm.nih.gov/ Search for NTPHTS_NCGC under PubChem Substance.
- (16).Hill AV. The possible effects of the aggregation of the molecules of haemoglobin on its dissociation curves. J. Physiol. (London) 1910;40:4–7. [Google Scholar]
- (17).Seed J, Carney EW, Corley RA, Crofton KM, DeSesso JM, Foster PMD, Kavlock R, Kimmel G, Klaunig J, Meek ME, Preston RJ, Slikker W, Tabacova S, Williams GM, Wiltse J, Zoeller RT, Fenner-Crisp P, Patton DE. Overview: Using Mode of Action and Life Stage Information to Evaluate the Human Relevance of Animal Toxicity Data. Critical Reviews in Toxicology. 2005;35:663–672. doi: 10.1080/10408440591007133. [DOI] [PubMed] [Google Scholar]
- (18).NLM Medical Subject Headings. http://www.nlm.nih.gov/mesh/meshhome.html. [Accessed November 2007]
- (19).Boatright KM, Salvesen GS. Caspase activation. Biochem. Soc. Symp. 2003:233–242. doi: 10.1042/bss0700233. [DOI] [PubMed] [Google Scholar]
- (20).Watanabe M, Hitomi M, van der Wee K, Rothenberg F, Fisher SA, Zucker R, Svoboda KK, Goldsmith EC, Heiskanen KM, Nieminen AL. The pros and cons of apoptosis assays for use in the study of cells, tissues, and organs. Microsc. Microanal. 2002;8:375–391. doi: 10.1017/S1431927602010346. [DOI] [PubMed] [Google Scholar]
- (21).McCabe MJ, Jr., Eckles KG, Langdon M, Clarkson TW, Whitekus MJ, Rosenspire AJ. Attenuation of CD95-induced apoptosis by inorganic mercury: caspase-3 is not a direct target of low levels of Hg2+ Toxicol. Lett. 2005;155:161–170. doi: 10.1016/j.toxlet.2004.09.013. [DOI] [PubMed] [Google Scholar]
- (22).Nobel CSI, Burgess DH, Zhivotovsky B, Burkitt MJ, Orrenius S, Slater AFG. Mechanism of Dithiocarbamate Inhibition of Apoptosis: Thiol Oxidation by Dithiocarbamate Disulfides Directly Inhibits Processing of the Caspase-3 Proenzyme. Chemical Research in Toxicology. 1997;10:636–643. doi: 10.1021/tx970006a. [DOI] [PubMed] [Google Scholar]
- (23).Jekunen AP, Shalinsky DR, Hom DK, Albright KD, Heath D, Howell SB. Modulation of cisplatin cytotoxicity by permeabilization of the plasma membrane by digitonin in vitro. Biochem. Pharmacol. 1993;45:2079–2085. doi: 10.1016/0006-2952(93)90019-s. [DOI] [PubMed] [Google Scholar]
- (24).Benilova IV, Arkhypova VN, Dzyadevych SV, Jaffrezic-Renault N, Martelet C, Soldatkin AP. Kinetics of human and horse sera cholinesterases inhibition with solanaceous glycoalkaloids: Study by potentiometric biosensor. Pesticide Biochemistry and Physiology. 2006;86:203–210. [Google Scholar]
- (25).Roddick JG, Weissenberg M, Leonard AL. Membrane disruption and enzyme inhibition by naturally-occurring and modified chacotriose-containing Solanum steroidal glycoalkaloids. Phytochemistry. 2001;56:603–610. doi: 10.1016/s0031-9422(00)00420-9. [DOI] [PubMed] [Google Scholar]
- (26).NTP Description of NTP Study Types: Micronucleus. http://ntp.niehs.nih.gov/ntpweb/index.cfm?objectid=16D65516-BA99-8D3EBEFF712372F4B675. [Accessed November, 2007]
- (27).Yaghi BM, Turner PM, Denny WA, Turner PR, O'Connor CJ, Ferguson LR. Comparative mutational spectra of the nitrogen mustard chlorambucil and its half-mustard analogue in Chinese hamster AS52 cells. Mutat. Res. 1998;401:153–164. doi: 10.1016/s0027-5107(98)00005-0. [DOI] [PubMed] [Google Scholar]
- (28).Caperta AD, Delgado M, Ressurreicao F, Meister A, Jones RN, Viegas W, Houben A. Colchicine-induced polyploidization depends on tubulin polymerization in c-metaphase cells. Protoplasma. 2006;227:147–153. doi: 10.1007/s00709-005-0137-z. [DOI] [PubMed] [Google Scholar]
- (29).Zamora-Perez A, Zuniga-Gonzalez GM, Gomez-Meda BC, Ramos-Ibarra ML, Batista-Gonzalez CM, Torres-Bugarin O. Induction of micronucleated cells in the shed skin of salamanders (Ambystoma sp.) treated with colchicine or cyclophosphamide. Environ. Mol. Mutagen. 2004;44:436–440. doi: 10.1002/em.20074. [DOI] [PubMed] [Google Scholar]
- (30).Kojima H, Katsura E, Takeuchi S, Niiyama K, Kobayashi K. Screening for estrogen and androgen receptor activities in 200 pesticides by in vitro reporter gene assays using Chinese hamster ovary cells. Environ. Health Perspect. 2004;112:524–531. doi: 10.1289/ehp.6649. [DOI] [PMC free article] [PubMed] [Google Scholar]
- (31).Jenkins JK, Suwannaroj S, Elbourne KB, Ndebele K, McMurray RW. 17-beta-estradiol alters Jurkat lymphocyte cell cycling and induces apoptosis through suppression of Bcl-2 and cyclin A. Int. Immunopharmacol. 2001;1:1897–1911. doi: 10.1016/s1567-5769(01)00114-x. [DOI] [PubMed] [Google Scholar]
- (32).Yao G, Ling L, Luan J, Ye D, Zhu P. Nonylphenol induces apoptosis of Jurkat cells by a caspase-8 dependent mechanism. Int. Immunopharmacol. 2007;7:444–453. doi: 10.1016/j.intimp.2006.11.013. [DOI] [PubMed] [Google Scholar]
Associated Data
This section collects any data citations, data availability statements, or supplementary materials included in this article.


