

Abstract
Purpose
Activation of the apoptotic cascade plays an important role in the response of tumors to therapy. Non-invasive imaging of apoptosis facilitates optimization of therapeutic protocols regarding dosing and schedule, and enables identification of efficacious combination therapies.
Experimental Design
We describe a hybrid polypeptide that reports on caspase-3 activity in living cells and animals in a non-invasive manner. This reporter, ANLucBCLuc, constitutes a fusion of small interacting peptides, peptide A and peptide B, with the NLuc and CLuc fragments of luciferase with a caspase-3 cleavage site (DEVD) between pepANLuc (ANLuc) and pepBCLuc (BCLuc). During apoptosis, caspase-3 cleaves the reporter, enabling separation of ANLuc from BCLuc. A high affinity interaction between peptide A and peptide B restores luciferase activity by NLuc and CLuc complementation. Using a D54 glioma model, we demonstrate the reporter’s utility in imaging of apoptosis in living subjects in response to various chemo- and radiation therapy regimens.
Results
Treatment of live cells and mice carrying D54 tumor xenografts with chemotherapeutic agents such as temozolomide and perifosine resulted in induction of bioluminescence activity, which correlated with activation of caspase-3. Treatment of mice with combination therapy of temozolomide and radiation resulted in increased bioluminescence activity over individual treatments and increased therapeutic response due to enhanced apoptosis.
Conclusion
The data provided demonstrates the utility of the ANLucBCLuc reporter in dynamic, non-invasive imaging of apoptosis and provides a rationale for use of this technology to optimize dose and schedule of novel therapies or to develop novel combination therapies using existing drugs.
Keywords: Luciferase, Apoptosis, Perifosine, Temozolomide, D54
Introduction
Programmed cell death or apoptosis is an important physiologic process multicellular organisms utilize to maintain homeostasis by providing a means for elimination of redundant cells during development (1, 2). Furthermore, cells that have become damaged or defective undergo apoptosis to prevent disease. Apoptosis may also be initiated in response to cellular stresses such as growth factor deprivation, DNA damaging events, hypoxia, heat, cold, or chemical injury (3). Although there are many events that direct a cell to apoptose, the pathways and players that orchestrate the process are a well characterized few. Apoptosis may proceed by activation of one of two disparate pathways, both requiring sequential activation of zymogen cysteine proteases known as caspases (4, 5). Whether apoptosis proceeds via the intrinsic or extrinsic apoptotic pathway, activation of initiator caspases culminate in activation of executioner caspases, such as caspase-3, whose activity results in the appearance of apoptotic morphology due to cleavage of target proteins containing the caspase-3 specific DEVD cleavage motif (6). Thus, monitoring caspase-3 activity permits comprehensive apoptosis detection.
Dysregulation of apoptotic pathways contributes directly to a wide variety of pathologic conditions, including stroke, dementia, bone marrow disease, and cancer (1, 7, 8). Over the last decade, it has become clear that neoplastic transformation is a result of defects in both apoptosis and proliferation, resulting in aberrant cell growth, as proliferation proceeds unchecked (9, 10). For example, Korsmeyer et al. first demonstrated that constitutive activation of the anti-apoptotic gene bcl-2 leads to B-cell lymphoma (11). Additionally, over-expression of anti-apoptotic proteins such as XIAP and MDM2 occurs in many cancers (4). The transcription factor, p53, which controls cell cycle arrest in response to cellular stress or DNA damage, is commonly mutated in many different cancers (12). Whether proteins are constitutively active, over-expressed, or mutated, genetic alterations ultimately attenuate apoptotic responses and facilitate neoplastic transformation through unregulated cellular proliferation. A great majority of modern cancer therapies target these genetically altered proteins or signaling cascades and invariably result in the induction of apoptosis by restoring a means for the apoptotic pathway to ensue (4, 13).
Since many current cancer therapies promote cell death by reinstituting the apoptotic cascade, the ability to detect apoptosis in live cells and animals would aid significantly in development of new cancer therapies and enhance our understanding of various disease processes, such as cancer, wherein dysregulation of apoptosis is involved. Development of a reporter system that monitors apoptosis non-invasively would facilitate drug discovery and preclinical evaluation of therapeutic protocols regarding dosing, schedule, and efficacy of drug combination therapies.
To develop this apoptosis reporter, we have adapted the split firefly reporter strategy (14), which effectively abolishes luciferase activity and fused N-terminal and C-terminal domains of luciferase to two strongly interacting peptides, peptide A (pepA) and peptide B (pepB), respectively (15, 16). Constructing a polypeptide wherein pepA-N-Luciferase (ANLuc) and pepB-C-Luciferase (BCLuc) are positioned with an intervening caspase-3 cleavage site significantly reduces bioluminescence activity as the N and C-terminal portions of luciferase are unable to interact. When caspase-3 becomes active, the reporter is cleaved, and pepA and pepB associate by a high affinity interaction and facilitate complementation of NLuc and CLuc domains, thus reconstituting luciferase.
To test this novel reporter system, we created stable cell lines using D54 cells derived from a patient with glioblastoma multiforme (GBM). GBM is a common type of brain tumor with limited survival beyond one year post-diagnosis in patients despite aggressive treatment (17–19). New classes of chemotherapeutic drugs such as perifosine and temozolomide (TMZ) are being used clinically, independently and in conjunction with radiation and surgery, to combat GBM in patients (20–22). Perifosine is a member of the alkylphospholipid class of chemotherapeutic drugs that exerts its cytotoxic effects by interfering with Akt activation (23). TMZ is an alkylating agent that induces DNA methylation, ultimately resulting in cell death (24). By treating our D54 reporter cell line with these drugs, we show that this apoptosis reporter system is a sensitive, dynamic, and quantitative reporter of caspase-3 activity both in vitro and in vivo. In addition, we show that this reporter system can be employed to optimize dosing and scheduling of novel therapies in a dynamic, non-invasive manner.
Materials and Methods
Reagents
Enzymes for cloning were purchased from New England Biolabs. Perifosine (Cayman Chemicals, Ann Arbor, MI), temozolomide (Schering Corp, Kenilworth, NJ), staurosporine (Sigma, St. Louis, MO), and luciferin (Promega, Madison, WI) were purchased for use. Perifosine was dissolved in saline, and temozolomide was dissolved in DMSO. Drugs, with the exception of staurosporine, were prepared fresh on the day of treatment. Fugene 6, WST-1 cell viability kit, and Rapid DNA Ligation Kit were purchased from Roche (Indianapolis, IL). All media, Fetal Bovine Serum (FBS), and media components used for cell culture were purchased from Gibco (Carlsbad, CA).
Cell Culture and Transfections
COS cells were maintained in DMEM, and D54 cells were maintained in RPMI. The media of both cell lines contained 10% FBS, 1% ℓ-glutamine, 100ug/mL penicillin, 100ug/mL streptomycin. Cells were transfected with plasmids using Fugene 6 according to the manufacturer’s protocol and stable D54 clones were selected with 200ug/mL G418 (Invitrogen, Carlsbad, CA). Cell lines were incubated at 37°C with 5% CO2.
Plasmid Construction
The intact luciferase plasmid was constructed by ligation of luciferase into the vector pEF. The split luciferase fusion plasmid was constructed by ligation of pepANLuc DEVD to pepBCLuc in the vector pEF. Firefly luciferase fragments (and intact luciferase) were obtained by PCR of pGL2-luciferase plasmid (Promega, Madison, WI) as described (14). Peptide A (with linker) was added to the N-terminal fragment of luciferase (1–1245bp) using primer 5′ATG AAC GAA GCA TAT GTA CAT GAC GGT CCT GTA CGC TCA CTG AAC AGC GGC CGC AGA AGT ATA GCA ACA GAA GAC 3′ by PCR. The caspase-3 cleavage site (with triglycine linkers on each side) was added to the C-terminal end of pepANLuc fragment using primer 5′ CCT CCT CCA TCG ACT TCG TCG CCT CCT CCT CCA TCC TTG TCA ATC AAG GC 3′. Peptide B (with linker) was added N-terminally to the C-terminal fragment of luciferase (bp 1197–1653) using primer 5′ AAG GCA CGA AAG GAA GCA GAA CTG GCA GCA GCA ACT GCA GAA CAG AGC GGC CGC AGA CCA GCA TGC AAA ATA CCA 3′ by PCR. The complete plasmid was created by ligation of SalI-pepANlucDEVD-Xba to Xba-pepBCLuc-EcoRI as a SalI-EcoRI fragment into the vector pEF.
Drug Treatment Assays
D54 cells stably expressing ANLucBCLuc were seeded in 12 or 24 well plates. Approximately 48 hours later, media was changed to RPMI without indicator with 1% FBS and drug (or vehicle). Cells were assayed using bioluminescence imaging, cell viability assays, and/or western blot analysis 3 hours (perifosine or staurosporine) or 24 hours (temozolomide) after treatment.
Western Blotting
Western blotting was performed as described (25). Briefly cells were washed in PBS and lysed with a buffer containing 50 mM Tris (pH 7.4), 150 mM NaCl, 1% NP40, supplemented with “cOmplete™” protease inhibitors cocktail (Roche Diagnostics Corp, Indianapolis, IN). Protein was estimated by detergent compatible protein assay kit from Bio Rad (Hercules, CA). Media and lysates were separated by SDS polyacrylamide gel electrophoresis, and protein expression was detected by Western blot analysis using antibodies. ANLucBCLuc was detected using a goat polyclonal antibody to luciferase (AB3256, Chemicon, Temecula, CA), with HRP-conjugated secondary antibody followed by detection by chemiluminescent HRP substrate (Pierce, Rockford, IL). Active caspase-3 was detected using a cleaved caspase-3 (Asp175) rabbit polyclonal antibody (Clone #9661, Cell Signaling Technology, Danvers, MA). Glyceraldehyde-3-phosphate dehydrogenase (GAPDH) was detected using a mouse monoclonal antibody (Abcam, Cambridge, MA). Actin was detected using a rabbit polyclonal antibody (Sigma, St. Louis, MO).
Cell Viability Assay
Cells were seeded in 24 well plates and allowed to incubate for 48 hours, after which drug was added. WST1 reagent was added at indicated time after drug treatment and assayed according to the manufacturer’s protocol. Absorbance was monitored at 460nm and background was monitored at 600nm using a Fluorostar optima plate reader (BMG Labtech, Chicago, IL). Final absorbance units were computed by background subtraction.
Immunostaining
Tumors were excised from mice, immediately placed in O.C.T. (Optimal Cutting Temperature) Compound (Tissue-Tek, Sakura, Torrance, CA), and frozen at −20°C within 10 minutes after excision. After freezing, the tumors were stored at −80°C. Tumors were later cryosectioned and stored at −80°C. For assay, slides were fixed in 3.75% paraformaldehyde (Sigma, St. Louis, MO) for 15 min at RT, washed 1X with PBS, and permeabilized with methanol for 10 min at −20°C. Slides were then rinsed 1X with PBS containing 0.05% Tween 20 (PBS-T). Slides were blocked in 5% donkey serum with 1mg/mL BSA in PBS-T for 1 h at RT, and then washed 1X with PBS-T. Cleaved caspase-3 (Asp175) rabbit polyclonal antibody caspase-3 (Clone #9661, Cell Signaling Technology, Danvers, MA) was added to slides at 1:150 dilution and allowed to incubate overnight at 4°C. Slides were washed 3X in PBS-T and incubated with Cy-3 coupled anti-rabbit secondary antibody (Jackson Immunoresearch, West Grove, PA) at 1:400 dilution at RT for 30 min. The slides were washed 3X in PBS-T and co-stained with 1ug/mL 4′,6-diamidino-2-phenylindole dihydrochloride (DAPI), mounted, and visualized with a Nikon Eclipse TE2000-U (Nikon, Melville, NY) fluorescence microscope. Fluorescent images were acquired with Metamorph software (Molecular Devices Corp, Sunnyvale, CA) using identical exposure times. To determine the percent active caspase-3, eight randomly chosen apoptotic fields from each tumor (>200 cells) were imaged. Total cells (DAPI positive) and active caspase-3 positive cells present in these regions were counted using Metamorph software and expressed as mean percentage.
Cellular bioluminescence assay
Live cells were plated and treated as described in drug treatment assays. D-luciferin (40mg/mL in PBS) was added to each well and photon counts were collected by a Xenogen IVIS CCD camera (Xenogen, Alameda, CA) system 30–40 minutes after luciferin addition. A gray-scale image was collected followed by acquisition and overlay of a pseudo-color image representing the spatial distribution of the detected photons emitted from the active luciferase within the cells. A signal averaging time of 1 minute was used for luminescent image acquisition. Signal intensity was quantified as the sum of all detected photon counts (photons/sec) within a region of interest prescribed over the tumor site using living image software (Xenogen, Alameda, CA).
Irradiation
Mice that underwent radiation therapy were given four or two gray at a dose rate of approximately 1.5Gy/min by a Philips RT-250 Orthovoltage unit (Philips Medical Systems, Bothell, WA). Dosimetry was carried out using an ionization chamber connected to an electrometer system, which is directly traceable to a National Institute of Standards and Technology calibration. Before radiation, mice were anesthetized by i.p. injection of a mixture of 60mg/kg ketamine (Fort Dodge Animal Heath, Fort Dodge, IA) and 3mg/kg xylazine (Llyod Laboratories, Shenandoah, IA).
Mouse Bioluminescence Imaging
Subcutaneous D54 tumors were induced in athymic nude mice (Charles River, Wilmington, MA) by implantation of 106 cells suspended in 0.1 ml. Before imaging, animals bearing palpable tumors were anesthetized with a 1% isofluorane/air mixture and given a single i.p. dose of 150 mg/kg luciferin in normal saline. BLI was accomplished 8–14 min post luciferin administration and data was collected at the time of peak luminescence. During image acquisition, isofluorane anesthesia was maintained using a nose cone delivery system, and animal body temperature was regulated by using a temperature-controlled bed. A gray-scale body image was collected followed by acquisition and overlay of a pseudo-color image representing the spatial distribution of the detected photons emitted from the active luciferase within the tumor cells. A signal averaging time of 10 sec or 30 sec was used for acquisition of the luminescent image. Signal intensity was quantified as the sum of all detected photon counts within a region of interest prescribed over the tumor site (photons/sec) using living image software (Xenogen, Alameda, CA). Perifosine was delivered to mice by oral gavage of 30 mg/kg, and temozolomide was delivered i.p. at either 70 mg/kg or 140 mg/kg. Controls were given either saline (perifosine) or DMSO (temozolomide).
MRI
For MRI examination, mice were anesthetized with a 1% isofluorane/air mixture inside a 7T Varian Unity Inova imaging system as previously described (26). A single-slice gradient-echo sequence was used to confirm proper animal positioning and to prescribe subsequent imaging. Anatomical images were acquired using a standard T2-weighted fast spin echo series (TR/TE=4000/60 msec, 128 × 128 matrix, 3-cm FOV) to assess tumor volume throughout the study. Fifteen to seventeen 0.5mm slices were used to cover the whole tumor. The image acquisition was respiratory gated using a specialized mouse sled (Dazai, Ontario, Canada) connected to a monitoring and gating system (SA instruments, Stony Brook, NY) and the z gradient first moment was zeroed to reduce the dominant source of motion artifact. Images were acquired prior to treatment and at 2–3 day intervals thereafter. The tumor boundary was manually defined on each slice using a region-of-interest tool (Matlab, Mathworks, MA) then integrated across slices to provide a volume estimate. Mean volumetric values were computed and error is expressed as SEM.
Results
Strategy for non-invasive imaging of caspase-3 and in vitro validation of apoptosis reporter
In an effort to develop an improved reporter of apoptosis, we constructed a hybrid molecule wherein NLuc and CLuc containing peptide A (pepA) and peptide B (pepB) at their respective amino termini were fused head to tail with an intervening caspase-3 cleavage site (DEVD). We hypothesized that, in this form, interaction between NLuc and CLuc would be minimized due to steric constraints. Upon induction of apoptosis and caspase-3 activation, cleavage at the DEVD site would free ANLuc and BCLuc and enable reconstitution of luciferase through interaction of pepA and pepB, resulting in bioluminescence activity (Fig. 1A) (16). Preliminary studies were conducted in the transiently transfected glioblastoma cell line, D54. Induction of apoptosis in transfected cells by treatment with staurosporine (STS) resulted in the expected cleavage of ANLucBCLuc (69.3kDa) to fragments ANLuc (47.8kDa) and BCLuc (20.4kDa) in D54 cells as shown in Fig. 1B. The ANLuc and BCLuc polypeptides were only detected three hours post treatment with staurosporine, wherein a significant fraction of cells were undergoing apoptosis (Fig. 1B). At the one and two hour time points, the reporter molecule was detected as the intact anti-luciferase reactive polypeptide. Inhibition of caspases-3 activation in response to STS treatment in the presence of ZVAD-fmk resulted in an inhibition of ANLucBCLuc cleavage, indicating that ANLuc and BCLuc are derived from cleavage at the DEVD motif (data not shown) (27). To evaluate functional reconstitution of the caspase-3 reporter molecule luciferase domains in an apoptosis dependent manner, stably transfected D54-ANLucBCLuc cells were treated with increasing doses of TMZ (Fig. 1C). At 24 hours, cells treated with 2mM TMZ appeared significantly apoptotic compared to cells treated with vehicle or 1mM TMZ. The entire population of cells treated with 4mM TMZ had undergone apoptosis. Western blot analysis of these samples revealed detectable activation of caspase-3 in cells treated with 2mM and 4mM TMZ but not cells treated with vehicle or 1mM TMZ. Western blot analysis for actin was performed to ensure equal loading of protein. Treatment of the D54-ANLucBCLuc cells with increasing doses of perifosine resulted in a dose dependent increase in bioluminescence compared to cells treated with vehicle alone (Fig. 1D). The highest dose of perifosine (24μM) was cytotoxic and thus no significant increase in bioluminescence was detected. Western blot analysis of D54-ANLucBCLuc cells treated in parallel demonstrated a dose dependent increase in caspase-3 activation as well as corresponding increase in cleavage of ANLucBCLuc to its polypeptides. GAPDH was used as control to ensure equal loading of samples. Similar analysis performed in squamous cell carcinoma (SCC-1) cells and prostate carcinoma (DU-145) cells revealed analogous results (data not shown).
Figure 1. Strategy for non-invasive imaging of caspase-3 and in vitro validation of apoptosis reporter.

(A) The ANLucBCLuc apoptosis imaging reporter constitutes the split luciferase (NLuc and CLuc) domains fused to interacting peptides, peptide A and peptide B, with an intervening caspase-3 cleavage motif. Upon induction of apoptosis, the reporter molecule is proteolytically cleaved by caspase-3 at the DEVD motif. This cleavage enables interaction between pepANLuc and pepBCLuc, thus reconstituting luciferase activity. (B) A representative western blot of lysates of D54 cells transfected with ANLucBCLuc and treated with 0.5uM STS or vehicle for the indicated time periods and probed with luciferase antibody. (C) A representative western blot of D54-ANLucBCLuc cell lysates treated with increasing concentrations of temozolomide for 24 hours and probed with luciferase and active caspase-3 antibodies. Lysates were also probed with actin antibody to control for loading. (D) Bioluminescence imaging was performed on whole D54-ANLucBCLuc cells treated with increasing concentrations of perifosine or vehicle after 3 hours (n=4) and expressed as percent change in bioluminescence activity compared to vehicle control after normalizing to viable cells (Mean +/− SD). A representative western blot of D54-ANLucBCLuc cell lysates treated as above and probed with luciferase and active caspase-3 specific antibodies. Lysates were also probed with GAPDH antibody to control for loading.
Validation of the ANLucBCLuc apoptosis reporter in vivo
To evaluate the utility of the reporter in a live subject, D54-ANLucBCLuc cells were implanted subcutaneously in flanks of mice. When tumors reached ~100mm3, mice were randomly sorted into two groups. Bioluminescence imaging was performed prior to treatment and 12 hours post treatment with 30mg/kg perifosine or vehicle control. An approximately 6-fold increase in bioluminescence activity was observed in animals treated with perifosine while those in vehicle control group had no significant increase in bioluminescence activity (Fig. 2A and 2B). To investigate the quantitative nature of the reporter, mice bearing D54-ANLucBCLuc tumors were treated with 70mg/kg TMZ, 140mg/kg TMZ, or vehicle alone (Fig. 2C and 2D[upper]). As above, vehicle treated animals had no significant increase in bioluminescence signal post drug administration. Animals treated with 70mg/kg TMZ showed a peak bioluminescent activity at the three hour time point after which a gradual decline was observed. Similarly, animals treated with 140mg/kg TMZ had a peak in bioluminescence activity at the three hour time point, which declined subsequently over time. The average increase in bioluminescence activity at the three hour time point was ~5 fold in animals treated with 70mg/kg TMZ and ~12 fold in animals treated with 140mg/kg TMZ. To confirm that bioluminescence observed with TMZ treatment was due to caspase-3 activity and not to substrate treatment/delivery or promoter-related effects on the reporter system, we treated mice bearing D54-ANLucBCLuc tumors or intact, constitutively active luciferase (D54-Luc) tumors with 140mg/kg TMZ and monitored bioluminescence over time. Here, D54-ANLucBCLuc tumor bearing animals had a ~8 fold increase in bioluminescent activity three hours post TMZ administration, while animals bearing D54-Luc tumors had no significant increase in bioluminescence activity over time (Fig 2D[lower]).
Figure 2. Validation of the ANLucBCLuc apoptosis reporter in vivo.

(A) Bioluminescence images of representative animals harboring D54-ANLucBCLuc xenografts from control (n=6) and perifosine (n=6) treated groups both before and 12 hours after treatment. (B) The mean induction of bioluminescence activity in response to perifosine (30mg/kg) (n=6) or vehicle treated (n=6) animals was calculated and plotted as the mean fold increase from pre-treatment values. (C) Bioluminescence images of representative animals with D54-ANLucBCLuc xenografts from control, 70mg/kg TMZ, and 140mg/kg TMZ treated groups prior to and three hours post treatment. (D) The mean induction of bioluminescence activity from control (n=4), 70mg/kg TMZ (n=4), and 140mg/kg TMZ (n=4) treated groups [upper] and from animals bearing D54-Luciferase (n=4) or D54-ANLucBCLuc (n=4) tumors treated with 140mg/kg TMZ [lower] was calculated and plotted over time. Data represents the mean fold increase from pre-treatment values. (Mean +/− SD)
Bioluminescence activity parallels levels of active caspase-3 in tumor xenografts
To validate that increases in bioluminescence activity were coincident with activated caspase-3, tumors from animals treated with vehicle, 70mg/kg, and 140mg/kg TMZ were excised, cryosectioned, and immunostained for active caspase-3 (Fig. 3A). Eight randomly chosen apoptotic fields from treated tumors were imaged and used to determine the percentage of cells with activated caspase-3. Tumors from animals treated with 70mg/kg TMZ had ~5-fold increase in cells staining positive for active caspase-3 compared to control. Active caspase-3 levels were ~2 fold higher in tumors from animals treated with 140mg/kg TMZ than in tumors from animals treated with 70mg/kg TMZ and ~12 fold higher than tumors from animals treated with vehicle (Fig. 3B).
Figure 3. Bioluminescence activity parallels levels of active caspase-3 in tumor xenografts.

(A) Representative images of 20X magnified tumor samples from D54 tumor bearing animals treated with vehicle (control), 70mg/kg, and 140mg/kg TMZ are shown. Tumor samples were immunostained with DAPI nuclear stain (blue) and active caspase-3 specific antibody (Cell Signaling) (red). (B) Eight randomly chosen apoptotic fields from each tumor were used to determine the percentage of active caspase-3 positive tumor cells from animals treated with vehicle, 70mg/kg, and 140mg/kg TMZ as indicated. (Mean +/− SD)
TMZ in combination with RT enhances apoptosis in GBM tumor xenografts
To investigate the potential use of the reporter in evaluation of combination therapies, animals bearing D54-ANLucBCLuc tumors were treated with ionizing radiation (RT) (4Gy), TMZ (70mg/kg), and a combination of TMZ and RT (Fig. 4A, 4B, and 4C). As observed previously, animals treated with vehicle only had no significant increase in bioluminescence activity while animals treated with TMZ had ~4 fold increase in bioluminescence. Animals treated with RT alone had no significant increase in bioluminescence activity. In contrast, pretreatment of animals with TMZ 18 hours prior to treatment with RT resulted in an increase in bioluminescence of ~8 fold above controls, which peaked six hours post RT administration and diminished over time.
Figure 4. TMZ in combination with RT enhances apoptosis in GBM tumor xenografts.

(A) Bioluminescence images of representative animals harboring D54-ANLucBCLuc xenografts from RT, TMZ, and TMZ/RT combination therapy treated groups both pre and 6 hours post treatment with RT. (B) The mean induction of bioluminescence activity from RT (n=4), TMZ (n=4), and TMZ/RT combination therapy (n=4) treated animals was calculated and plotted as the mean fold increase from pre-treatment values over time. (C) The mean induction of bioluminescence activity from vehicle (n=4), RT (n=4), TMZ (n=4), and TMZ/RT combination therapy (n=4) animals was calculated six hours post RT and plotted as the mean fold increase from pre-treatment values. (Mean +/− SD)
TMZ in combination with RT enhances apoptosis in GBM tumor xenografts in a therapeutic setting
To evaluate the efficacy of TMZ and RT in combination in a context that approximates clinical treatment of patients with GBM, D54-ANLucBCLuc tumor bearing animals were separated into four groups. One group of animals was treated with vehicle and served as control, one group was treated with only RT, one group was treated with only TMZ, and the final group was treated with a combination of RT and TMZ (Fig. 5A, 5B, and 5C). Each animal was treated five times a week for two weeks. Radiation therapy given at a fractionated schedule did not result in significant increase in bioluminescence activity over time. In contrast, repeat treatment of tumor bearing animals with TMZ resulted in a cumulative increase in bioluminescence activity until day 12, after which a decline in bioluminescence activity was observed. Animals treated with a fractionated schedule of both therapies had significant enhancement in bioluminescence activity compared to animals treated with single therapies. Determination of bioluminescence activity for each animal revealed that control and RT treated animals had a minimal increase in bioluminescence activity while TMZ treated animals had a ~50-fold increase. Animals treated with both TMZ and RT showed > 150-fold increase in bioluminescence activity.
Figure 5. TMZ in combination with RT enhances apoptosis in GBM tumor xenografts in a therapeutic setting.

(A) Bioluminescence images of representative animals harboring D54-ANLucBCLuc xenografts treated with vehicle, RT, TMZ, or TMZ/RT combination therapy prior to treatment and at peak maximal induction of bioluminescence activity after treatment. (B) Change in bioluminescence activity in vehicle, RT, TMZ, and TMZ/RT treated group was calculated, normalized to tumor volume, and plotted as the mean fold increase from pre-treatment values over time. Mean tumor volumes were assessed on alternate days and are expressed in relation to the initial volume. Horizontal lines represent a period wherein daily doses of 70mg/kg TMZ were administered. Arrows represent 2Gy daily dose of ionizing radiation. (C) The mean induction of bioluminescence activity from vehicle (n=6), RT (n=4), TMZ (n=8), and TMZ/RT combination therapy (n=10) animals was calculated and plotted as the mean fold increase from pre-treatment values. (Mean +/− SEM)
RT/TMZ combination therapy enhances tumor regression in GBM tumor xenografts
Determination of tumor volumes over time in each of the treatment groups described above revealed that animals treated with RT alone exhibited a tumor growth delay compared to control group, and animals treated with TMZ or combination therapy exhibited an enhanced tumor growth delay compared to RT and control treated animals (Fig. 6A). After completion of the treatment regimen, tumors of animals treated with vehicle alone had a mean volume increase of 150% over the volume recorded before the start of treatment, while animals treated with RT therapy had a mean tumor volume increase of only 50%. Animals receiving TMZ alone or a combination of the two therapies had tumors shrink to −30% and −75% of their original volume, respectively (Fig. 6B).
Figure 6. RT/TMZ combination therapy enhances tumor regression in GBM tumor xenografts.
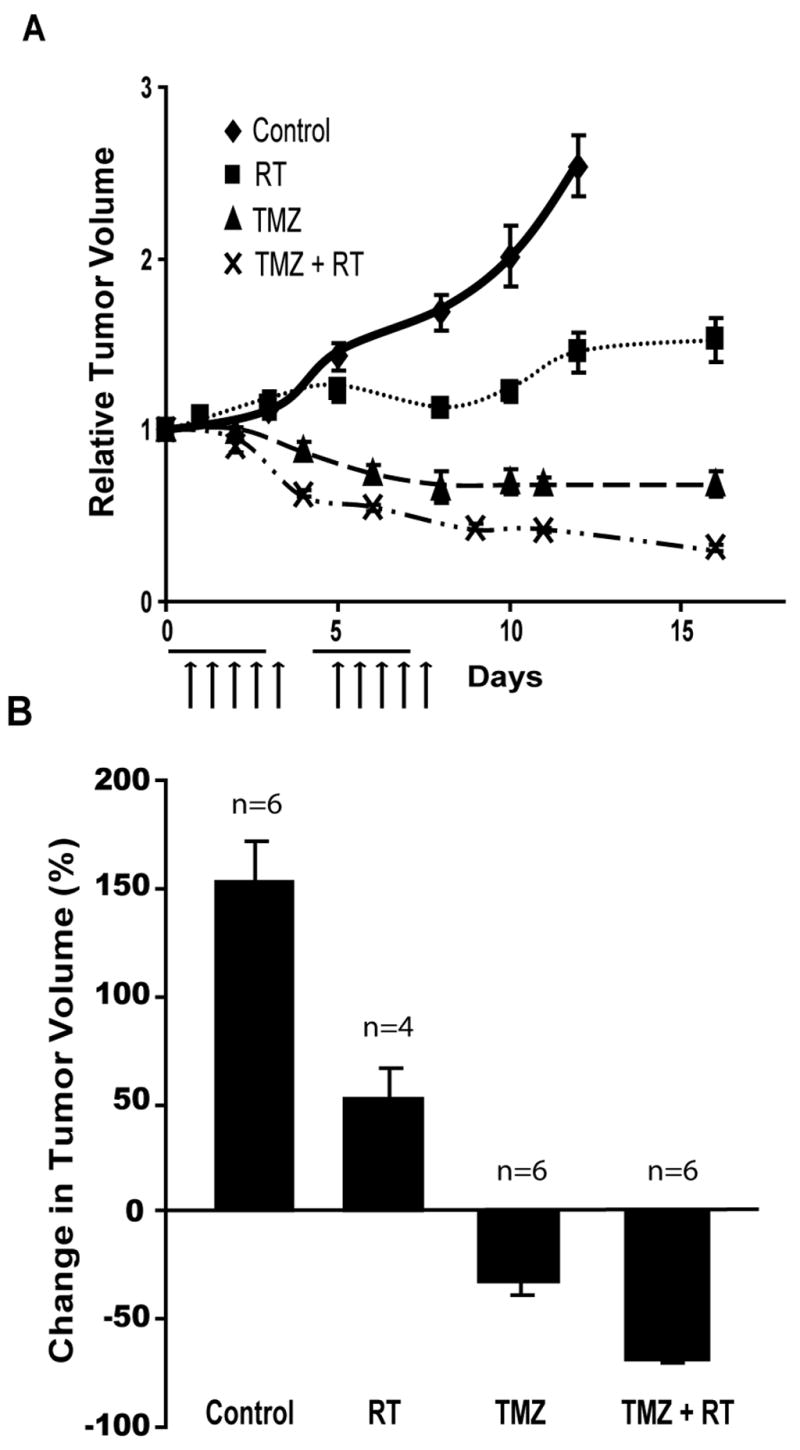
(A) Mice harboring D54-ANLucBCLuc xenografts were treated with vehicle (n=6), RT (n=4), TMZ (n=8), or TMZ/RT (n=10). Mean tumor volumes were assessed on alternate days and are expressed in relation to the initial volume. Horizontal lines represent a period wherein daily doses of 70mg/kg TMZ were administered. Arrows represent 2Gy daily dose of ionizing radiation. (B) Similarly, changes in tumor volume were calculated 16 days after the start of treatment and are expressed as a percent change in tumor volume. (Mean +/− SEM)
Discussion
Molecular imaging provides the ability to dynamically and non-invasively monitor specific biological pathways in a single living subject. Recent advances in the field have enabled imaging of protein-protein interactions using split reporter constructs (14, 28–31), and others(32–34) have used molecular imaging to monitor processes such as cell proliferation or protein degradation. Here we describe a strategy for imaging apoptosis using a luciferase complementation assay with enhanced signal to noise over our previous efforts (35). Increased signal to noise was achieved by reducing interaction between NLuc and CLuc fragments by steric hinderance (to decrease background) and by increasing NLuc and CLuc fragment complementation via the high affinity interaction of pepA and pepB (to increase signal). Although some self-complementation is observed by NLuc and CLuc proteins when coexpressed in culture (14), addition of pepA and pepB to the split luciferase fragments increased bioluminescence activity observed by ~20-fold (data not shown). Additionally, expression of ANLuc and BCLuc components in parallel as a hybrid protein (ANLucBCLuc) hindered self-complementation between the NLuc and CLuc fragments, reducing bioluminescence activity observed to ~38% of coexpressed NLuc and CLuc fragments (data not shown). Bioluminescence observed by expression of ANLucBCLuc was reduced to ~2% of that observed by coexpression of pepANLuc and pepBCLuc fragments (data not shown). This approach both lowered background and increased luciferase signal, greatly enhancing the signal-to-noise of the ANLucBCLuc reporter construct. The highest bioluminescence activity exhibited in early studies was approximately 6–8 fold over pretreatment values (35, 36). In contrast, activation of the ANLucBCLuc reporter has consistently resulted in an induction of bioluminescence activity of 6–75 fold over pretreatment values under various conditions.
Time and dose dependence studies revealed that bioluminescence activity and cleavage of ANLucBCLuc occurs in conditions wherein caspases-3 is active. In dose dependence studies, increased bioluminescence activity was observed at concentrations lower than detectable active caspases-3 by western blot analysis (Fig. 1D). This suggests that the reporter may be a more sensitive measure of caspase-3 activation than traditional western blot analysis. Although not investigated here, this reporter may also be activated by active caspase-7, which cleaves proteins containing the DEVD cleavage motif (37).
The quantitative nature of this reporter technology was demonstrated by comparing bioluminescence activity and active caspase-3 staining of tumors from animals treated with vehicle, 70mg/kg, or 140mg/kg TMZ as shown in Fig. 2C, 2D and Fig. 3A, 3B. Bioluminescence activity in tumors of animals receiving 140mg/kg TMZ increased ~12-fold over that observed in tumors of animals treated with vehicle, which correlated well with the ~12-fold increase in tumor cells staining positive for active caspase-3. Additionally tumors from animals treated with 70mg/kg TMZ had a ~5-fold increase in bioluminescence activity compared to control, which also paralleled the ~5-fold increase in cells staining positive for active caspase-3 from these tumors. This suggests that ANLucBCLuc can be used in a quantitative manner to determine whether increasing doses of drug are adding therapeutic benefit by enhancing apoptosis.
The utility of this technology in an experimental therapeutics setting was demonstrated in various contexts. First, the ability of this reporter to non-invasively report on the efficacy of combination therapies is demonstrated in Fig. 4 and Fig. 5. Treatment of orthotopic GBM tumors to single modality therapy (TMZ or RT) as well as combination therapy (TMZ + RT) in both short term (36 hours) and long term (two week) studies revealed enhanced apoptotic cell death when animals were treated with combinatorial therapy. Second, the utility of the reporter in scheduling optimization was demonstrated. For example, data presented in Fig. 4 show that application of a single dose of RT to animals pretreated with TMZ 18 hours prior was sufficient to induce a significant enhancement in apoptosis, while RT alone did not result in a significant induction of apoptosis.
An apoptosis reporter such as ANLucBCLuc that can be utilized to monitor apoptosis dynamically and non-invasively provides the opportunity to rationally design fractionated therapeutic protocols. For example, data presented in Fig. 2D demonstrate that a single dose of TMZ results in peak apoptosis three hours after administration and subsides significantly after 12 hours. Re-treatment of animals at this time would be rational in that systemic toxicity would be minimized while still providing prolonged periods of increased apoptosis. Indeed, experiments described in Fig. 5 were designed based on this concept and thus animals were treated daily with lower doses of TMZ.
Results obtained from the combination therapy experiments conducted in this study are supported by various published studies using TMZ and RT treatment. Treatment of tumors with RT alone did not induce apoptosis as detected by our reporter (Fig. 4C and 5C); however, these tumors had decreased growth compared to tumors from control mice (Fig. 6B). This data supports studies demonstrating that tumor response to RT results in only modest levels of apoptosis in most tumor cell lines (38, 39). Instead, tumors treated with DNA damaging therapy such as irradiation undergo cell death via necrosis or “mitotic catastrophe”(40). Administration of the DNA alkylating agent TMZ in conjunction with radiation increases dsDNA damage to levels that activate apoptotic machinery and forms the basis of radio-sensitizing activity of TMZ (24). Thus, tumors of animals receiving both TMZ + RT had dsDNA damage to an extent that enabled activation of the apoptotic cascade, resulting in increased bioluminescence activity compared to animals treated with individual therapies. Additionally, the results of our TMZ and RT combination therapy experiments are consistent with data from a preclinical setting where TMZ + RT treatment was found to be synergistic in tumors with low O6-methylguanine-DNA methyl-transferase (MGMT) levels. D54 cells express low levels of MGMT, which may provide an additional mechanism for the radio-sensitization effect of TMZ (24, 41).
Although bioluminescence imaging of apoptosis using the technology described here is limited to testing of potential chemotherapeutic drugs using animals in a research setting, we believe that information garnered using this type of technology with regards to schedule and efficacy of combination therapies has potential to impact the clinical setting. In fact, TMZ + RT combination treatment of brain tumors is showing significant promise in patients.
Although not investigated here, we believe that the ANLucBCLuc reporter would be of significant benefit in studies of other pathologies wherein dysregulation of apoptosis plays an important role and have begun development of transgenic animals that initiate expression of the reporter in a tissue specific manner. Additionally, we are developing reporters for other cytosolic proteases that play a role in various disease processes. Further, replacing the reporter platform with other reporter molecules (e.g. B-galactosidase) that, unlike luciferase, do not require ATP as a cofactor and would remain active in non-viable cells could be developed. Recently, firefly luciferase fragments with novel split sites enabling more effective silencing of luciferase have been reported (42). We are constructing caspase reporters using these improved split sites to further reduce the background signal of our reporter system. In summary, we have shown this reporter system can be utilized to sensitively, dynamically, and quantitatively image apoptosis. This will enable development or enhancement of therapeutic protocols by providing a platform to investigate dosing, scheduling, or the efficacy of combination therapies in living subjects.
Acknowledgments
We would like to acknowledge Bradford Moffat and Mukilan Muthuswami at the Molecular Imaging Core at University of Michigan for assistance with MRI imaging and Mahaveer Swaroop Bhojani for assistance with figure generation and Mike Dugre for careful reading of the manuscript. We acknowledge Steven Kronenberg for generation of Fig. 1A. This work was supported by NIH/NCI grants P01CA85878, R24CA83099, and P50CA093990.
Abbreviations
- GBM
Glioblastoma Multiforme
- RT
Radiation therapy
- STS
Staurosporine
- TMZ
Temozolomide
References
- 1.Danial NN, Korsmeyer SJ. Cell death: critical control points. Cell. 2004;116(2):205–19. doi: 10.1016/s0092-8674(04)00046-7. [DOI] [PubMed] [Google Scholar]
- 2.Jacobson MD, Weil M, Raff MC. Programmed cell death in animal development. Cell. 1997;88(3):347–54. doi: 10.1016/s0092-8674(00)81873-5. [DOI] [PubMed] [Google Scholar]
- 3.Levine AJ, Hu W, Feng Z. The P53 pathway: what questions remain to be explored? Cell Death Differ. 2006;13(6):1027–36. doi: 10.1038/sj.cdd.4401910. [DOI] [PubMed] [Google Scholar]
- 4.Fesik SW. Promoting apoptosis as a strategy for cancer drug discovery. Nat Rev Cancer. 2005;5(11):876–85. doi: 10.1038/nrc1736. [DOI] [PubMed] [Google Scholar]
- 5.Budihardjo I, Oliver H, Lutter M, Luo X, Wang X. Biochemical pathways of caspase activation during apoptosis. Annu Rev Cell Dev Biol. 1999;15:269–90. doi: 10.1146/annurev.cellbio.15.1.269. [DOI] [PubMed] [Google Scholar]
- 6.Kerr JF, Wyllie AH, Currie AR. Apoptosis: a basic biological phenomenon with wide-ranging implications in tissue kinetics. Br J Cancer. 1972;26(4):239–57. doi: 10.1038/bjc.1972.33. [DOI] [PMC free article] [PubMed] [Google Scholar]
- 7.Thompson CB. Apoptosis in the pathogenesis and treatment of disease. Science. 1995;267(5203):1456–62. doi: 10.1126/science.7878464. [DOI] [PubMed] [Google Scholar]
- 8.Nicholson DW. ICE/CED3-like proteases as therapeutic targets for the control of inappropriate apoptosis. Nat Biotechnol. 1996;14(3):297–301. doi: 10.1038/nbt0396-297. [DOI] [PubMed] [Google Scholar]
- 9.Hanahan D, Weinberg RA. The hallmarks of cancer. Cell. 2000;100(1):57–70. doi: 10.1016/s0092-8674(00)81683-9. [DOI] [PubMed] [Google Scholar]
- 10.Kirkin V, Joos S, Zornig M. The role of Bcl-2 family members in tumorigenesis. Biochim Biophys Acta. 2004;1644(2–3):229–49. doi: 10.1016/j.bbamcr.2003.08.009. [DOI] [PubMed] [Google Scholar]
- 11.Korsmeyer SJ. Chromosomal translocations in lymphoid malignancies reveal novel proto-oncogenes. Annu Rev Immunol. 1992;10:785–807. doi: 10.1146/annurev.iy.10.040192.004033. [DOI] [PubMed] [Google Scholar]
- 12.Pietsch EC, Humbey O, Murphy ME. Polymorphisms in the p53 pathway. Oncogene. 2006;25(11):1602–11. doi: 10.1038/sj.onc.1209367. [DOI] [PubMed] [Google Scholar]
- 13.Okada H, Mak TW. Pathways of apoptotic and non-apoptotic death in tumour cells. Nat Rev Cancer. 2004;4(8):592–603. doi: 10.1038/nrc1412. [DOI] [PubMed] [Google Scholar]
- 14.Luker KE, Smith MC, Luker GD, Gammon ST, Piwnica-Worms H, Piwnica-Worms D. Kinetics of regulated protein-protein interactions revealed with firefly luciferase complementation imaging in cells and living animals. Proceedings of the National Academy of Sciences of the United States of America. 2004;101(33):12288–93. doi: 10.1073/pnas.0404041101. [DOI] [PMC free article] [PubMed] [Google Scholar]
- 15.Zhang Z, Zhu W, Kodadek T. Selection and application of peptide-binding peptides. Nat Biotechnol. 2000;18(1):71–4. doi: 10.1038/71951. [DOI] [PubMed] [Google Scholar]
- 16.Thormeyer D, Ammerpohl O, Larsson O, et al. Characterization of lacZ complementation deletions using membrane receptor dimerization. Biotechniques. 2003;34(2):346–50. 52–5. doi: 10.2144/03342rr05. [DOI] [PubMed] [Google Scholar]
- 17.Perry VH, Walker M. Amacrine cells, displaced amacrine cells and interplexiform cells in the retina of the rat. Proc R Soc Lond B Biol Sci. 1980;208(1173):415–31. doi: 10.1098/rspb.1980.0060. [DOI] [PubMed] [Google Scholar]
- 18.Forsyth PA, Cairncross JG. Treatment of malignant glioma in adults. Curr Opin Neurol. 1995;8(6):414–8. doi: 10.1097/00019052-199512000-00002. [DOI] [PubMed] [Google Scholar]
- 19.Fine HA. The basis for current treatment recommendations for malignant gliomas. J Neurooncol. 1994;20(2):111–20. doi: 10.1007/BF01052722. [DOI] [PubMed] [Google Scholar]
- 20.Cohen MH, Johnson JR, Pazdur R. Food and Drug Administration Drug approval summary: temozolomide plus radiation therapy for the treatment of newly diagnosed glioblastoma multiforme. Clin Cancer Res. 2005;11(19 Pt 1):6767–71. doi: 10.1158/1078-0432.CCR-05-0722. [DOI] [PubMed] [Google Scholar]
- 21.van Rijn J, Heimans JJ, van den Berg J, van der Valk P, Slotman BJ. Survival of human glioma cells treated with various combination of temozolomide and X-rays. Int J Radiat Oncol Biol Phys. 2000;47(3):779–84. doi: 10.1016/s0360-3016(99)00539-8. [DOI] [PubMed] [Google Scholar]
- 22.Crul M, Rosing H, de Klerk GJ, et al. Phase I and pharmacological study of daily oral administration of perifosine (D-21266) in patients with advanced solid tumours. Eur J Cancer. 2002;38(12):1615–21. doi: 10.1016/s0959-8049(02)00127-2. [DOI] [PubMed] [Google Scholar]
- 23.Momota H, Nerio E, Holland EC. Perifosine inhibits multiple signaling pathways in glial progenitors and cooperates with temozolomide to arrest cell proliferation in gliomas in vivo. Cancer Res. 2005;65(16):7429–35. doi: 10.1158/0008-5472.CAN-05-1042. [DOI] [PubMed] [Google Scholar]
- 24.Chakravarti A, Erkkinen MG, Nestler U, et al. Temozolomide-mediated radiation enhancement in glioblastoma: a report on underlying mechanisms. Clin Cancer Res. 2006;12(15):4738–46. doi: 10.1158/1078-0432.CCR-06-0596. [DOI] [PubMed] [Google Scholar]
- 25.Coppola JM, Hamilton CA, Bhojani MS, Larsen MJ, Ross BD, Rehemtulla A. Identification of inhibitors using a cell-based assay for monitoring Golgi-resident protease activity. Analytical Biochemistry. 2007 doi: 10.1016/j.ab.2007.01.013. in press. [DOI] [PMC free article] [PubMed] [Google Scholar]
- 26.Moffat BA, Hall DE, Stojanovska J, et al. Diffusion imaging for evaluation of tumor therapies in preclinical animal models. Magma. 2004;17(3–6):249–59. doi: 10.1007/s10334-004-0079-z. [DOI] [PubMed] [Google Scholar]
- 27.Slee EA, Zhu H, Chow SC, MacFarlane M, Nicholson DW, Cohen GM. Benzyloxycarbonyl-Val-Ala-Asp (OMe) fluoromethylketone (Z-VAD.FMK) inhibits apoptosis by blocking the processing of CPP32. Biochem J. 1996;315(Pt 1):21–4. doi: 10.1042/bj3150021. [DOI] [PMC free article] [PubMed] [Google Scholar]
- 28.Ozawa T, Nogami S, Sato M, Ohya Y, Umezawa Y. A fluorescent indicator for detecting protein-protein interactions in vivo based on protein splicing. Analytical chemistry. 2000;72(21):5151–7. doi: 10.1021/ac000617z. [DOI] [PubMed] [Google Scholar]
- 29.Gross S, Piwnica-Worms D. Monitoring proteasome activity in cellulo and in living animals by bioluminescent imaging: technical considerations for design and use of genetically encoded reporters. Methods Enzymol. 2005;399:512–30. doi: 10.1016/S0076-6879(05)99035-6. [DOI] [PubMed] [Google Scholar]
- 30.Paulmurugan R, Gambhir SS. Novel fusion protein approach for efficient high-throughput screening of small molecule-mediating protein-protein interactions in cells and living animals. Cancer Res. 2005;65(16):7413–20. doi: 10.1158/0008-5472.CAN-05-0588. [DOI] [PMC free article] [PubMed] [Google Scholar]
- 31.Paulmurugan R, Gambhir SS. Firefly luciferase enzyme fragment complementation for imaging in cells and living animals. Analytical chemistry. 2005;77(5):1295–302. doi: 10.1021/ac0484777. [DOI] [PMC free article] [PubMed] [Google Scholar]
- 32.Momota H, Holland EC. Bioluminescence technology for imaging cell proliferation. Curr Opin Biotechnol. 2005;16(6):681–6. doi: 10.1016/j.copbio.2005.10.012. [DOI] [PubMed] [Google Scholar]
- 33.Zhang GJ, Kaelin WG., Jr Bioluminescent Imaging of Ubiquitin Ligase Activity: Measuring Cdk2 Activity In Vivo Through Changes in p27 Turnover. Methods Enzymol. 2005;399:530–49. doi: 10.1016/S0076-6879(05)99036-8. [DOI] [PubMed] [Google Scholar]
- 34.Zhang GJ, Safran M, Wei W, et al. Bioluminescent imaging of Cdk2 inhibition in vivo. Nat Med. 2004;10(6):643–8. doi: 10.1038/nm1047. [DOI] [PubMed] [Google Scholar]
- 35.Laxman B, Hall DE, Bhojani MS, et al. Noninvasive real-time imaging of apoptosis. Proceedings of the National Academy of Sciences of the United States of America. 2002;99(26):16551–5. doi: 10.1073/pnas.252644499. [DOI] [PMC free article] [PubMed] [Google Scholar]
- 36.Lee KC, Hamstra DA, Bhojani MS, et al. Non-Invasive molecular imaging sheds light on the synergy between 5-Fluorouracil and TRAIL/Apo2L for cancer therapy. Clin Cancer Res. 2006 doi: 10.1158/1078-0432.CCR-06-1657. in press. [DOI] [PubMed] [Google Scholar]
- 37.Talanian RV, Quinlan C, Trautz S, et al. Substrate specificities of caspase family proteases. The Journal of biological chemistry. 1997;272(15):9677–82. doi: 10.1074/jbc.272.15.9677. [DOI] [PubMed] [Google Scholar]
- 38.Brown JM, Attardi LD. The role of apoptosis in cancer development and treatment response. Nat Rev Cancer. 2005;5(3):231–7. doi: 10.1038/nrc1560. [DOI] [PubMed] [Google Scholar]
- 39.Gudkov AV, Komarova EA. The role of p53 in determining sensitivity to radiotherapy. Nat Rev Cancer. 2003;3(2):117–29. doi: 10.1038/nrc992. [DOI] [PubMed] [Google Scholar]
- 40.Seluanov A, Gorbunova V, Falcovitz A, et al. Change of the death pathway in senescent human fibroblasts in response to DNA damage is caused by an inability to stabilize p53. Molecular and cellular biology. 2001;21(5):1552–64. doi: 10.1128/MCB.21.5.1552-1564.2001. [DOI] [PMC free article] [PubMed] [Google Scholar]
- 41.Bocangel DB, Finkelstein S, Schold SC, Bhakat KK, Mitra S, Kokkinakis DM. Multifaceted resistance of gliomas to temozolomide. Clin Cancer Res. 2002;8(8):2725–34. [PubMed] [Google Scholar]
- 42.Paulmurugan R, Gambhir SS. Combinatorial library screening for developing an improved split-firefly luciferase fragment-assisted complementation system for studying protein-protein interactions. Analytical chemistry. 2007;79(6):2346–53. doi: 10.1021/ac062053q. [DOI] [PMC free article] [PubMed] [Google Scholar]