

Abstract
Chromosomal rearrangements in human cancers are of two types, interchromosomal, which are rearrangements that involve exchange between loci located on different chromosomes, and intrachromosomal, which are rearrangements that involve loci located on the same chromosome. The type of rearrangement that typically activates a specific oncogene may be influenced by its nuclear location and that of its partner. In interphase nuclei, each chromosome occupies a distinct three-dimensional territory that tends to not overlap the territories of other chromosomes. It is also known that after double strand breaks in the genome, mobility of free DNA ends is limited. These considerations suggest that loci located deep within a chromosomal territory might not participate in interchromosomal rearrangements as readily as in intrachromosomal rearrangements. To test this hypothesis, we used fluorescence in situ hybridization with 3-D high-resolution confocal microscopy to analyze the positions of six oncogenes known to be activated by recombination in human cancer cells. We found that loci involved in interchromosomal rearrangements were located closer to the periphery of chromosome territories as compared to loci that were involved in intrachromosomal inversions. The results of this study provide evidence suggesting that nuclear architecture and location of specific genetic loci within chromosome territories may influence their participation in intrachromosomal or interchromosomal rearrangements in human thyroid cells.
INTRODUCTION
Chromosomal recombination is an important genetic mechanism involved in a number of physiological and pathological processes including cell transformation. There are at least 293 genes that have been implicated in cancer development to date (Futreal et al., 2004). The majority of these genes are activated as a result of a chromosomal rearrangement, either translocation (an interchromosomal exchange between two or more chromosomes), or an intrachromosomal inversion produced by joining of loci that were formerly located at different sites but on the same chromosome.
Both rearrangement types are likely to be influenced by spatial proximity of recombinogenic partners in the nucleus (Parada and Misteli, 2002; Meaburn et al., 2007). Genetic loci such as BCR (22q11), ABL1 (9q34), MYC, BCL and immunoglobulin genes, which participate in translocations in lymphocytes, are positioned closer to each other in the interphase nucleus than would be expected by chance (Kozubek et al., 1997; Lukasova et al., 1997; Roix et al., 2003). Proximity has been implicated in intrachromosomal rearrangements too. In normal human thyroid cells, genes that are involved in RET/PTC inversions are located closer to each other than expected based on their linear separation (Nikiforova et al., 2000; Gandhi et al., 2006). A similar phenomenon has been reported for genes on chromosome arm 1q that are involved in TRK inversions (Roccato et al., 2005).
While proximity of potential recombination partners has been established as a factor in oncogenic rearrangements, the reason why specific genes are consistently involved in either intrachromosomal or interchromosomal exchange remains unknown. The type of rearrangement that loci are prone to undergo might be influenced by the structure of the genome within an interphase nucleus (Parada and Misteli, 2002; Meaburn et al., 2007). Interphase chromosomes are not diffusely distributed throughout the nucleus, but instead are organized into well-defined chromosome territories (CT) (Cremer et al., 1982; Manuelidis, 1985). A given CT is generally composed of genetic material from an individual chromosome (Cremer and Cremer, 2001). The properties of CTs would seem to pose an impediment to interchromosomal rearrangements since these types of events involve loci on different chromosomes. One way in which this impediment could be circumvented would be by intermingling among CTs, which has been reported to occur in human cells (Savage, 2000; Branco and Pombo, 2006). However, intermingling appears to be most frequent along CT edges. Therefore, loci located deep within a CT might be expected to be less liable to engage in interchromosomal recombination events.
Taking into account that nuclear architecture is cell type specific, testing if preferential positioning of genetic loci within its CT has bearing on the type of chromosomal rearrangement would require a cell type known to yield both translocations and inversions. In this respect, thyroid follicular cells represent an ideal model as they give rise to tumors carrying both rearrangement types. In thyroid follicular carcinomas, translocations involving the PAX8 locus in chromosome band 2q13 and the PPARγ locus in chromosome band 3p25 are frequently seen (Kroll et al., 2000). In thyroid adenomas, common translocations involve the THADA gene (2p21) joined to one of two unidentified sequences on either chromosome 3 (3p25) or 7 (7p15) (Rippe et al., 2003). By contrast, in thyroid papillary cancer, the most common rearrangements, called RET/PTC, are intrachromosomal inversions and involve the RET gene and other genes on chromosome arm 10q (Nikiforov, 2002). The two most common rearrangements types are RET/PTC1, which results from the RET (10q11.2) fusion to the H4 gene (10q21) (Grieco et al., 1990) and RET/PTC3, which involves RET and the NCOA4 gene (10q11.2) (Bongarzone et al., 1994; Santoro et al., 1994). The second most common rearrangement in this type of cancer, known as TRK, is formed by the fusion of the NTRK1 gene located on 1q23 to either TPR (1q25) or TPM3 (1q25) via intrachromosomal inversions (Greco et al., 1993; Butti et al., 1995). Recently, an intrachromosomal inversion that involves the BRAF (7q34) and AKAP9 genes (7q21-22) has been identified in thyroid papillary carcinomas, especially in those associated with radiation exposure (Ciampi et al., 2005).
In this study, we analyzed the position of several recombination-prone genes in human thyroid cells to test the hypothesis that genetic loci involved in interchromosomal exchanges are positioned closer to the edge of a chromosome territory than are loci participating in intrachromosomal rearrangements.
MATERIAL AND METHODS
Tissue Samples and Preparation of Nuclei
The study was approved by the University of Cincinnati and University of Pittsburgh Institutional Review Boards. Normal thyroid tissues from adult individuals were harvested immediately after surgery for nonmalignant thyroid disease at the University Hospital in Cincinnati and either snap frozen in liquid nitrogen or used fresh. Frozen tissue fragments were thawed and imprinted on positively charged glass slides and fixed with 2 changes of chilled methanol: acetic acid (3:1) for 20 minutes (F+MAA) as described previously (Gandhi et al., 2006). Alternatively, fresh tissues were fixed in 4% paraformaldehyde with repeated freeze-thaw cycles in liquid nitrogen (PFA+FT) (Solovei et al., 2002a, b). Although mean nuclear volume of thyroid epithelial cells after F+MAA was ~5% smaller than that after PFA+FT preparation, the relative volumes of CT and the relative intraterritorial positions of selected studied genes were similar when using both techniques, Since F+MAA did not alter the relative measurements and did not require continuous availability of fresh thyroid tissue, we used this technique to carry out most of the experiments.
DNA Probes and FISH
BAC clones RP11-351D16 (RET), RP11-107D16 (NTRK1), RP4-726N20, RP4-813F11 and RP5-839B19 (BRAF), RP11-65I12 and RP11-339F22 (PAX8), RP11-30G23 and RP11-335I9 (PPARγ), RP11-183F15 and RP11-204D19 (THADA), RP11-537A6 (ANXA7), RP11-107L7 (CNNM1), RP5-1080K5 (JAK1), CTB-11K1 (CAV1), RP4-534K7 (PGM1), and RP5-1049N15 (PTPRZ1) obtained from BAC/PAC Resources, Children’s Hospital, Oakland were used as probes for FISH. The probes were labeled by nick translation using SpectrumRed-dUTP and SpectrumGreen-dUTP (Vysis Inc., Downers Grove, IL, USA). Whole chromosome paints were obtained from Cambio (Cambridge, UK). Slides pretreatment and hybridization was performed as previously described (Ciampi et al., 2005; Gandhi et al., 2006).
Confocal Microscopy, 3D Reconstruction and Distance Measurement
Microscopy was performed using a Leica SP5 TCS 4D confocal laser scanning fluorescence microscope. On average, 50 nuclei from each of the two different donors were scanned for signals for each gene. The digital images were reconstructed using Volocity software (Improvision Inc., Lexington, MA, USA). Hybridization signal from the CT was subjected to uniform thresholding, without knowledge of the locus signal to differentiate the territory and demarcate the loci signals. Based on the thresholding, the centroid of the CT was automatically calculated and represented as x, y, and z coordinates. The x, y, and z coordinates of the nearest edge of the territory to the locus was determined by manual recognition of the nearest pixel not containing the territory signal in the same z plane as the centroid of the locus. A similar procedure was used to determine the distance between the locus centroid and nearest nuclear edge. Suppose that (xi, yi, zi) are coordinates for the ith locus in an arbitrary coordinate system, i=1, 2, 3, 4, 5. The physical distance between any two loci i and j is then (Equation 1)
Comparison of absolute distances for different loci was performed using ANOVA. Cumulative frequency distributions of absolute distances for specific genes were built by plotting the values on the X axis and on the Y axis the proportions of all data points that were smaller than this measurement. The absolute distances for the different genes were compared by the two-sample Kolmogorov-Smirnov (KS) test (Conover, 1971). Hierarchical clustering of cumulative frequency distributions was performed by treating the -log10(KS p-value) as the distance measure and applying the average linkage principle (Everitt, 1993).
RESULTS
Using interphase FISH combined with 3D confocal microscopy, we analyzed the intraterritorial position of twelve genes (Fig. 1). Six of them, RET (10q11), NTRK1 (1q23), BRAF (7q34), PAX8 (2q13), PPARγ (3p25), and THADA (2p21) are involved in chromosomal rearrangements in thyroid tumor cells. RET, NTRK and BRAF undergo predominantly intrachromosomal inversions, while PAX8, PPARγ, and THADA are involved in interchromosomal translocations. In addition, the positions of six genes that are located on the same chromosomes as the rearrangement-prone genes, but have not been observed to rearrange, were also analyzed: ANXA7 (10q22), CNNM1 (10q24), JAK1 (1p31), CAV1 (7q31), PGM1 (1p31), and PTPRZ1 (7q31).
Fig. 1. FISH image of normal thyroid cell nucleus after hybridization with chromosome 2 paint (green) and chromosome 7 paint (red).

The cell is co-hybridized with THADA (red) probes and BRAF (green) probes. (A) Extended focus (two-dimensional (2D)) view of the nucleus showing THADA probes located on the periphery of chromosome 2 territory and BRAF probes located within the interior of the chromosome 7 territory (yellow colocalization). (B) Rendered image of the same nucleus showing THADA probes positioned on the surface of the chromosome 2 territories while the BRAF probes are not visible because of the location inside the chromosome 7 territories.
The intraterritorial position of loci was measured as the three-dimensional distance of the signal from the closest CT edge. The distributions of distances from the nearest CT edge showed that the PAX8, PPARγ, and THADA genes tended to be located closer to the CT edge, while the RET, NTRK1, and BRAF genes tended to be located more centrally within the CT (Fig. 2 A). The six genes not involved in recombination showed variable distributions without apparent grouping (Fig 2 B).
Fig. 2. Distribution of distances of probes from closest CT edge.

(A) Genes involved in intrachromosomal rearrangements are represented in shades of red while genes involved in interchromosomal rearrangements are in shades of blue. (B) Genes not involved in chromosomal rearrangements.
Comparison of measurements over the entire spectrum of intraterritorial positions (Fig. 3 A) showed that there was little overlap between the three genes involved in interchromosomal rearrangements (RET, NTRK1, and BRAF) and the genes involved in intrachromosomal exchanges (PAX8, PPARγ, and THADA) over most of the distribution. In contrast, the data from the six non-recombinogenic genes showed significant overlap (Fig. 3 B).
Fig. 3. Cumulative frequency distributions (CFD) of distances of probes from closest CT edge.

(A) CFD curves show separation into two groups with little overlap between the genes involved in interchromosomal (shades of blue) and intrachromosomal (shades of red) exchanges. (B) CFD curves for six genes not implicated in recombination in human cells show significant overlap with no apparent grouping. The solid black line represents the median.
The mean distances from the CT edge for RET, NTRK1 and BRAF were 0.47 μm, 0.51 μm and 0.39 μm respectively, while mean distances for PAX8, PPARγ, and THADA were 0.27 μm, 0.27 μm and 0.29 μm, respectively (Fig. 4 A). The position of each gene involved in translocation was significantly different from that of each gene involved in intrachromosomal inversions. For the six genes not involved in chromosomal rearrangements, the mean values ranged from 0.19 μm to 0.46 μm (Fig. 4 B). When grouped together, the mean distances from the CT edge was 0.46± 0.04 μm for the genes involved in intrachromosomal rearrangements and 0.28± 0.01 μm for the genes involved in interchromosomal exchanges. The difference between the groups was highly significant (p < 0.001). The mean distance from the nearest CT edge for the non-recombinogenic gene group was 0.34±0.04 μm.
Fig. 4. Mean distances of probes from closest CT edge.

(A) Solid black circles represent genes involved in intrachromosomal rearrangements; white circles represent genes involved in interchromosomal rearrangements. (B) Solid grey circles represent genes not involved in recombination. Error bars indicate the standard error of the mean (s.e.m).
To test whether the difference between the groups observed for the mean intraterritorial position was also present over the entire distribution of measurements, the unbiased cluster analysis was carried out for the six genes based on the p values derived from the Kolmogorov-Smirnov test for cumulative frequency distribution (CFD) of distances. PAX8, PPARγ and THADA formed one group with relatively similar intraterritorial positions, while RET, BRAF and NTRK1 formed a second group (Fig. 5A). The separation of distances for genes involved in intrachromosomal and interchromosomal exchanges, in which the number of misclassified gene loci is zero, is one of 81 possible ways to split six objects into two groups. The associated p-value for such a separation is 0.012, which is highly significant. When similar cluster analysis was performed for the six non-recombinogenic genes, it also showed two groups, with one group containing two genes and another containing four genes (Fig. 5 B). These data indicate that intraterritorial positions of the genes involved in interchromosomal rearrangements and those involved in intrachromosomal rearrangements fall into distinct groups with respect to their proximity to the edge of their respective CT.
Fig. 5. Clustering of CFDs.
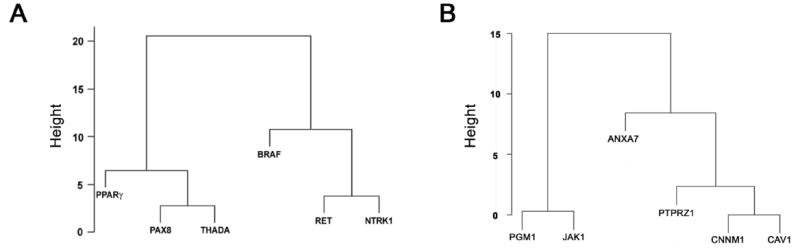
(A) Hierarchical clustering of CFDs of the recombinogenic genes using -log10(KS p-value) as a measure of distance showing two main clusters of genes based on their distance from the nearest CT edge. (B) Hierarchical clustering of CFDs of the non-recombinogenic genes showing the clustering of distances into 2 groups with 4 genes in one group and 2 genes in another.
DISCUSSION
In this study, we show that genes involved in various types of rearrangements in human cells occupy distinct locations within their CT and that loci participating in interchromosomal exchanges are positioned at the edges of CT more frequently than loci that are involved in intrachromosomal inversions. These findings support the concept that genetic loci on the periphery of a CT are exposed more frequently to nearby genes on the periphery of another CT, increasing the probability that interchromosomal rearrangement will occur.
Previous FISH studies have mapped the intranuclear locations of various genetic loci and chromosomal compartments within interphase nuclei (reviewed in (Cremer and Cremer, 2001)). It has been demonstrated that genetic loci that participate in chromosomal rearrangements are non-randomly located with respect to each other and are closer than would be expected by chance (reviewed in (Parada and Misteli, 2002)). However, it remained unclear why certain genes consistently participate in intrachromosomal exchanges while others are preferentially involved in interchromosomal translocations. Since each chromosome occupies a distinct territory within the nucleus and interacts with other chromosomes primarily within the ICD regions, it is likely that nuclear organization affects gene recombination (Bongarzone et al., 1994; Savage, 2000). A DSB produced in an interior domain of a CT would be expected to more readily lead to the formation of a chromosomal inversion rather than to a translocation because access to other chromosomes is blocked. On the other hand, DSBs on the periphery of a CT would have access to loci on other chromosomes, which would enhance the probability of a translocation occurring. This hypothesis, however, has not been previously tested before to the best of our knowledge. In this study, we provide experimental evidence supporting the role of nuclear architecture and gene positioning within their CT in their participation in specific rearrangement types. While such positioning is likely to increase their chances for either intrachromosomal or interchromosomal exchange, this may not be the only factor that is responsible and other modifying factors are likely to play a role in determining the rearrangement type.
Given that the rearrangements seen in cancer cells are generally formed by non-homologous end joining, the availability of gene loci for interchromosomal exchange is expected to correspond to the mobility range of free DNA ends. Early reports had suggested that free DNA ends and non-damaged chromatin can move in a wide range, up to 2 μm (Vazquez et al., 2001; Chubb et al., 2002; Aten et al., 2004). However, more recent studies indicate that the ends of a broken mammalian chromosomes move no more than 0.2 μm (Soutoglou et al., 2007). Our data suggest that such mobility would allow between one-third and one-half of breaks located in loci known to be involved in translocations to reach the CT surface and encounter a break on another chromosome. The proportion may be even higher because CT have complex convoluted surfaces with numerous infoldings which are difficult to visualize by imaging and therefore some signals scored as located within the territory interior would in actuality be positioned closer to the surface of infolded chromatin. The recent study on intermingling between different CT has shown a highly significant correlation between the extent of intermingling and frequency of translocation involving specific chromosome pairs, suggesting that chromatin organization is one of the factors that influences the likelihood of gene participation in specific rearrangement types (Aten and Kanaar, 2006; Branco and Pombo, 2006).
Most prior studies of chromosomal architecture were carried out in lymphocytes or fibroblasts that were cultured on coverslips (Solovei et al., 2002a). The diversity of rearrangements seen in thyroid cancers allowed us to analyze the genes involved in different types of events in their “natural” environments by a novel ex-vivo technique that transferred cells from stored tissue samples to a glass slide. This approach avoids possible artifacts that may be associated with culturing epithelial cells, which may have altered cell polarity and nuclear shape and organization. The fixation method employed in this study involved the use of MAA fixation without hypotonic shock and no significant difference was observed in the nuclear volume, CT volume and intraterritorial gene positioning between PFA-fixed and MAA-fixed cells, which validates the use of this technique. Moreover, a recent study comparing the effect of different fixation protocols on large scale chromatin structure showed that disruption of chromosomal architecture is a result of the treatment with hypotonic solution and not the use of MAA fixative per se (Hepperger et al., 2007).
Since nuclear architecture is cell type-specific, this study benefited from the availability of a cell type that is known to be involved in various types of rearrangements and for which most of the recombination partners have been mapped. Whether the preferential positioning of genes involved in different rearrangement types that we observed in thyroid cells also exists in other cell and tissue types remains to be explored. This undertaking, however, awaits the identification and mapping of more rearrangement-prone genes. To date, very few human cell types harboring both intrachromosomal and interchromosomal exchanges have been characterized.
In summary, the findings of this study, together with the previously demonstrated spatial proximity between recombinogenic partners, suggest that nuclear architecture influences chromosome recombination by (i) facilitating joining of loci located in spatial proximity, and (ii) favoring interchromosomal exchange for loci located close to the surface and intrachromosomal rearrangement for loci positioned within the interior of their CT.
Acknowledgments
Supported by the NIH grant R01 CA88041.
References
- Aten JA, Kanaar R. Chromosomal organization: mingling with the neighbors. PLoS Biol. 2006;4:e155. doi: 10.1371/journal.pbio.0040155. [DOI] [PMC free article] [PubMed] [Google Scholar]
- Aten JA, Stap J, Krawczyk PM, van Oven CH, Hoebe RA, Essers J, Kanaar R. Dynamics of DNA double-strand breaks revealed by clustering of damaged chromosome domains. Science. 2004;303:92–95. doi: 10.1126/science.1088845. [DOI] [PubMed] [Google Scholar]
- Bongarzone I, Butti MG, Coronelli S, Borrello MG, Santoro M, Mondellini P, Pilotti S, Fusco A, Della Porta G, Pierotti MA. Frequent activation of ret protooncogene by fusion with a new activating gene in papillary thyroid carcinomas. Cancer Res. 1994;54:2979–2985. [PubMed] [Google Scholar]
- Branco MR, Pombo A. Intermingling of chromosome territories in interphase suggests role in translocations and transcription-dependent associations. PLoS Biol. 2006;4:e138. doi: 10.1371/journal.pbio.0040138. [DOI] [PMC free article] [PubMed] [Google Scholar]
- Butti MG, Bongarzone I, Ferraresi G, Mondellini P, Borrello MG, Pierotti MA. A sequence analysis of the genomic regions involved in the rearrangements between TPM3 and NTRK1 genes producing TRK oncogenes in papillary thyroid carcinomas. Genomics. 1995;28:15–24. doi: 10.1006/geno.1995.1100. [DOI] [PubMed] [Google Scholar]
- Chubb JR, Boyle S, Perry P, Bickmore WA. Chromatin motion is constrained by association with nuclear compartments in human cells. Curr Biol. 2002;12:439–445. doi: 10.1016/s0960-9822(02)00695-4. [DOI] [PubMed] [Google Scholar]
- Ciampi R, Knauf JA, Kerler R, Gandhi M, Zhu Z, Nikiforova MN, Rabes HM, Fagin JA, Nikiforov YE. Oncogenic AKAP9-BRAF fusion is a novel mechanism of MAPK pathway activation in thyroid cancer. J Clin Invest. 2005;115:94–101. doi: 10.1172/JCI23237. [DOI] [PMC free article] [PubMed] [Google Scholar]
- Conover WJ. Practical Nonparametric Statistics. New York: John Wiley & Sons; 1971. [Google Scholar]
- Cremer T, Cremer C. Chromosome territories, nuclear architecture and gene regulation in mammalian cells. Nat Rev Genet. 2001;2:292–301. doi: 10.1038/35066075. [DOI] [PubMed] [Google Scholar]
- Cremer T, Cremer C, Baumann H, Luedtke EK, Sperling K, Teuber V, Zorn C. Rabl’s model of the interphase chromosome arrangement tested in Chinese hamster cells by premature chromosome condensation and laser-UV-microbeam experiments. Hum Genet. 1982;60:46–56. doi: 10.1007/BF00281263. [DOI] [PubMed] [Google Scholar]
- Everitt BS. Cluster Analysis. London: Edward Arnold; 1993. [Google Scholar]
- Futreal PA, Coin L, Marshall M, Down T, Hubbard T, Wooster R, Rahman N, Stratton MR. A census of human cancer genes. Nat Rev Cancer. 2004;4:177–183. doi: 10.1038/nrc1299. [DOI] [PMC free article] [PubMed] [Google Scholar]
- Gandhi M, Medvedovic M, Stringer JR, Nikiforov YE. Interphase chromosome folding determines spatial proximity of genes participating in carcinogenic RET/PTC rearrangements. Oncogene. 2006;25:2360–2366. doi: 10.1038/sj.onc.1209268. [DOI] [PubMed] [Google Scholar]
- Greco A, Mariani C, Miranda C, Pagliardini S, Pierotti MA. Characterization of the NTRK1 genomic region involved in chromosomal rearrangements generating TRK oncogenes. Genomics. 1993;18:397–400. doi: 10.1006/geno.1993.1482. [DOI] [PubMed] [Google Scholar]
- Grieco M, Santoro M, Berlingieri MT, Melillo RM, Donghi R, Bongarzone I, Pierotti MA, Della Porta G, Fusco A, Vecchio G. PTC is a novel rearranged form of the ret proto-oncogene and is frequently detected in vivo in human thyroid papillary carcinomas. Cell. 1990;60:557–563. doi: 10.1016/0092-8674(90)90659-3. [DOI] [PubMed] [Google Scholar]
- Hepperger C, Otten S, von Hase J, Dietzel S. Preservation of large-scale chromatin structure in FISH experiments. Chromosoma. 2007;116:117–133. doi: 10.1007/s00412-006-0084-2. [DOI] [PMC free article] [PubMed] [Google Scholar]
- Kozubek S, Lukasova E, Ryznar L, Kozubek M, Liskova A, Govorun RD, Krasavin EA, Horneck G. Distribution of ABL and BCR genes in cell nuclei of normal and irradiated lymphocytes. Blood. 1997;89:4537–4545. [PubMed] [Google Scholar]
- Kroll TG, Sarraf P, Pecciarini L, Chen CJ, Mueller E, Spiegelman BM, Fletcher JA. PAX8-PPARgamma1 fusion oncogene in human thyroid carcinoma [corrected] Science. 2000;289:1357–1360. doi: 10.1126/science.289.5483.1357. [DOI] [PubMed] [Google Scholar]
- Lukasova E, Kozubek S, Kozubek M, Kjeronska J, Ryznar L, Horakova J, Krahulcova E, Horneck G. Localisation and distance between ABL and BCR genes in interphase nuclei of bone marrow cells of control donors and patients with chronic myeloid leukaemia. Hum Genet. 1997;100:525–535. doi: 10.1007/s004390050547. [DOI] [PubMed] [Google Scholar]
- Manuelidis L. Individual interphase chromosome domains revealed by in situ hybridization. Hum Genet. 1985;71:288–293. doi: 10.1007/BF00388453. [DOI] [PubMed] [Google Scholar]
- Meaburn KJ, Misteli T, Soutoglou E. Spatial genome organization in the formation of chromosomal translocations. Semin Cancer Biol. 2007;17:80–90. doi: 10.1016/j.semcancer.2006.10.008. [DOI] [PMC free article] [PubMed] [Google Scholar]
- Nikiforov YE. RET/PTC rearrangement in thyroid tumors. Endocr Pathol. 2002;13:3–16. doi: 10.1385/ep:13:1:03. [DOI] [PubMed] [Google Scholar]
- Nikiforova MN, Stringer JR, Blough R, Medvedovic M, Fagin JA, Nikiforov YE. Proximity of chromosomal loci that participate in radiation-induced rearrangements in human cells. Science. 2000;290:138–141. doi: 10.1126/science.290.5489.138. [DOI] [PubMed] [Google Scholar]
- Parada L, Misteli T. Chromosome positioning in the interphase nucleus. Trends Cell Biol. 2002;12:425–432. doi: 10.1016/s0962-8924(02)02351-6. [DOI] [PubMed] [Google Scholar]
- Rippe V, Drieschner N, Meiboom M, Murua Escobar H, Bonk U, Belge G, Bullerdiek J. Identification of a gene rearranged by 2p21 aberrations in thyroid adenomas. Oncogene. 2003;22:6111–6114. doi: 10.1038/sj.onc.1206867. [DOI] [PubMed] [Google Scholar]
- Roccato E, Bressan P, Sabatella G, Rumio C, Vizzotto L, Pierotti MA, Greco A. Proximity of TPR and NTRK1 rearranging loci in human thyrocytes. Cancer Res. 2005;65:2572–2576. doi: 10.1158/0008-5472.CAN-04-4294. [DOI] [PubMed] [Google Scholar]
- Roix JJ, McQueen PG, Munson PJ, Parada LA, Misteli T. Spatial proximity of translocation-prone gene loci in human lymphomas. Nat Genet. 2003;34:287–291. doi: 10.1038/ng1177. [DOI] [PubMed] [Google Scholar]
- Santoro M, Dathan NA, Berlingieri MT, Bongarzone I, Paulin C, Grieco M, Pierotti MA, Vecchio G, Fusco A. Molecular characterization of RET/PTC3; a novel rearranged version of the RETproto-oncogene in a human thyroid papillary carcinoma. Oncogene. 1994;9:509–516. [PubMed] [Google Scholar]
- Savage JR. Cancer. Proximity matters. Science. 2000;290:62–63. doi: 10.1126/science.290.5489.62. [DOI] [PubMed] [Google Scholar]
- Solovei I, Cavallo A, Schermelleh L, Jaunin F, Scasselati C, Cmarko D, Cremer C, Fakan S, Cremer T. Spatial preservation of nuclear chromatin architecture during three-dimensional fluorescence in situ hybridization (3D-FISH) Exp Cell Res. 2002;276:10–23. doi: 10.1006/excr.2002.5513. [DOI] [PubMed] [Google Scholar]
- Solovei I, Walter J, Cremer F, Habermann L, Schermeller L, Cremer T. FISH on three-dimensionally preserved nuclei. In: Beatty B, Sabine M, Squire J, editors. FISH A Practical Approach. New York: Oxford University Press; 2002. [Google Scholar]
- Soutoglou E, Dorn JF, Sengupta K, Jasin M, Nussenzweig A, Ried T, Danuser G, Misteli T. Positional stability of single double-strand breaks in mammalian cells. Nat Cell Biol. 2007;9:675–682. doi: 10.1038/ncb1591. [DOI] [PMC free article] [PubMed] [Google Scholar]
- Vazquez J, Belmont AS, Sedat JW. Multiple regimes of constrained chromosome motion are regulated in the interphase Drosophila nucleus. Curr Biol. 2001;11:1227–1239. doi: 10.1016/s0960-9822(01)00390-6. [DOI] [PubMed] [Google Scholar]