

Abstract
Objective
Body composition and energy homeostasis are thought to affect the appetitive hormones: adiponectin, leptin, insulin, and ghrelin. This study examined whether centrally located fat and/or overall adiposity were related to these appetitive hormones in healthy postmenopausal women.
Design
Overall and regional body composition was assessed by dual-energy X ray absorptiometry in relation to plasma adiponectin, serum leptin, serum insulin, and plasma ghrelin in 242 postmenopausal women.
Results
Regression analyses revealed that the androidal-to-gynoidal fat mass ratio (18.0%), age (3.2%), and white blood cell count (1.8%) accounted for 28% of the variability in adiponectin (F = 22.2; P < 0.0001); androidal (waist + hip) fat mass (66.0%), androidal fat mass2 (6.2%), whole-body lean mass (2.2%), and age (0.8%) accounted for 69% of the variability in leptin (F = 102.5; P < 0.0001). Regression analyses revealed that sagittal abdominal diameter (8.4%), glucose (5.4%), white blood cell count (2.6%), and dietary ω-3 fatty acids (2.0%) accounted for 32% of the variability in insulin (F = 20.8; P < 0.0001); waist circumference (12.7%), hip lean mass (2.0%), and white blood cell count (1.9%) accounted for 26% of the variability in ghrelin (F = 20.7; P < 0.0001). Our results indicated that centralized fat mass was the primary contributor to these appetitive hormones in healthy postmenopausal women.
Conclusion
Since central adiposity in postmenopausal women was related to appetitive hormones, minimizing weight gain during the menopausal transition may optimize appetitive hormones, thereby facilitating appetite control and weight maintenance.
Introduction
Body composition changes become evident as women transition through menopause. These changes include an increase in overall (total body) and central adiposity (androidal region), especially visceral adipose tissue (1), and a decrease in total and central lean tissue mass (2). In particular, central adiposity in postmenopausal women is a major risk factor for developing insulin resistance (3), atherosclerotic cardiovascular disease (CVD) (4), dyslipidemia (5), hypertension (6), and breast cancer (7).
Adipose tissue is the largest endocrine organ, releasing more than 20 substances into circulation that are termed adipocytokines (also known as adipokines), such as adiponectin and leptin. Adiponectin is produced exclusively by mature adipocytes in visceral, s.c., and bone marrow fat depots (8), whereas leptin is produced mainly in s.c. adipose tissue (9). Typically, obese or insulin-resistant individuals (8), as well as those with coronary artery disease (10), have low adiponectin but elevated leptin concentrations (11). Adiponectin increases insulin sensitivity (12), exerts anti-inflammatory properties (13), and may improve the lipoprotein profile (14). Leptin signals the brain to suppress appetite, increase energy expenditure, and decrease metabolic efficiency (15). Further, ghrelin and insulin produced by the stomach and pancreas respectively, play a significant role in regulating food intake and energy homeostasis. Obese individuals who are fasting typically have low ghrelin (16), whereas insulin concentration is elevated (17) in obesity. Ghrelin, an orexigenic hormone, rises sharply before meals while insulin is low; conversely, ghrelin declines after meals while insulin rises (18). Collectively, these adipocytokines, ghrelin, and insulin are termed appetitive hormones because they affect food intake, energy homeostasis, and body composition.
Centrally located fat can be assessed using waist circumference, waist-to-hip ratio, and sagittal abdominal diameter measurements, although these methods do not distinguish between s.c. and visceral fat, the metabolically active fat that is related to disease risk. Computed tomography is considered the gold standard in assessing centrally located fat, whereas dual-energy X ray absorptiometry (DXA) provides an accurate and reliable estimate of overall and regional body composition (19) with minimal radiation exposure. However, unlike computed tomography, DXA cannot differentiate between s.c. and visceral adipose tissue because measurements are only two dimensional. Nevertheless, soft tissue analyses of DXA scans may be used to estimate visceral adipose tissue (20), as well as regional lean mass (21), by dividing the whole-body scan into subregions of interest (19).
Appetitive hormones have been studied independently for potential mechanisms, but it is important to examine these hormones collectively because they interact to regulate energy homeostasis. The hypothesis of this study was that abdominal fat would be directly related to serum leptin and serum insulin, but indirectly related to plasma adiponectin and plasma ghrelin in healthy postmenopausal women. The specific aim of this study was to determine abdominal fat (waist + hip) tissue mass using DXA and relate abdominal fat to plasma adiponectin, serum leptin, serum insulin, and plasma ghrelin concentrations in 242 healthy post-menopausal women.
Subjects and methods
Study design
Healthy postmenopausal women (45.8–65.0 years of age) were enrolled as part of a randomized, double-blind, placebo-controlled multi-center (Iowa State University (ISU), Ames, IA, USA and University of California at Davis (UC-Davis), Davis, CA, USA) NIH-funded clinical trial. This ongoing parent study (soy isoflavones for reducing bone loss; SIRBL) was designed to examine the effect of two doses of isoflavones extracted from soybeans on bone loss during 3 years in at-risk postmenopausal women. Eligible participants (non-osteoporotic, without diseases or conditions, not taking hormones or medications) were enrolled in the ongoing parent trial starting in 2003. This ancillary project is focused on overall and regional body composition using DXA in which we report only baseline data for 242 women. We excluded 13 women at UC-Davis from this analysis because they did not meet the entry criteria (11 due to a thickened endometrium, 1 with breast cancer, and 1 without a blood sample at baseline).
Subject screening, selection, and characteristics
For the parent SIRBL project, we recruited subjects throughout the state of Iowa and the Sacramento region in California primarily through direct mailing lists, stories in local newspapers, local/regional radio advertisements, as well as other recruiting avenues. We screened women who responded (N = 5255) to outreach materials initially via a telephone questionnaire to identify healthy women who went through a natural menopause (cessation of menses from 9 months to 10 years), were not experiencing excessive vasomotor symptoms, were ≤65 years of age, non-smokers, and had a body mass index (BMI, kg/m2) ranging from 18.5 to 29.9 (inclusive) to exclude women at the extremes of adiposity. We excluded vegans and high alcohol consumers (> 7 servings/week) because alcohol interferes with isoflavone metabolism. The parent SIRBL project established the inclusion/exclusion criteria; thus, we also excluded women diagnosed with chronic disease and those who had a first-degree relative with breast cancer. We also excluded women who chronically used medications, such as cholesterol-lowering or anti-hypertensive medications. Use of oral hormone or estrogen therapy, selective estrogen receptor modulators, or other hormones within the last 12 months, use of estrogen or progestogen creams or calcitonin within the last 6 months, use of antibiotics within the last 3 months, and/or any previous use of bisphosphonates were grounds for exclusion.
Women who met the initial criteria via telephone (N = 677) attended a pre-baseline appointment to determine eligibility for additional entry criteria. We measured height and weight to confirm BMI status and used DXA to assess bone mineral density (BMD) to establish eligibility. The SIRBL project is focused on prevention rather than treatment of disease; thus, we excluded women with osteopenia or osteoporosis based on lumbar spine and/or proximal femur BMD (using > 1.5 S.D. below the young adult mean as cut-off), with evidence of previous or existing spinal fractures, or with a high BMD (> 1.0 S.D. above the mean). Once a woman is qualified based on her BMD, our phlebotomist drew blood for a chemistry profile. We excluded women if their fasted blood values indicated diabetes mellitus (fasting blood glucose ≥126 mg/dl), abnormal renal (elevated creatinine), liver (elevated enzymes), and/or thyroid function or elevated lipid profile (low-density lipoprotein cholesterol > 160 mg/dl and triacylglycerol > 200 mg/dl). For this ancillary project, we included 242 women who met our entry criteria (Fig. 1).
Figure 1. Subject screening and enrolment flow chart.

aWe excluded 13 women at UC-Davis from this analysis because they did not meet entry criteria (11 due to a thickened endometrium, 1 with breast cancer, and 1 without a baseline blood sample).
The respective Institutional Review Boards (IRB) at ISU (ID# 02-199) and at UC-Davis (ID# 200210884-2) approved our study protocol, consent form, and subject-related materials. Approvals for the DXA procedures were obtained from each institution’s IRB and State Department of Public Health in Iowa and California. We obtained informed consent from all women at the start of pre-baseline screening.
Data collection
Questionnaires
At the pre-baseline visit, trained interviewers administered three questionnaires to ensure the health status of participants: health and medical history (22), reproductive history (23), and nutrition history (22). Subjects were asked to cease taking herbal therapies and/or dietary supplements prior to baseline testing. At baseline, we assessed dietary intake using a semi-quantitative food frequency questionnaire from Block Dietary Data Systems (Berkeley, CA, USA).
Body size and composition measurements
A trained anthropometrist measured standing and sitting heights (Model S100; Ayrton Corp., Prior Lake, MN, USA), weight (Abco Health-o-meter; Bridgeview, IL, USA), waist circumference, and sagittal abdominal diameter (Holtain-Kahn Abdominal Caliper; Crosswell, Crymych Dyfed, UK). Sagittal abdominal diameter was measured at the narrowest section between the small of the back and navel, with subjects relaxed in the supine position with knees bent. Body composition measurements were obtained using (Delphi W Hologic, Inc., Waltham, MA, USA) matching DXA instruments at each site and daily calibration to ensure that the instruments provided comparable results. One certified DXA operator at ISU and one at UC-Davis performed all DXA scans, with cross-training between sites to ensure comparable quality control. We standardized subject placement for the scans and adhered to the manufacturer recommendations. One operator assessed overall adiposity from the whole-body DXA scans. To assess central adiposity, one evaluator sectioned each whole-body DXA scan into waist, hip, and thigh regions based on bone landmarks (Fig. 2) (19, 24) and these regions were analyzed using special software (Discovery, version 12.3:7 Hologic Inc., Waltham, MA, USA). The waist region included the first lumbar through the fourth lumbar vertebrae. The hip region began below the fourth lumbar vertebrae and extended to the tip of the greater trochanter of the femur. Finally, the thigh region extended superiorly from the greater trochanter to the approximate midpoint between the edge of the thigh region and lateral condyle of the femur. The lateral edge of each region was extended distally to encompass all tissue. This analysis provided an estimate of the fat and lean mass within each of these three regions. The androidal-to-gynoidal fat mass ratio was calculated for each subject: waist + hip fat mass/thigh fat mass.
Figure 2.
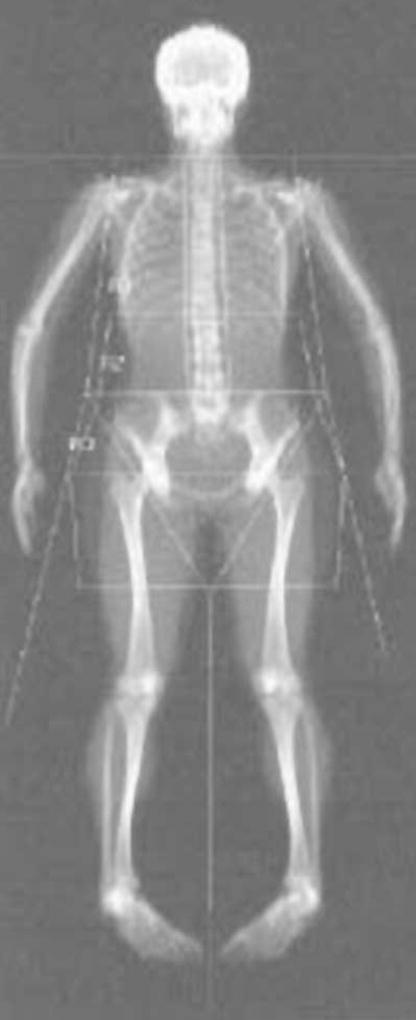
Whole-body DXA scan with regional soft tissue analysis.
Laboratory measurements
Phlebotomists collected fasted (9 h) blood samples between 0700 and 0800 h. We separated serum and plasma from whole blood by centrifuging at 1000 g for 15 min (4 °C) and stored aliquots at −80 °C until analyses. Certified clinical laboratories (LabCorp; Kansas City, KS, USA at the ISU site and the UC-Davis Medical Center Laboratory; Sacramento, CA, USA at UC-Davis site) analyzed our blood samples, including a complete blood count with differential, general chemistry panel, and thyroid screen. Adiponectin (heparinized plasma), leptin (serum), insulin (serum), and ghrelin (total) (EDTA-treated plasma) concentrations were determined in duplicate with RIA kits (Linco Research, St Charles, MO, USA) using a Cobra II series auto-gamma counting system (Packard Instrument Company; Meriden, CT, USA). We used the manufacturer-provided quality controls and in-house quality control sera/plasma for calculating intra- and inter-assay coefficient of variation (CV). The intra- and inter-assay CVs (%) for adiponectin, leptin, insulin, and ghrelin were 1.6 and 1.5, 3.0 and 2.7, 2.3 and 4.0, and 3.4 and 3.1 respectively.
Statistical analyses
Statistical analyses were performed using SAS (version 9.1; Cary, NC, USA) with results considered statistically significant at P≤ 0.05. The exception was that to account for numerous tests of normality, we considered data to be normally distributed if P> 0.0001. Descriptive statistics included means±S.D. for normally distributed data and medians for data that were not normally distributed, with range provided for each variable. Ghrelin and leptin were log transformed prior to the regression analyses because the residual analysis indicated non-constant error variance, thus violating model assumptions. We did not log transform adiponectin since its residual plot did not indicate any violations of the linear regression model assumptions. Based on residual analysis, adding a quadratic term (androidal fat mass2) to the leptin model improved the residual plot, but adding a higher order term to the other models was not beneficial. Classes of variables in modeling the outcomes of interest included independent variables that were biologically plausible and/or significantly related using Pearson correlation analysis. We used stepwise regression analyses to assess the combined contribution of independent variables to adiponectin, leptin, insulin, and ghrelin. Classes of variables in modeling each of these four outcomes included: age or years since menopause, overall adiposity (whole-body fat mass or weight), indices of centralized fat mass (waist circumference, sagittal abdominal diameter, waist fat mass, hip fat mass, androidal (waist + hip) fat mass, or androidal/gynoidal fat mass ratio), whole-body lean mass, indices of centralized lean mass (waist lean mass, hip lean mass, thigh lean mass, and hip circumference), likelihood of concomitant infection (reflected in white blood cell count), physical activity, energy intake-related factors (total saturated fatty acids, total oleic fatty acids, and total ω-3 fatty acids), and total dietary protein. Each model included site as an obligatory variable to account for potential study site differences. In modeling each outcome, we removed variables that exhibited multi-collinearity as indicated by the variance inflation factor. The variance inflation factor measures the impact of collinearity among the independent variables in a regression model and the degree to which multicollinearity degrades the precision estimate. A value exceeding 10 is of concern, but in weaker regression models, a value exceeding 2.5 may be cause for concern (25).
Results
Subject characteristics
The analysis included 242 healthy postmenopausal women. The baseline characteristics of women are presented in Table 1. Women ranged from 45.9 to 65.5 years of age and from 0.8 to 10.0 years since menopause. We enrolled three African American (1%), one Native Hawaiian (< 1%), one Native American (< 1%), three Asians (1%), seven women of more than one race (3%), two of unknown race (< 1%), and two who chose not to report race (< 1%); the remaining women were Caucasian (92%). Women had a wide range (17.8–32.7) of BMI values because the UC-Davis site enrolled nine women beyond our BMI inclusion criteria. Approximately half of the women had a BMI < 25.0 kg/m2. Overall and regional body composition as assessed by DXA (Table 1) indicated wide variability in both overall and regional body fat measures among these women. The median values for dietary intake are listed in Table 2 illustrating wide variability of these nutrients. Values for circulating analytes are presented in Table 3, demonstrating that mean or median values were within the range reported in the literature.
Table 1.
Characteristics of subjectsa at baseline.
| Mean±S.D. | Range | |
|---|---|---|
| Age (years)b | 54.6±3.4 | 45.9–65.5 |
| Years since menopauseb | 3.5±2.0 | 0.8–10.0 |
| Body size | ||
| Weight (kg) | 67.7±9.3 | 43.7–94.5 |
| Height (cm) | 164.7±6.3 | 146.3–182.2 |
| BMI (kg/m2) | 24.9±3.1 | 17.8–32.7 |
| Waist circumference (cm) | 77.9±8.0 | 59.1–100.6 |
| Hip circumference (cm) | 100.3±6.8 | 80.9–118.2 |
| Waist-to-hip ratio | 0.8±0.1 | 0.6–0.9 |
| Sagittal abdominal diameter (cm) | 18.6±2.3 | 11.0–25.2 |
| Overall body compositionb | ||
| Fat mass (kg) | 23.26±6.35 | 8.05–47.78 |
| Fat mass (%) | 34.5±5.7 | 18.1–55.9 |
| Lean mass (kg) | 43.18±4.60 | 29.49–55.59 |
| Regional body compositionb | ||
| Waist fat (kg) | 2.37±1.10 | 0.39–5.59 |
| Waist fat (%) | 28.6±8.7 | 7.1–52.5 |
| Hip fat (kg) | 3.38±1.05 | 0.72–6.41 |
| Hip fat (%) | 32.9±5.9 | 12.1–51.6 |
| Thigh fat (kg) | 5.28±1.34 | 2.12–10.85 |
| Thigh fat (%) | 38.7±5.0 | 24.2–59.7 |
| Androidal (waist + hip) fat (kg) | 5.75±2.06 | 1.12–11.78 |
| Androidal-to-gynoidal fat mass | 1.09±0.30 | 0.46–2.21 |
| ratio | ||
| Waist lean (kg) | 5.53±0.72 | 3.50–7.52 |
| Hip lean (kg) | 6.71±0.93 | 4.13–9.23 |
| Thigh lean (kg) | 8.20±1.04 | 4.85–11.42 |
Number of subjects = 242 for all variables, except sagittal abdominal diameter (N = 237) because five of these values were missing due to instrument malfunction.
Assessed by dual-energy X ray absorptiometry (DXA).
Table 2.
Dietary intake of subjectsa at baseline.
| Nutrient intake from foodb,c | Median | Range |
|---|---|---|
| Total energy (kJ) | 6455 | 1772–19 096 |
| Carbohydrate (g) | 175 | 27–476 |
| Protein (g) | 61 | 15–168 |
| Total fat (g) | 65 | 17–247 |
| Saturated fat (g) | 19 | 5–65 |
| Trans saturated fat (g) | 5 | 0.8–25 |
| Oleic fatty acidd (g) | 25 | 6–97 |
| Linoleic fatty acidd (g) | 16 | 3–70 |
| Total ω-3 fatty acid (g) | 1.4 | 0.3–5 |
| Fiber (g) | 16 | 4–49 |
The number of subjects was 242 for all variables.
Reported from semi-quantitative food frequency questionnaire.
Distributions for these variables were not normal and thus median values are reported.
Represents monounsaturated and polyunsaturated fatty acids respectively.
Table 3.
Circulating analytes of subjectsa at baseline.
| Analyte | Mean±S.D. | Median | Range | Reference range |
|---|---|---|---|---|
| Plasma adiponectin (μg/ml)b | 17.3 | 3.2–37.1 | 5.0–30.5c | |
| Serum leptin (ng/ml)b | 12.8 | 2.6–34.9 | 2.0–54.0c | |
| Plasma ghrelin (pg/ml)b | 938 | 345–2383 (713–1198)d | 995–1794d | |
| Serum insulin (μU/ml)e | 11.6±5.4 | 0.1–36.1 | 5.0–24.0f | |
| Serum glucose (mg/dl)e | 85.5±8.8 | 57.0–117.0 | 82.0–116.0f | |
| White blood cell count (×109/l)a,e | 5.07±1.03 | 2.3–8.4 | 4.5–11.0g |
Number of subjects = 242 for the adipocytokines, ghrelin, insulin, and glucose; number of subjects = 237 for white blood cell count.
Distributions were not normal; thus, median values are reported.
Reference range reported for healthy postmenopausal women (35).
Interquartile range for study participants in comparison with interquartile range reported for postmenopausal women (39).
Distributions were normal; thus, mean±S.D. are reported.
Reference range reported for healthy postmenopausal women (3).
Reference range reported for adults (40).
Correlation analyses
The Pearson correlation analysis indicated a negative association between adiponectin and leptin (r = −0.35, P≤0.0001) and insulin (r = −0.33, P ≤ 0.0001), but a positive association between adiponectin and ghrelin (r = 0.29, P ≤ 0.0001). As expected, we confirmed a positive association between leptin and insulin (r = 0.44, P ≤ 0.0001) and glucose (r = 0.23, P = 0.0004), but a negative association between leptin and ghrelin (r = −0.34, P ≤ 0.0001). There was a negative relationship between ghrelin and insulin (r = −0.24, P = 0.0002) and glucose (r = −0.15, P = 0.02), but a positive association between insulin and glucose (r = 0.38, P ≤ 0.0001).
Regression analyses
We performed regression analyses to examine the independent factors contributing to the variability in adiponectin, leptin, insulin, and ghrelin as our primary outcomes (Table 4). Because the UC-Davis site enrolled eight women whose BMI was >29.9, we explored the possibility that excluding these eight subjects might produce different results by performing the regression analyses with and without these subjects. However, excluding these women did not alter the interpretation of data in any of these four models. The overall model R2 and F values for each model either decreased or did not appreciably change, nor were the percentage variance for the independent variables altered. Thus, we retained all subjects, whose BMI ranged from 17.8 to 32.7. No notable multicollinearities emerged among the independent variables, as indicated by the low (< 2) variance inflation factors in all regression models. Residual analyses indicated that the model assumptions of normality of error terms and homogeneity of residual variance were satisfied for the final regression models. Geographic site was significant in the adiponectin (P = 0.0024), insulin (P = 0.017), and ghrelin (P = 0.0003) models, but not for leptin (P = 0.59). After variable elimination was completed, multiple regression analyses revealed that the androidal-to-gynoidal fat mass ratio (18.0%), age (3.2%), and white blood cell count (1.8%) accounted for 28% of the variability in adiponectin (F = 22.2, P ≤ 0.0001). Regression analyses revealed that androidal (waist + hip) fat mass (66.0%), androidal fat mass2 (6.2%), whole-body lean mass (2.2%), and age (0.8%) accounted for 69% of the variability in leptin (F = 102.5, P ≤ 0.0001). Regression analyses revealed that sagittal abdominal diameter (8.4%), glucose (5.4%), white blood cell count (2.6%), and ω-3 fatty acids (2.0%) accounted for 32% of the variability in insulin (F = 20.8, P≤0.0001). Regression analyses indicated that waist circumference (12.7%), hip lean mass (2.0%), and white blood cell count (1.9%) accounted for 26% of the variability in ghrelin (F = 20.7, P≤0.0001).
Table 4.
Regression analyses: contributors to appetitive hormones.
| Parameter | Parameter estimate | Percentage varianceb | P valuec | Variance inflation factord |
|---|---|---|---|---|
| Adiponectina | ||||
| Overall model R2 = 27.7% (Adj R2 = 26.4%) (F = 22.19; df = (4232)) P≤0.0001 | ||||
| Intercept | 16.93727 | 0.0026 | ||
| Study site | −2.10013 | 2.9 | 0.0024 | 1.07 |
| And/Gyn fat mass | −8.80741 | 18.0 | ≤0.0001 | 1.10 |
| Age | 0.31884 | 3.2 | 0.0017 | 1.04 |
| White blood cell count | −0.81601 | 1.8 | 0.018 | 1.13 |
| Leptine,f | ||||
| Overall model R2 = 68.5% (Adj R2 = 67.8%) (F = 102.51; df = (5236)) P≤0.0001 | ||||
| Intercept | 2.84103 | ≤0.0001 | ||
| Study site | −0.02111 | 0.04 | 0.5929 | 1.01 |
| Androidal fat mass | 0.00023957 | 66.0 | ≤0.0001 | 1.28 |
| Androidal fat mass2 | −2.47059×10⁻⁸ | 6.2 | ≤0.0001 | 1.13 |
| Whole-body lean mass | −0.00001834 | 2.2 | ≤0.0001 | 1.13 |
| Age | −0.01434 | 0.8 | 0.0147 | 1.03 |
| Insuling | ||||
| Overall model R2 = 31.5% (Adj R2 = 30.0%) (F = 20.82; df = (5226)) P≤0.0001 | ||||
| Intercept | −15.70447 | ≤0.0001 | ||
| Study site | −1.50451 | 1.7 | 0.017 | 1.09 |
| Sagittal abdominal diameter | 0.71995 | 8.4 | ≤0.0001 | 1.14 |
| Glucose | 0.15127 | 5.4 | ≤0.0001 | 1.14 |
| White blood cell count | 0.93610 | 2.6 | 0.0038 | 1.22 |
| ω-3 Fatty acids | −0.94795 | 2.0 | 0.011 | 1.05 |
| Ghrelina,f | ||||
| Overall model R2 = 26.3% (Adj R2 = 25.0%) (F = 20.67; df = (4232)) P≤0.0001 | ||||
| Intercept | 8.64936 | ≤0.0001 | ||
| Study site | −0.17405 | 4.3 | 0.0003 | 1.13 |
| Waist circumference | −0.02269 | 12.7 | ≤0.0001 | 1.61 |
| Hip lean mass | 0.00007417 | 2.0 | 0.013 | 1.50 |
| White blood cell count | −0.05657 | 1.9 | 0.015 | 1.13 |
N = 237 for the adiponectin and ghrelin models because five women were missing CBC values.
Squared semi-partial type II correlation coefficient; accounts for shared variance among variables.
Variables (except site) left in the model were significant at P≤0.10 level.
Measures the impact of collinearity among the independent variables in a regression equation and the degree to which multicollinearity degrades the precision estimate.
N = 242 for the leptin model.
Leptin and ghrelin were log transformed because they were not normally distributed.
N = 232 for the insulin model because five women were missing CBC values and five women were missing sagittal abdominal diameter measurements.
Discussion
This study is unique in that we used a regional analysis of whole-body DXA scans to examine central fat and lean mass, rather than the standard DXA analysis to estimate overall fat and lean mass. Our results indicated that centralized body fat (androidal-to-gynoidal fat mass ratio, androidal fat mass, sagittal abdominal diameter, or waist circumference respectively) was the largest contributor to each circulating appetitive hormone: adiponectin, leptin, insulin, or ghrelin in healthy postmenopausal women. As expected, the relationship of centralized body fat to leptin and insulin was positive, but negative to adiponectin and ghrelin. We confirmed previous findings (21, 26–28) of a relationship between measures of central adiposity and adiponectin, leptin, and insulin in healthy post-menopausal women. However, unlike previous studies, we found a strong negative relationship between central adiposity (reflected by waist circumference) and ghrelin in these women. Recent research (29) has reported a strong negative relationship between waist circumference and ghrelin in younger (< 30 years), but not in mid-life (aged 30–56 years) women. Furthermore, in a study of 79 adult opposite-sex twin pairs, Makovey et al. (30) found a weak relationship between abdominal fat mass assessed by DXA and ghrelin in women, whereas this relationship in men was strong. Further research is needed to understand the response of ghrelin to central adiposity, particularly in postmenopausal women. We also confirmed the findings of other studies that postmenopausal women with a higher level of adiposity have higher concentrations of both leptin (21, 31) and insulin (28), but a lower adiponectin concentration (8).
Although lean tissue is typically not considered in central body composition assessment, it is important to assess because it is metabolically active. Limited data comparing pre- versus postmenopausal women suggest a decline in both overall and centralized lean tissue with menopause (2). However, few studies have examined lean tissue in relation to appetitive hormones. Because a higher body weight requires greater muscle mass for movement, a higher fat mass has been associated with higher lean mass, mainly localized in the legs, but with a decrease in overall lean/fat ratio (32). We found that leptin and ghrelin were the two appetitive hormones related to lean mass in the regression models, with a significant negative relationship between leptin and whole-body lean mass and positive relationship between ghrelin and hip lean mass. However, we hypothesized that because of the direct relationship between overall fat and lean mass, leptin, ghrelin, and insulin would be directly related to lean mass in the thigh region, whereas adiponectin would be indirectly related. Although the Pearson correlation analysis indicated that leptin was positively related to whole-body lean mass, the direction of the relationship was altered once we took other factors into account. In probing a possible explanation, we found that in the presence of androidal fat mass, the direction of the relationship between whole-body lean mass and leptin may have changed because the simple correlation (positive) between lean mass and leptin was fairly weak (r = 0.14, P = 0.028), whereas the correlation (positive) between androidal fat mass and leptin was strong (r = 0.77, P≤0.0001). It seemed that androidal fat mass thereby exerted a dominant effect in the regression model. Similar to our findings using correlation analysis, Mahabir et al. (21) recently found that a higher lean mass was associated with a higher leptin concentration, but they did not take other factors into account. Their participants were older (age range 49.2–78.8 years), tended toward the higher end of adiposity (ranged from underweight to morbidly obese status with BMI range 17.7–42.5 kg/m2) and were further from menopause (up to 38 years postmenopausal) than the women in our study. Research is needed to examine the relationship between lean mass and appetitive hormones.
Interestingly, our results suggest that white blood cell count was related to adiponectin, ghrelin, and insulin. White blood cell count is typically used as an indicator of infection or inflammation. To our knowledge, none of our women had an infection during baseline testing and no women exhibited an elevated white blood cell count (> 11×109/l). Research has indicated that white blood cell count is related to body fat in humans (33), suggesting that adipocytokines may be involved in the adipocyte-induced inflammatory response. Further, Vozarova et al. (34) found that with a high white blood cell count, insulin sensitivity declined in non-diabetic Pima Indians. Although we did not assess insulin sensitivity, our study found a positive relationship between white blood cell count and circulating insulin in the regression model. Collectively, these studies suggest that white blood cells may reflect an obesity-induced inflammatory state that is also mirrored by the appetitive hormones. The context of our study is important because the majority of these women, except for eight women at UC-Davis whose BMI was ≥30.0, were not considered obese based upon BMI (ranged from 17.8 to 32.7). This suggested that modestly elevated (but still within normal range) white blood cell count, elevated insulin, and low adiponectin is an unfavorable metabolic profile in overweight postmenopausal women. In our study, we had two women who had adiponectin concentrations below the reference range (5.0–30.5 μg/ml) for healthy postmenopausal women (35) and six women who had a higher insulin concentration than the upper limit of the reference range (5.0–24.0 μU/ml) (3). However, none of our women were beyond the reference range for white blood cell count.
Our study suggests that age influenced adiponectin and leptin, but not ghrelin or insulin, concentrations in healthy postmenopausal women. Based on the regression models, we noted a positive relationship between age and adiponectin, confirming recently reported results (36) in similarly aged (45–62 years) subjects. By contrast, but similar to our findings, Ostlund et al. (31) noted an inverse relationship between age and leptin, attributing this finding to decreased leptin production from adipose tissue and/or increased leptin clearance with increasing age. As expected, fasting glucose was an important (positive) contributor to insulin, second to sagittal abdominal diameter. Interestingly, ω-3 fatty acid concentration was the only dietary factor that emerged as significant in any of the regression models. Lombardo et al. (37) have suggested that in a rat model, dietary polyunsaturated fatty acids may enhance insulin sensitivity, thereby improving the lipoprotein profile and decreasing CVD risk. Increased CVD risk is related to insulin resistance because it contributes to dyslipidemia (38). We also noted relationships among the appetitive hormones. Adiponectin was inversely related to leptin, which is consistent with some (11, 36) but not all studies (26). A low concentration of adiponectin but a high concentration of leptin has been related to an increased risk of insulin resistance (11). Likewise, we found that leptin was significantly and positively related to insulin in these non-diabetic healthy postmenopausal women, prior to emergence of disease. Furthermore, similar to Purnell et al. (27), we confirmed that ghrelin was negatively associated with insulin. The associations among these appetitive hormones are not fully understood, but adiponectin, leptin, and ghrelin may be early indicators of insulin resistance in overweight but healthy postmenopausal women.
Study site was a significant factor in the adiponectin, insulin, and ghrelin models, also evidenced by statistical differences (P≤0.0001) in mean values between study sites, possibly related to the somewhat greater (P = 0.077) variability in whole-body fat mass in the women at UC-Davis (8.05–47.77 kg) compared with those at ISU (8.43–37.01 kg). Our entry criteria was designed to exclude women with a BMI≥30.0, although eight women at UC-Davis did not meet this criterion but had a BMI > 29.9. Despite no difference (P = 0.97) in the mean value for BMI between sites, we noted a lack of homogeneity of variance (P = 0.0030) in BMI with respect to site, likely due to the women at UC-Davis whose BMI ranged from 30 to 32.7. We suspect that this wider range in body size and adiposity at UC-Davis likely contributed to the significant site difference in adiponectin, insulin, and ghrelin in these regression models.
This study was hypothesis generating and could not determine cause and effect because it was cross-sectional. In addition, the participants in this study were healthy postmenopausal women, primarily of Caucasian descent. Thus, our results cannot be generalized to all women across ethnic groups. Since central adiposity in postmenopausal women was related to appetitive hormones, despite the apparent health of these women, minimizing weight gain during the menopausal transition may optimize appetitive hormones, thereby facilitating appetite control and weight maintenance. Additional studies are needed to determine at what level central adiposity should be maintained to optimally affect these appetitive hormones, thus potentially preventing further gain in centralized fat with menopause.
Acknowledgments
We would like to thank each participant who volunteered for this study. We would also like to thank our phlebotomists, Cindy Kruckenberg, Marilyn Chrusciel, and Shirley Nelson, as well as our undergraduate research assistants who assisted with many aspects of this project. The overall project described was supported by a grant (RO1 AR046922 A2) from the National Institute of Arthritis and Musculoskeletal and Skin Diseases (NIAMS). The project was also supported by a grant (P01 ES012020) from the National Institute of Environmental Health Sciences (NIEHS) and the Office of Dietary Supplements (ODS), and by a grant (95P50AT004155) from the National Center of Complementary and Alternative Medicine (NCCAM) and ODS of the National Institutes of Health. The project was supported by USDA, ARS, Western Human Nutrition Research Center, and the CTSC Clinical Research Center at the University of California (1M01RR19975-01). Its contents are solely the responsibility of the authors and do not necessarily represent the official views of these agencies.
Contributor Information
Laura M Ritland, Human Metabolic Unit, Department of Food Science and Human Nutrition, Iowa State University, 1115 Human Nutritional Sciences Building, Ames, Iowa 50011, USA.
D Lee Alekel, Human Metabolic Unit, Department of Food Science and Human Nutrition, Iowa State University, 1115 Human Nutritional Sciences Building, Ames, Iowa 50011, USA.
Oksana A Matvienko, School of Health, Physical Education, and Leisure Services, University of Northern Iowa, Cedar Falls, Iowa 50614, USA.
Kathy B Hanson, Human Metabolic Unit, Department of Food Science and Human Nutrition, Iowa State University, 1115 Human Nutritional Sciences Building, Ames, Iowa 50011, USA.
Jeanne W Stewart, Human Metabolic Unit, Department of Food Science and Human Nutrition, Iowa State University, 1115 Human Nutritional Sciences Building, Ames, Iowa 50011, USA.
Laura N Hanson, Human Metabolic Unit, Department of Food Science and Human Nutrition, Iowa State University, 1115 Human Nutritional Sciences Building, Ames, Iowa 50011, USA.
Manju B Reddy, Human Metabolic Unit, Department of Food Science and Human Nutrition, Iowa State University, 1115 Human Nutritional Sciences Building, Ames, Iowa 50011, USA.
Marta D Van Loan, USDA ARS, Western Human Nutrition Research Center, University of California, Davis, California 95616, USA.
Ulrike Genschel, Department of Statistics, Iowa State University, Ames, Iowa 50011, USA.
References
- 1.Ley CJ, Lees B, Stevenson JC. Sex- and menopause-associated changes in body-fat distribution. American Journal of Clinical Nutrition. 1992;55:950–954. doi: 10.1093/ajcn/55.5.950. [DOI] [PubMed] [Google Scholar]
- 2.Douchi T, Yamamoto S, Yoshimitsu N, Andoh T, Matsuo T, Nagata Y. Relative contribution of aging and menopause to changes in lean and fat mass in segmental regions. Maturitas. 2002;42:301–306. doi: 10.1016/s0378-5122(02)00161-5. [DOI] [PubMed] [Google Scholar]
- 3.Lee CC, Kasa-Vubu JZ, Supiano MA. Androgenicity and obesity are independently associated with insulin sensitivity in post-menopausal women. Metabolism. 2004;53:507–512. doi: 10.1016/j.metabol.2003.10.018. [DOI] [PubMed] [Google Scholar]
- 4.Carr MC. The emergence of the metabolic syndrome with menopause. Journal of Clinical Endocrinology and Metabolism. 2003;88:2404–2411. doi: 10.1210/jc.2003-030242. [DOI] [PubMed] [Google Scholar]
- 5.Schnatz PF, Schnatz JD. Dyslipidemia in menopause: mechanisms and management. Obstetrical and Gynecological Survey. 2006;61:608–613. doi: 10.1097/01.ogx.0000235502.95332.54. [DOI] [PubMed] [Google Scholar]
- 6.Reckelhoff JF, Fortepiani LA. Novel mechanisms responsible for postmenopausal hypertension. Hypertension. 2004;43:918–923. doi: 10.1161/01.HYP.0000124670.03674.15. [DOI] [PubMed] [Google Scholar]
- 7.Sellers TA, Kushi LH, Potter JD, Kaye SA, Nelson CL, McGovern PG, Folsom AR. Effect of family history, body-fat distribution, and reproductive factors on the risk of postmenopausal breast cancer. New England Journal of Medicine. 1992;327:958–969. doi: 10.1056/NEJM199205143262004. [DOI] [PubMed] [Google Scholar]
- 8.Weyer C, Funahashi T, Tanaka S, Hotta K, Matsuzawa Y, Pratley RE, Tataranni PA. Hypoadiponectinemia in obesity and type 2 diabetes: close association with insulin resistance and hyperinsulinemia. Journal of Clinical Endocrinology and Metabolism. 2001;86:1930–1935. doi: 10.1210/jcem.86.5.7463. [DOI] [PubMed] [Google Scholar]
- 9.Faraj M, Havel PJ, Phelis S, Blanck D, Snideman AD, Cianflone K. Plasma acylation-stimulating protein, adiponectin, leptin, and ghrelin before and after weight loss induced by gastric bypass surgery in morbidly obese subjects. Journal of Clinical Endocrinology and Metabolism. 2003;88:1594–1602. doi: 10.1210/jc.2002-021309. [DOI] [PubMed] [Google Scholar]
- 10.Hotta K, Funahashi T, Arita Y, Takahashi M, Matsuda M, Okamoto Y, Iwahashi H, Kuriyama H, Ouchi N, Maeda K, Nishida M, Kihara S, Sakai N, Nakajuma T, Hasegawa K, Muraguchi M, Ohmoto Y, Nakamura T, Yamashita S, Hanafusa T, Matsuzawa Y. Plasma concentrations of a novel, adipose-specific protein, adiponectin, in type 2 diabetic patients. Arteriosclerosis, Thrombosis, and Vascular Biology. 2000;20:1565–1569. doi: 10.1161/01.atv.20.6.1595. [DOI] [PubMed] [Google Scholar]
- 11.Matsubara M, Maruoka S, Katayose S. Inverse relationship between plasma adiponectin and leptin concentrations in normal-weight and obese women. European Journal of Endocrinology. 2002;147:173–180. doi: 10.1530/eje.0.1470173. [DOI] [PubMed] [Google Scholar]
- 12.Yamauchi T, Kamon J, Minokoshi Y, Ito Y, Waki H, Uchida S, Yamashita S, Noda M, Kita S, Ueki K, Eto K, Akanuma Y, Froguel P, Foufelle F, Ferre P, Carling D, Kimura S, Nagai R, Kahn BB, Kadowaki T. Adiponectin stimulates glucose utilization and fatty acid oxidation by activating AMP-activated protein kinase. Nature Medicine. 2002;8:1288–1295. doi: 10.1038/nm788. [DOI] [PubMed] [Google Scholar]
- 13.Yokota T, Oritani K, Takahashi I, Ishikawa J, Matsuyama A, Ouchi N, Kihara S, Funahashi T, Tenner AJ, Tomiyama Y, Matsuzawa Y. Adiponectin, a new member of the family of soluble defense collagens, negatively regulates the growth of myelomonocytic progenitors and the function of macrophages. Blood. 2000;96:1723–1732. [PubMed] [Google Scholar]
- 14.Rothenbacher D, Brenner H, Marz W, Koenig W. Adiponectin, risk of coronary heart disease and correlations with cardiovascular risk markers. European Heart Journal. 2005;26:1640–1646. doi: 10.1093/eurheartj/ehi340. [DOI] [PubMed] [Google Scholar]
- 15.Otero M, Lago R, Lago F, Casanueva FF, Dieguez C, Gomez-Reino JJ, Gualillo O. Leptin, from fat to inflammation: old questions and new insights. FEBS Letters. 2005;579:295–301. doi: 10.1016/j.febslet.2004.11.024. [DOI] [PubMed] [Google Scholar]
- 16.Hansen TK, Dall R, Hosoda H, Kojima M, Kangawa K, Christiansen JS, Jorgensen JO. Weight loss increases circulating levels of ghrelin in human obesity. Clinical Endocrinology. 2002;56:203–206. doi: 10.1046/j.0300-0664.2001.01456.x. [DOI] [PubMed] [Google Scholar]
- 17.Evans DJ, Hoffmann RG, Kalkhoff RK, Kissebah AH. Relationship of body fat topography to insulin sensitivity and metabolic profiles in premenopausal women. Metabolism. 1984;33:68–75. doi: 10.1016/0026-0495(84)90164-1. [DOI] [PubMed] [Google Scholar]
- 18.Cummings DE, Frayo RS, Marmonier C, Aubert R, Chapelot D. A preprandial rise in plasma ghrelin levels suggests a role in meal initiation in humans. Diabetes. 2001;50:1714–1719. doi: 10.2337/diabetes.50.8.1714. [DOI] [PubMed] [Google Scholar]
- 19.Glickman SG, Marn CS, Supiano MA, Dengel DR. Validity and reliability of dual-energy X-ray absorptiometry for the assessment of abdominal adiposity. Journal of Applied Physiology. 2004;97:509–514. doi: 10.1152/japplphysiol.01234.2003. [DOI] [PubMed] [Google Scholar]
- 20.Park YW, Heymsfield SB, Gallagher D. Are dual-energy X-ray absorptiometry regional estimates associated with visceral adipose tissue mass? International Journal of Obesity. 2002;26:978–983. doi: 10.1038/sj.ijo.0801982. [DOI] [PubMed] [Google Scholar]
- 21.Mahabir S, Baer D, Johnson LL, Roth M, Campbell W, Clevidence B, Taylor PR. Body mass index, percent body fat, and regional body fat distribution in relation to leptin concentrations in healthy, non-smoking postmenopausal women in a feeding study. Nutrition Journal. 2007:63. doi: 10.1186/1475-2891-6-3. [DOI] [PMC free article] [PubMed] [Google Scholar]
- 22.Alekel DL, St Germain A, Peterson CT, Hanson KB, Stewart JW, Toda T. Isoflavone-rich soy protein isolate attenuates bone loss in the lumbar spine of perimenopausal women. American Journal of Clinical Nutrition. 2000;72:844–852. doi: 10.1093/ajcn/72.3.844. [DOI] [PubMed] [Google Scholar]
- 23.Morabia A, Costanza MC. International variability in ages at menarche, first live birth, and menopause: World Health Organization collaborative study of neoplasia and steroid contraceptives. American Journal of Epidemiology. 1998;148:1195–1205. doi: 10.1093/oxfordjournals.aje.a009609. [DOI] [PubMed] [Google Scholar]
- 24.Moeller LE, Peterson CT, Hanson KB, Dent SB, Lewis DS, King DS, Alekel DL. Isoflavone-rich soy protein prevents loss of hip lean mass but does not prevent the shift in regional fat distribution in perimenopausal women. Menopause. 2003;10:322–331. doi: 10.1097/01.GME.0000054763.94658.FD. [DOI] [PubMed] [Google Scholar]
- 25.Allison PD. Logistic Regression using the SAS System: Theory and Application. SAS Institute Inc.; Cary, NC: 1999. Multicollinearity. [Google Scholar]
- 26.Gavrila A, Chan JL, Yiannakouris N, Kontogianni M, Miller LC, Orlova C, Mantzoros CS. Serum adiponectin levels are inversely associated with overall and central fat distribution but are not directly regulated by acute fasting or leptin administration in humans: cross-sectional and interventional studies. Journal of Clinical Endocrinology and Metabolism. 2003;88:4823–4831. doi: 10.1210/jc.2003-030214. [DOI] [PubMed] [Google Scholar]
- 27.Purnell JQ, Weigle DS, Breen P, Cummings DE. Ghrelin levels correlate with insulin levels, insulin resistance, and high-density lipoprotein cholesterol, but not with gender, menopausal status, or cortisol levels in humans. Journal of Clinical Endocrinology and Metabolism. 2003;88:5747–5752. doi: 10.1210/jc.2003-030513. [DOI] [PubMed] [Google Scholar]
- 28.Lovegrove JA, Silva KDRR, Wright JW, Williams CM. Adiposity, insulin, and lipid metabolism in postmenopausal women. International Journal of Obesity. 2002;26:475–486. doi: 10.1038/sj.ijo.0801963. [DOI] [PubMed] [Google Scholar]
- 29.Schutte AE, Huisman HW, Schutte R, van Rooyen JM, Malan L, Malan NT. Aging influences the level and functions of fasting plasma ghrelin levels: the POWIRS-study. Regulatory Peptides. 2007;139:65–71. doi: 10.1016/j.regpep.2006.10.006. [DOI] [PubMed] [Google Scholar]
- 30.Makovey J, Naganathan V, Seibel M, Sambrook P. Gender differences in plasma ghrelin and its relations to body composition and bone – an opposite-sex twin study. Clinical Endocrinology. 2007;66:530–537. doi: 10.1111/j.1365-2265.2007.02768.x. [DOI] [PubMed] [Google Scholar]
- 31.Ostlund RE, Jr, Yang JW, Klein S, Gingerich R. Relation between plasma leptin concentration and body fat, gender, diet, age, and metabolic covariates. Journal of Clinical Endocrinology and Metabolism. 1996;81:3909–3913. doi: 10.1210/jcem.81.11.8923837. [DOI] [PubMed] [Google Scholar]
- 32.Lebrun CE, van der Schouw YT, de Jong FH, Grobbee DE, Lamberts SW. Fat mass rather than muscle strength is the major determinant of physical function and disability in postmenopausal women younger than 75 years of age. Menopause. 2006;13:474–481. doi: 10.1097/01.gme.0000222331.23478.ec. [DOI] [PubMed] [Google Scholar]
- 33.Womack J, Tien PC, Feldman J, Shin JH, Fennie K, Anastos K, Cohen MH, Bacon MC, Minkoff H. Obesity and immune cell counts in women. Metabolism: Clinical and Experimental. 2007;56:998–1004. doi: 10.1016/j.metabol.2007.03.008. [DOI] [PMC free article] [PubMed] [Google Scholar]
- 34.Vozarova B, Weyer C, Lindsay RS, Pratley RE, Bogardus C, Tataranni PA. High white blood cell count is associated with a worsening of insulin sensitivity and predicts the development of type 2 diabetes. Diabetes. 2002;51:455–461. doi: 10.2337/diabetes.51.2.455. [DOI] [PubMed] [Google Scholar]
- 35.Rolland YM, Perry HMIII, Patrick P, Banks WA, Morley JE. Leptin and adiponectin levels in middle-aged postmenopausal women: associations with lifestyle habits, hormones, and inflammatory markers – a cross-sectional study. Metabolism: Clinical and Experimental. 2006;55:1630–1636. doi: 10.1016/j.metabol.2006.07.026. [DOI] [PubMed] [Google Scholar]
- 36.Jurimae J, Jurimae T. Plasma adiponectin concentration in healthy pre- and postmenopausal women: relationship with body composition, bone mineral, and metabolic variables. American Journal of Physiology-Endocrinology and Metabolism. 2007;293:E42–E47. doi: 10.1152/ajpendo.00610.2006. [DOI] [PubMed] [Google Scholar]
- 37.Lombardo YB, Hein G, Chicco A. Metabolic syndrome: effects of n-3 PUFAs on a model of dyslipidemia, insulin resistance and adiposity. Lipids. 2007;42:427–437. doi: 10.1007/s11745-007-3039-3. [DOI] [PubMed] [Google Scholar]
- 38.Kim J, Montagnani M, Koh KK, Quon MJ. Reciprocal relationships between insulin resistance and endothelial dysfunction: molecular and pathophysiological mechanisms. Circulation. 2006;113:1888–1904. doi: 10.1161/CIRCULATIONAHA.105.563213. [DOI] [PubMed] [Google Scholar]
- 39.Weiss LA, Langenberg C, Barrett-Conner E. Ghrelin and bone: is there an association in older adults?: the Rancho Bernardo Study. Journal of Bone and Mineral Research. 2006;21:752–757. doi: 10.1359/jbmr.060209. [DOI] [PubMed] [Google Scholar]
- 40.DeMott RW. Hematology. In: Jacobs DS, Demott WR, Grady HJ, Horvat RT, Huestis DW, Kasten BL, editors. Laboratory Test Handbook. 4. Hudson, OH: Lexi-Comp Inc.; 1996. p. 338. [Google Scholar]