

Abstract
Cell cycle analysis typically relies on fixed time-point measurements of cells in particular phases of the cell cycle. The cell cycle, however, is a dynamic process whose subtle shifts are lost by fixed time-point methods. Live-cell fluorescent biosensors and time-lapse microscopy allows the collection of temporal information about real time cell cycle progression and arrest. Using two genetically-encoded biosensors, we measured the precision of the G1, S, G2 and M cell cycle phase durations in different cell types and identified a bimodal G1 phase duration in a fibroblast cell line that is not present in the other cell types. Using a cell line model for neuronal differentiation, we demonstrated that NGF-induced neurite extension occurs independently of NGF-induced cell cycle G1 phase arrest. Thus, we have begun to use cell cycle fluorescent biosensors to examine the proliferation of cell populations at the resolution of individual cells and neuronal differentiation as a dynamic process of parallel cell cycle arrest and neurite outgrowth.
Keywords: phase duration, biosensor, fluorescence, live-cell imaging, PC12, neurite, G1 arrest
Introduction
Current investigations of cell cycle progression and arrest typically make use of endpoint measurements in fixed cells. While techniques such as flow cytometry, immunostaining, synchronization and BrdU incorporation have enabled significant advances in our knowledge of cellular proliferation and cell cycle arrest, important information is lost because of the synchronization, fixation or bulk cell analysis required by these techniques. Bulk analysis eliminates the ability to observe variability within a population; synchronization procedures may irreversibly interfere with normal cycle progression; and fixation gives only a snapshot of a truly dynamic process. Time-lapse, live, unsynchronized single cell analysis using transmitted light microscopy is limited to the observation of prominent morphology changes like those occurring in mitosis, and the experiments are difficult to perform.1 One method that has been shown to glean new information with regard to cell cycle kinetics is the use of fluorescent biosensors to monitor cell cycle durations in tissue culture cells,2-5 as well as in embryo and animal models.5-7
Here we describe the combination of two translocation-based live cell fluorescent biosensors that overcomes the problems of traditional assays, and allows for the monitoring of all four cell cycle phases. Our biosensor assay system consists of two genetically-encoded fluorescent biosensors whose localization is monitored by automated live cell fluorescence microscopy. The S phase biosensor we used is a well-established fluorescent protein conjugated to PCNA that specifically marks S phase by accumulating at replication foci.7-9 The G1 biosensor is a truncated version of the human DNA helicase B, which was identified by Gu et al. whose cell cycle-dependent translocation from the nucleus into the cytoplasm marks the end of G1 phase.10 The clarity, predictability and reproducibility of the biosensor translocation allows for analysis using a simple epifluorescence microscope at only 10x magnification. We have demonstrated the quantitative usefulness of this combination of biosensors by monitoring normal cell cycle progression, measuring durations for all four cell cycle phases, and identifying two subpopulations with different G1 phase kinetics in a fibroblast cell line. We have also studied NGF-induced differentiation in a PC12 cell subline, and have found that NGF induces neurite extension and cell cycle arrest simultaneously, not sequentially. This data suggests that neuronal differentiation involves the activation of parallel pathways that result in cell cycle arrest and neurite outgrowth.
Results
A challenge for developing fluorescent biosensors that can measure G1, S, G2 and M phase durations is that the biosensors themselves cannot alter cell cycle timing. After constructing and testing fluorescently-tagged cyclins and a number of other putative biosensors and combinations of biosensors, we were able to identify a pair of protein chimeras that cause minimal perturbation. Combination of these two biosensors can be used to (1) assign each cell in an image to one of the four cell cycle phases, (2) measure cell cycle phase durations with time-lapse imaging with minimal perturbation to cell cycle progression and (3) give biological phenomena like differentiation, migration and protein expression a cell cycle context.
Design and use of the G1 phase biosensor
We made a G1 phase biosensor by conjugating the DNA sequence of a red fluorescent protein (tdimer2)11 to the sequence of a fragment of human DNA helicase B (HDHB) and drove this construct with a constitutive CMV promoter. This peptide region of HDHB was chosen based on an earlier finding that the C-terminus can confer cell cycle-dependent localization.10 The C-terminus is downstream of the helicase domain of HDHB and has no innate enzymatic activity. It contains both a putative nuclear localization signal (NLS)12 and a nuclear export signal (NES),13 whose accessibility may be controlled by phosphorylation at multiple Cdk-consensus sites.14 We based our biosensor on these studies and found that we could reduce the previously identified C-terminal region to a 94 amino acid peptide that is sufficient to confer a cell cycle-dependent translocation (Fig. S1).
After nuclear envelope reformation at the end of M phase, the G1 phase biosensor is imported into the nucleus. The biosensor remains nuclear for G1 phase, then translocates into and remains in the cytoplasm for S and G2 phases. After nuclear envelope breakdown in M phase, the G1 biosensor is localized throughout the cell, having no nuclear envelope to compartmentalize it (Fig. 1A and Movie S1). This cell cycle-dependent translocation is reproducible between cells in a population and among several cell types, and is minimally perturbing to cell cycle progression (Fig. S2). In a single image, the G1 phase biosensor also allows for the assignment of cells into three classes: G1, M or S/G2 phases. Using this G1 phase biosensor with time-lapse imaging we can identify the M/G1, G1/S and G2/M cell cycle transitions allowing for the measurement of M and G1 phase durations, and the combined durations of S and G2 phases.
Figure 1.

Phase-dependent biosensor localization and combinatorial usage. (A) The G1 phase biosensor construct consists of the HDHB C-terminus and tdimer2 (a dimeric red fluorescent protein). In G1 phase (post nuclear envelope formation in the daughter cells) the biosensor is nuclear, as shown in the schematic and transfected HeLa cell (left). As the cell progresses through the cell cycle, the G1 phase biosensor translocates to the cytoplasm (G1/S), becoming nuclear excluded in S and G2 phases. Breakdown of the nuclear envelope in M phase allows for fluorescence to spread throughout the rounded cell, with exclusion only at the condensed chromatin (right). Time is in hours:minutes. (B) The nuclear localized S phase biosensor consists of an NLS (SV40 nuclear location signal), EYFP, a linker (18 hydrophilic amino acids) and PCNA. Epifluorescence time-lapse images of a HeLa cell (top) and a schematic (bottom) show S phase biosensor localization through one cell cycle. The nuclei of the schematic S phase cell have been enlarged to better illustrate puncta formation and their change in morphology, which indicates replicative progression. Time is in hours:minutes. (C) Confocal images of a HeLa cell with a punctate S phase biosensor (green) and cytoplasmic G1 phase biosensor (red) denotes S phase DNA replication. (D) Single frame analysis of coexpressed G1 and S phase biosensors allows for the identification of the four phases. When the G1 phase biosensor is nuclear and the S phase biosensor is nuclear but not punctuate, the cell is in G1 phase (arrows). A cytoplasmically localized G1 phase biosensor and a punctate S phase biosensor identify S phase cells (*). G2 cells have cytoplasmic G1 phase biosensor fluorescence and non-punctate S phase biosensor fluorescence (circle). Coalignment of the G1 and S phase fluorescence in the rounded mitotic cell body occurs post nuclear envelope breakdown (square). S phase puncta are not always easy to identify, especially in early and mid S phase (#).
The S phase biosensor
In order to distinguish the passage through S phase, the transition from S to G2, and the durations of S and G2 phases, we used another biosensor in combination with the G1 biosensor. Our S phase biosensor is the proliferating cell nuclear antigen (PCNA) construct originally developed by Leonhardt and colleagues to monitor the real time dynamics of replication foci.9 Because of its reliability and well-documented utility, we chose to use this construct as our S phase biosensor. To facilitate use of the modified PCNA in multicolor automated imaging, we changed the fluorescent protein label from enhanced green fluorescent protein (EGFP) to enhanced yellow fluorescent protein (EYFP) and optimized transfection to obtain minimally perturbing expression levels. The S phase biosensor consists of an SV40 nuclear localization sequence, enhanced yellow fluorescent protein (EYFP), an 18 amino acid hydrophilic flexible linker, and human PCNA (Fig. 1B). We found that replacing EGFP with EYFP did not affect its replication induced translocation, but replacement with enhanced cyan fluorescent protein (ECFP) or monomeric red fluorescent protein (mRFP) did not result in fluorescent replication foci (data not shown). Although the sensor includes the entire PCNA protein, we found that it did not perturb the cell cycle when transiently expressed (Fig. S2).
As shown in Figure 1B, the fluorescence of this S phase biosensor is evenly distributed throughout nuclei during G1 phase, though it is excluded from nucleoli. In S phase, when replication foci are formed, the biosensor is recruited to these origins of replication by its PCNA component and the fluorescence is concentrated in puncta that co-align with these replication sites.9 Recruitment to these sites is facilitated by the homotrimeric ring structure of PCNA, which encircles double-stranded DNA and acts as a scaffold to bring enzymes to DNA during replication.15 The replication foci, and thus the fluorescent puncta of the biosensor, change in size and location within the nucleus as S phase progresses.9 When the large fluorescent puncta from late S phase disappear, the S phase biosensor is again localized homogenously in the nucleus, marking the start of G2 phase. After nuclear envelope breakdown in mitosis, the S phase biosensor is located throughout the rounded cell body (Movie S2). In a single image, the S phase biosensor allows for the assignment of cells into three classes: S, M or G1/G2 phases. Using time-lapse imaging, this S phase biosensor can readily monitor the dynamics of replication, the S/G2, G2/M and M/G1 cell cycle transitions, and thus the durations of S and G2 phases.
Monitoring all four cell cycle transitions by combining the G1 and S phase biosensors
While the biosensors can be used individually to roughly distinguish phases, their combination provides definitive assignment of a specific cell cycle phase to each cell (Fig. 1C). For instance, a cytoplasmically localized G1 biosensor does not discriminate between cells in S or G2 phases, and a non-punctate S phase biosensor marks both G1 and G2 cells. When the biosensors are used in combination, however, each phase of the cell cycle becomes distinguishable, making this system useful for single time point analysis of a field of cells (Fig. 1B). We found that these biosensors do not disrupt cell cycle progression on their own, and transfection by electroporation of both the G1 and S phase biosensors also did not disrupt cell cycle progression as measured by both flow cytometry (Fig. S2) and image analysis (Fig. S3).
Phase identification at a single time point is a powerful approach for high throughput analysis and for understanding spatially-coordinated cell cycle phases in development. Single time point analysis, however, does not permit measurement of cell cycle phase durations or provide insight into subpopulations with different proliferative behavior. In addition, the replication foci in mid-S phase can sometimes be difficult to identify with an isolated image at a relatively low magnification (Fig. 1D). When given a temporal context, however, identifying the formation, maintenance and disappearance of replication foci also makes the S phase biosensor localization much easier to determine. Using automated time-lapse imaging in a temperature-, CO2- and humidity-controlled epifluorescence microscope, we were able to track individual cells and use the biosensor system to monitor all four cell cycle transitions and durations over a period of 20 or more hours (Fig. 2A, top, Movie S3).
Figure 2.

Time-lapse analysis of the combined biosensors measures cell cycle phase durations. (A) NIH3T3 cell example of the G1 (top, red) and S (bottom, green) phase biosensors in all 4 phases: (G1) nuclear G1 and S phase biosensors, (S) cytoplasmic G1 phase biosensor and punctate S phase biosensor, (G2) cytoplasmic G1 phase biosensor and non-punctate nuclear S phase biosensor, and (M) colocalized G1 and S biosensors filling the entire rounded cell. Durations of the phases (bar graph) were scored for cells expressing both biosensors and had at least one frame in the preceding phase and one frame in the subsequent phase. Error bars are s.e.m. *p < 0.05, **p < 0.01, ***p < 0.001. (B) Histograms of the number of minutes spent by each cell type in G1 phase. (C) Histograms of the number of minutes spent by each cell type in S phase. Dashed lines are the mean durations of completed G1 (B) or S (C) phases for the three cell types.
We measured the durations of the four phases of the cell cycle in unsynchronized HeLa, NIH3T3 and NCI-H292 cells (Fig. 2A, Table 1, bottom). In the three cell types, G1 and S phase durations were the longest, while G2 and M phases accounted for only about 15% of the total cycle time. Average durations of G1 and M phases were not significantly different among the three cell lines. The average S phase timing between the NIH3T3 and NCI-H292 cell types differed by only 3% of the total time, while G2 phase durations had a more pronounced variance from 17% (NIH3T3:NCI-H292) to 58% (NCI-H292:HeLa). This S and G2 phase variance, however, was not the only difference that we detected with the biosensors.
Table 1. n values for the live cell experiments shown in figures 2 and 3.
| Cell type | Total number of cells analyzed | Number of cells that completed G1 | Number of cells that completed S | Number of cells that completed G2 | Number of cells that completed M |
|---|---|---|---|---|---|
| NIH3T3 | 95 | 15 | 15 | 27 | 30 |
| NCI-H292 | 65 | 15 | 13 | 22 | 21 |
| HeLa | 58 | 31 | 11 | 18 | 18 |
| PC12 (with serum) 0-37 hours | 128 | 29 | 15 | 35 | 42 |
| PC12 (with serum) 24-61 hours | 178 | 49 | 38 | 50 | 62 |
| PC12 (without serum) 0-37 hours | 111 | 1 | 0 | 22 | 22 |
| PC12 (without serum) 24-61 hours | 56 | 1 | 4 | 6 | 9 |
Though the average duration of a completed G1 phase does not differ significantly among the three cell types, when comparing the time spent in G1 phase for single NIH3T3, NCI-H292 and HeLa cells, we found a marked bimodal behavior that was unique to NIH3T3 fibroblast cells. Figure 2B shows histograms of the time individual cells of the three cell types spent in G1 phase. HeLa and NCI-H292 cells each have a single cycling population. Though the NCI-H292 cells have a greater variance in the time cells spent in G1 phase than the HeLa cells, the majority of cells of these two cell types did not have an excessively prolonged or arrested G1 phase. The NIH3T3 cells, however, have two peaks that mark two distinct subpopulations. The first peak is between 400 and 500 minutes and the second peak are cells that spent more than 1,000 minutes in G1 phase. This second peak in the histogram reflects a subpopulation of NIH3T3 cells that arrested in G1 phase. Widespread arrest in the NIH3T3 cells is limited to G1 phase, which may actually be a quiescent (G0) population.16 All three cell lines complete S, G2 and M phases with a low incidence of arrest (Figs. 2C and S4). Thus, the biosensor system can be used in live, cycling cells to measure individual and average durations of cell cycle phases, to explore stochastic variability, and to identify subpopulations with different cycling kinetics.
PC12 differentiation via cell cycle arrest and neurite outgrowth
In a second application of the biosensor system, we focused on temporal understanding of neuronal differentiation. Neuronal differentiation is brought on in culture systems by the addition of neuronal growth factor (NGF) and is characterized by both the extension of single or multiple neurites and the cessation of proliferation. The historically probed conundrum of neuronal development is how two different growth factors (NGF and epidermal growth factor (EGF)), which both activate the MAPK signaling cascade, could induce the opposing cellular responses of differentiation and proliferation, respectively.17,18 We were interested, not in the molecular networks involved in differentiation, but in the temporal context of cell cycle arrest and neurite outgrowth. Perhaps by stepping back to the level of the whole cell we could examine the relationship between cell division arrest and neurite outgrowth that was one of the original developmental questions that the PC12 cells were proposed to help solve.19 We specifically examined: (1) the details of cell cycle arrest (i.e., which phase(s) does cell cycle arrest occur, and does it occur during the same cycle in the subsequent cycle after NGF addition); (2) the cell cycle context of neurite outgrowth (i.e., does neurite formation require cell cycle arrest or vice versa).
First, we used the biosensor system to understand PC12 cell cycle progression. We performed time-lapse experiments with coexpressed G1 and S phase biosensors in PC12 cells as described above for NIH3T3, NCI-H292 and HeLa cells, to determine PC12 phase durations in serum-induced cell cycle progression. Five representative traces of the tracked PC12 cells (Table 1) are shown in Figure 3A using a color-coded cell cycle phase diagram. Traces like these were used to calculate phase durations for all cell types presented in this study. PC12 cells, imaged from hours 24-61 post serum addition, had G2 and M phase durations similar to those measured for NIH3T3, NCI-H292 and HeLa cells. The durations of completed G1 and S phases, however, were both substantially longer than those of the other three cell types (compare Figs. 3B to 2A). PC12 cells, like the NIH3T3 cells, contained a subpopulation of cells arrested in G1 phase for more than 1,000 minutes. In addition, 6% of the cells analyzed had S phases lasting longer than 1,000 minutes. It is unclear if these cells were experiencing an S phase arrest or merely a slowing of replication that extended an already long S phase by a few hours. As with the NIH3T3, NCI-H292 and HeLa cells, no arrest was detected in G2 or M phases (Fig. 3C).
Figure 3.
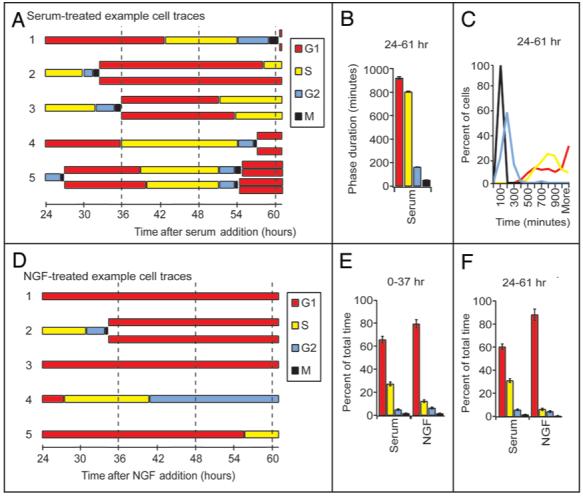
Serum and NGF treated PC12 cells have a marked difference in cell cycle progression. (A) Representative traces of PC12 cells serum starved for 24 hours then treated with serum and imaged after 24 hours for the next 37 hours. (B) Average phase durations of the PC12 cells (shown in A) were tabulated when at least one frame of the preceding and one from the following phase was clearly identified. Error bars are s.d. (C) Histograms of the number of minutes spent in each of the cell cycle phases for the PC12 cells described in (A). (D) Representative traces of PC12 cells serum starved for 24 hours then treated with NGF and imaged after 24 hours for the next 37 hours. The number of frames spent in each phase divided by the total number of frames counted for all cells imaged for 0-37 hours (E) or 24-61 hours (F) post-NGF or serum addition.
After quantifying serum-induced cell cycle progression, we then examined the cell cycle arrest caused by NGF addition. Representative traces of cells imaged for the 24-61 hour span post-NGF addition illustrate the increased time spent in G1 phase and the resulting decrease in division (Fig. 3D). Only two of the cells imaged from 0-37 and 24-61 hours post-NGF treatment proceeded from M phase through G1 to S phase; ten cells that where in G1 phase at the beginning of the imaging proceeded into S phase though many had an extended G1 phase. The majority of the NGF-treated cells spent the entire 37 hours of imaging in G1 or entered but did not exit G1 phase (Fig. 3D, traces 1, 3 and 5). In the 0-37 and 24-61 hour post-NGF treatment samples, only two cells arrested in G2 (Fig. 3D, trace 4), one cell arrested in S, and no cells arrested in M phase. The cell cycle arrest in G1 phase that occurred after NGF addition limited the number of cells that completed one or more phases, so phase durations for these cells could not be determined (Table 1).
In order to analyze this G1 phase arrest phenotype, we calculated the fraction of time cells in the serum and NGF treatments spent in each of the cell cycle phases (Fig. 3E and F). Compared to cells treated with serum, there was a significant increase in the fraction of time NGF-treated cells spent in G1 phase and a parallel reduction of time spent in S phase. Cells imaged in the first 37 hours post-NGF addition (Fig. 3E) were in G1 phase for 80% of the time (compared with 66% of the serum-treated cells). The G1 arrest becomes even more apparent in the cells imaged from hours 24-61 post-NGF addition (Fig. 3F) where 88% of the time cells are in G1 phase (compared with 61% of the serum-treated cells). Together with the G1 phase arrest data shown in single cell traces (Fig. 3D), we propose that addition of NGF reduces the probability of cells exiting G1 phase, though exit from S phase and entry into and exit from G2 and M phases of cells treated with NGF is comparable to serum-treated cells. Cells in G1 phase at the time of NGF exposure rarely proceeded into S phase, but cells in S, G2 or M phases at the time of NGF exposure, proceed with their cell cycles through division and arrest in the subsequent G1 phase. Thus, NGF triggers a robust and nearly immediate G1 phase arrest in PC12 cells.
To determine if neurite outgrowth occurs in a particular phase of the cell cycle, we used a plasma membrane binding fluorescent peptide (Kras tail)20 to mark neurite extensions, and the G1 phase biosensor to monitor G1 phase arrest (Fig. 4A). We serum starved half of the samples before dosing with NGF, and used serum + NGF as our dosing control, where the serum swamps out the differentiation effects of the NGF to allow continued proliferation. We first determined the degree of cell cycle arrest in G1 phase as a function of NGF addition. Within 24 hours, 70-90% of the PC12 cells in both serum and serum-starved pre-stimulation conditions were arrested in G1 phase (Fig. 4B and C, left). Using plasma membrane fluorescence, we measured membrane extensions and determined the fraction of cells with extensions that qualified as neurites (extensions greater than or equal to 1.5 × corresponding cell diameter). While we did not observe neurites in control wells, NGF addition triggered neurite outgrowth within 24 hours, which increased to nearly 100% of cells by 48 hours post-NGF addition (Fig. 4B and C, middle). Serum deprivation before NGF addition increased the percent of cells with neurites after 24 hours, but the percents in both conditions were comparable after 48 hours. When we combined the information on cell cycle arrest and neurite outgrowth from the G1 phase biosensor and the plasma membrane marker, we found that cells in both G1 and S/G2 phases have neurites (Fig. 4B and C, right). Thus, while cell cycle arrest may occur before neurite outgrowth in some cells, neurite outgrowth is not dependent upon cell cycle arrest.
Figure 4.

Cell cycle effects and neurite extension caused by NGF addition. (A) PC12 cells transfected with both the G1 phase biosensor (left) and a plasma membrane marker (Kras tail) (right) were imaged to identify cell cycle phases and neurite extensions, respectively. PC12 cells expressing the G1 phase biosensor and Kras tail were cultured in media containing serum (B) or serum-free media (C) for 24 hours and then cultured in media containing serum + NGF (Control) or NGF. Schematics of the experimental designs are located above the graphs of the corresponding data. Panels on the left give the percent of PC12 cells in G1 phase, i.e., those with a nuclear-localized G1 phase biosensor. The middle panels indicate the percent of cells with plasma membrane extensions (neurites) at least 1.5 × their body diameter. Combining the information from the G1 phase biosensor and the Kras tail allows for the assignment of either G1 phase or S/G2 phases to the cells that have formed neurites (panels on the right). Error bars are 95% confidence intervals.
Discussion
This fluorescent biosensor system is, to date, one of only two methods that can be used to both assign each cell in an image to one of the four cell cycle phases, and to measure durations of all four cell cycle phases.2 Our study focused on two important quantitative applications of the biosensor system: first, as a tool to compare durations of different cell cycle phases within and among cell populations, and second, as a means to determine the temporal relationship between the extension of neurites and cell cycle arrest in a neuronal differentiation cell model.
In the analysis of the variation of cell cycle phase duration in NIH3T3, HeLa and NCI-H292 cells, we found a bimodal G1 phase duration distribution for NIH3T3 cells. This finding suggests that a subpopulation of these fibroblasts arrests in G1 phase, while the remaining cells continue to proliferate with kinetics similar to the other two cell lines. Using the typical methods of BrdU or antibody labeling, bulk cell analysis, synchronization and single time point analysis it would have been difficult, if not impossible, to determine all four cell cycle phase durations, much less distinguish these two NIH3T3 subpopulations. In the PC12 cell model for NGF-induced neuronal differentiation, we used the biosensors to give neurite extension a cell cycle phase context. Based on the temporal resolution provided by the biosensors, we found that NGF-treated PC12 cells typically arrest in the earliest G1 phase after NGF addition. Using the G1 phase biosensor in its single image capacity, we determined that neurite extension did not require exit from the cell cycle. Thus, we propose a model of differentiation whereby signaling resulting in cell cycle arrest and neurite outgrowth occurs in parallel, not sequentially.
This biosensor system can be used to identify the fraction of cells in each of the cell cycle phases in single images of live cell experiments, removing the need for sample fixation and antibody staining, which simplifies typical high throughput assays, creating new possibilities for small molecule or RNA interference screens. More subtle perturbations that accelerate or delay entry into cell cycle phases can now be identified and described according to the relative phase distribution of the same cells at multiple time points. The biosensor system also offers a powerful way to track cells over time and to measure the durations of the four cell cycle phases in large populations of cells. The use of two biosensors that rely on distinct cell cycle-dependent molecular mechanisms for localization also provides confirmation of the G1/S, G2/M and M/G1 phase transitions. This type of detailed, quantitative and robust analysis of cell cycle timing offers new possibilities to understand mechanisms of drug action, to assign more specific roles to signaling proteins that control the cell cycle, and to identify subgroups within a population that have distinct cell cycle timing characteristics. This latter application is particularly useful when applied to differentiating cells, where the parallel processes of arrest of the cell cycle and the emergence of differentiation markers can be compared at the single cell level.
Materials and Methods
Cloning the biosensors
To create the G1 phase biosensor, nucleic acids from the carboxy terminus of human DNA helicase B (HDHB) (accession # AF319995) were amplified from a full human brain cDNA library using the following primers: 5′ CCC AAG CTT GGG CTC TCC TCT AGC GGC GCA 3′; 5′ CGG GGT ACC CCG AGT TTC TTG ATT ATC GGT GGG C 3′. The 5′ primer used for PCR includes a HindIII site and the 3′ primer includes a KpnI site. These restriction digest sites were used to facilitate ligation of the PCR product into pcDNA3-tdimer2 (a gift of R. Tsein).11 The resulting vector encoded a fusion protein composed of, from N- to C-terminus, the HDHB C-terminus and tdimer2.
The S phase biosensor is a modified version of GFP-PCNAL2, which was a kind gift of M.C. Cardoso.9 The original sequence for GFP-PCNAL2 includes an SV40 NLS, EGFP, an 18 amino acid flexible linker and full length PCNA (accession # NM_002592). The original parent vector, pEVRF (containing GFP-PCNAL2) and pEYFP-N1 (Clontech) were sequentially digested with AgeI and BsrGI and ligated to obtain the construct we refer to as the S phase biosensor.
Cell culture and biosensor expression
Though PC12 cells are a unique and reliable model system to study aspects of neuronal differentiation, they are not ideal for imaging experiments. We used a subpopulation of PC12 cells, Neuroscreen-1, because of their increased rate of growth and their improved cell spreading that eliminates the clumping often seen with PC12 cells (Cellomics, Inc.).21,22 Despite the changes present in NS-1 cells that enhance their usefulness in imaging experiments, as with PC12 cells, NS-1 cells develop neurites upon the addition of NGF while the addition of serum allows for proliferation. For simplicity, we have referred throughout this study to the Neuroscreen-1 cells as PC12 cells.
HeLa and NIH3T3 cells from the ATCC were grown and plated in high glucose DMEM supplemented with penicillin/streptomycin/glutamine (PSG) (1%) and fetal bovine serum (FBS) (10%) at 37°C in 10% CO2. NCI-H292 cells (ATCC) were grown and plated in RPMI supplemented with PSG (1%) and FBS (10%) in 5% CO2. PC12 cells were cultured in F12K media supplemented with horse serum (15%), FBS (2.5%) and PSG (1%) (full PC12 culture media) in dishes coated with collagen.
All cell types were electroporated with the Amaxa system following manufacturer’s instructions (Amaxa Biosystems). Briefly, 106 (or 2 × 10⁶ NS-1) cells were electroporated with 400 ng of the G1 phase biosensor and 200 ng of the S phase biosensor. The PC12 cells were the most sensitive to different Nucleofector solutions and Amaxa programs. In our optimized electroporation protocol, we used Amaxa Kit V, with the above mentioned cell number and DNA concentrations, and program U29. Cells were plated into Costar 96-well plastic bottom plates, PC12 cells onto a layer of poly-L-lysine, by multichannel pipette in their respective culture media and incubated for 24 hours before assays were conducted.
In the cell cycle phase duration experiment (Fig. 3), PC12 cells were initially serum starved (F12K media containing PSG and 0.1% BSA). After 24 hours, half of the wells were dosed as follows: NGF-treated cells were given serum starvation media, as described above, supplemented with 25 ng/mL NGF. Serum-treated cells were grown in full PC12 culture media. After an additional 24 hours, the remaining wells were dosed as above, and imaged (see below). The cells dosed initially constitute the 24-61 hr samples, and those dosed at the start of imaging are the 0-37 hr samples. Serum starvation was not intended to induce quiescence or synchronization; rather, it was used to decrease basal NGF signaling. As the doubling time of these cells is between 30 and 37 hours, a period of serum starvation longer than 24 hours would be necessary for synchronization.
PC12 cells used in the neurite outgrowth/cell cycle experiment (Fig. 4) were either serum starved (as in the cell cycle phase duration experiment), or grown in full PC12 culture media. After 24 hours, media was replaced with either full PC12 culture media supplemented with 25 ng/mL NGF (Control), or serum starvation media as above supplemented with 25 ng/mL NGF (NGF). The serum in the control samples swamps out NGF-induced differentiation.
Image acquisition and data analysis
Time-lapse imaging was performed on an ImageXpress 5000A epifluorescence microscope with live cell capabilities (Universal Imaging). Images were acquired with a CCD camera resolution of 1,280 × 1,024 and a 10x plan fluorescence objective. Filter sets, including the excitation (Ex), excitation dichroic (Di) and emission (Em) filters (Chroma Technology Corporation) were as follows: Hoechst, D360-40x (Ex), 400DCLP (Di), 460-50m (Em); tdimer2, S565-55x (Ex), 86021 (Di), S650-75M (Em); YFP, S500-20x (Ex), 86002 (Di), S535-30 (Em). Humidity, temperature and CO2 were adjusted to mimic incubator conditions. Well volume evaporation, media pH indicator color change, and general cell health were monitored to ensure environment suitability. Because of the extended time of PC12 imaging, the plate was removed from the microscope after 22 hours, new media with the specified NGF/serum supplement was added, the media was brought to the proper CO2 saturation in an incubator for 2.5 hours, and the plate was placed back in the microscope for an additional 12.5 hours.
Cells chosen for time-lapse analysis were selected based on visible expression of both biosensors and normal morphological appearance at the start of imaging. Selected cells were tracked manually for phase information using biosensor localization using Metamorph software (Universal Imaging). Phase durations were calculated for cells that had at least one incontrovertible frame of the phases both immediately preceding and following the timed phase. For example, if the duration of G2 phase was calculated, that means the disappearance of large foci at end of the preceding S phase and nuclear envelope breakdown in the following M phase were also visible for the same cell. For the PC12 experiment, durations were tabulated as above for cells that: (1) could be followed through all the frames of the imaging, and (2) did not transition during the time during 2.5 hours when the plate was out of the microscope. The minutes when the plate was outside the microscope were included in the duration calculations.
Plasma membrane extensions and cell diameters were measured using the Metamorph software line tool and calculating the ratio of plasma membrane extension length (pixels) to cell diameter (pixels). Plasma membrane extensions more than 1.5 × the diameter of the corresponding cell were classified as neurites.
Data compilation and statistical analysis were performed in Excel (Microsoft). p-values for Figure 2A were determined by a two-tailed, two sample of equal variance, Student’s t-test. Confidence intervals (95%) were calculated thusly:
Flow cytometry
Flow cytometry analysis was performed on HeLa cells 24 hours post electroporation and plating. Cells were harvested by trypsinization, pelleted at low rpm, washed with phosphate buffered saline (PBS), fixed in 70% ethanol, treated with 100 μg/mL RNAse A, and treated with 50 μg/mL propidium iodide (PI) to stain DNA. Cells were assayed on a BD FACSCalibur flow cytometer and data was analyzed using FlowJo software.
Supplementary Material
Acknowledgements
The authors thank M.C. Cardoso et al. for the GFP-PCNAL2 construct that became the S phase biosensor, R.Y. Tsien, et al. for the red fluorescent protein, tdimer2, J.Y. Chen for assistance with PC12 protocols, E.G. Guignet for statistical assistance and C. Van, A. Salmeen, M.C. Yee and T. Inoue for careful reading of the manuscript.
A.T.H. wrote the manuscript and performed experiments. A.T.H. and J.T.J. designed the experiments. T.M. advised A.T.H. and J.T.J and provided funding NIH grant R21 CA120732.
Abbreviations
- HDHB
human DNA helicase B
- NGF
neuronal growth factor
- NLS
nuclear localization signal
- PCNA
proliferating cell nuclear antigen
Footnotes
Supplementary materials can be found at: www.landesbioscience.com/supplement/HahnCC8-7-Sup.pdf
References
- 1.Khodjakov A, Rieder CL. Imaging the division process in living tissue culture cells. Methods. 2006;38:2–16. doi: 10.1016/j.ymeth.2005.07.007. [DOI] [PMC free article] [PubMed] [Google Scholar]
- 2.Easwaran HP, Leonhardt H, Cardoso MC. Cell cycle markers for live cell analyses. Cell Cycle. 2005;4:453–5. doi: 10.4161/cc.4.3.1525. [DOI] [PubMed] [Google Scholar]
- 3.Gong D, Pomerening JR, Myers JW, Gustavsson C, Jones JT, Hahn AT, et al. Cyclin A2 regulates nuclear-envelope breakdown and the nuclear accumulation of cyclin B1. Curr Biol. 2007;17:85–91. doi: 10.1016/j.cub.2006.11.066. [DOI] [PMC free article] [PubMed] [Google Scholar]
- 4.Jones JT, Myers JW, Ferrell JE, Meyer T. Probing the precision of the mitotic clock with a live-cell fluorescent biosensor. Nat Biotechnol. 2004;22:306–12. doi: 10.1038/nbt941. [DOI] [PubMed] [Google Scholar]
- 5.Sakaue-Sawano A, Kurokawa H, Morimura T, Hanyu A, Hama H, Osawa H, et al. Visualizing spatiotemporal dynamics of multicellular cell cycle progression. Cell. 2008;132:487–98. doi: 10.1016/j.cell.2007.12.033. [DOI] [PubMed] [Google Scholar]
- 6.Burney RO, Lee AI, Leong DE, Jones JT, Hahn AT, Meyer T, et al. A transgenic mouse model for high content, cell cycle phenotype screening in live primary cells. Cell Cycle. 2007;6:2276–83. doi: 10.4161/cc.6.18.4718. [DOI] [PubMed] [Google Scholar]
- 7.Kisielewska J, Lu P, Whitaker M. GFP-PCNA as an S-phase marker in embryos during the first and subsequent cell cycles. Biol Cell. 2005;97:221–9. doi: 10.1042/BC20040093. [DOI] [PubMed] [Google Scholar]
- 8.Essers J, Theil AF, Baldeyron C, van Cappellen WA, Houtsmuller AB, Kanaar R, et al. Nuclear dynamics of PCNA in DNA replication and repair. Mol Cell Biol. 2005;25:9350–9. doi: 10.1128/MCB.25.21.9350-9359.2005. [DOI] [PMC free article] [PubMed] [Google Scholar]
- 9.Leonhardt H, Rahn HP, Weinzierl P, Sporbert A, Cremer T, Zink D, et al. Dynamics of DNA replication factories in living cells. J Cell Biol. 2000;149:271–80. doi: 10.1083/jcb.149.2.271. [DOI] [PMC free article] [PubMed] [Google Scholar]
- 10.Gu J, Xia X, Yan P, Liu H, Podust VN, Reynolds AB, et al. Cell cycle-dependent regulation of a human DNA helicase that localizes in DNA damage foci. Mol Biol Cell. 2004;15:3320–32. doi: 10.1091/mbc.E04-03-0227. [DOI] [PMC free article] [PubMed] [Google Scholar]
- 11.Campbell RE, Tour O, Palmer AE, Steinbach PA, Baird GS, Zacharias DA, et al. A monomeric red fluorescent protein. Proc Natl Acad Sci USA. 2002;99:7877–82. doi: 10.1073/pnas.082243699. [DOI] [PMC free article] [PubMed] [Google Scholar]
- 12.Chelsky D, Ralph R, Jonak G. Sequence requirements for synthetic peptide-mediated translocation to the nucleus. Mol Cell Biol. 1989;9:2487–92. doi: 10.1128/mcb.9.6.2487. [DOI] [PMC free article] [PubMed] [Google Scholar]
- 13.la Cour T, Kiemer L, Molgaard A, Gupta R, Skriver K, Brunak S. Analysis and prediction of leucine-rich nuclear export signals. Protein Eng Des Sel. 2004;17:527–36. doi: 10.1093/protein/gzh062. [DOI] [PubMed] [Google Scholar]
- 14.Nigg EA. Targets of cyclin-dependent protein kinases. Curr Opin Cell Biol. 1993;5:187–93. doi: 10.1016/0955-0674(93)90101-u. [DOI] [PubMed] [Google Scholar]
- 15.Maga G, Hubscher U. Proliferating cell nuclear antigen (PCNA): a dancer with many partners. J Cell Sci. 2003;116:3051–60. doi: 10.1242/jcs.00653. [DOI] [PubMed] [Google Scholar]
- 16.Zetterberg A, Larsson O, Wiman KG. What is the restriction point? Curr Opin Cell Biol. 1995;7:835–42. doi: 10.1016/0955-0674(95)80067-0. [DOI] [PubMed] [Google Scholar]
- 17.Marshall CJ. Specificity of receptor tyrosine kinase signaling: transient versus sustained extracellular signal-regulated kinase activation. Cell. 1995;80:179–85. doi: 10.1016/0092-8674(95)90401-8. [DOI] [PubMed] [Google Scholar]
- 18.Santos SD, Verveer PJ, Bastiaens PI. Growth factor-induced MAPK network topology shapes Erk response determining PC-12 cell fate. Nat Cell Biol. 2007;9:324–30. doi: 10.1038/ncb1543. [DOI] [PubMed] [Google Scholar]
- 19.Greene LA, Tischler AS. Establishment of a noradrenergic clonal line of rat adrenal pheochromocytoma cells which respond to nerve growth factor. Proc Natl Acad Sci USA. 1976;73:2424–8. doi: 10.1073/pnas.73.7.2424. [DOI] [PMC free article] [PubMed] [Google Scholar]
- 20.Fivaz M, Meyer T. Reversible intracellular translocation of KRas but not HRas in hippocampal neurons regulated by Ca2+/calmodulin. J Cell Biol. 2005;170:429–41. doi: 10.1083/jcb.200409157. [DOI] [PMC free article] [PubMed] [Google Scholar]
- 21.Dijkmans TF, van Hooijdonk LW, Schouten TG, Kamphorst JT, Fitzsimons CP, Vreugdenhil E. Identification of new Nerve Growth Factor-responsive immediate-early genes. Brain Res. 2008 doi: 10.1016/j.brainres.2008.10.050. [DOI] [PubMed] [Google Scholar]
- 22.Dijkmans TF, van Hooijdonk LW, Schouten TG, Kamphorst JT, Vellinga AC, Meerman JH, et al. Temporal and functional dynamics of the transcriptome during nerve growth factor-induced differentiation. J Neurochem. 2008 doi: 10.1111/j.1471-4159.2008.05338.x. [DOI] [PubMed] [Google Scholar]
Associated Data
This section collects any data citations, data availability statements, or supplementary materials included in this article.