

Abstract
The estrogen receptor-alpha (ER-α, ESR1) is a key regulatory molecule in mammary epithelial cell development. Loss of ER-α in breast cancer is correlated with poor prognosis, increased recurrence following treatment, and an elevated incidence of metastasis. A proposed molecular pathway by which ER-α acts to constrain invasive growth in breast cancer cells involves direct, ER-α dependent expression of MTA3, a cell-type specific component of the Mi-2/NuRD chromatin remodeling complex. MTA3 in turn represses expression of Snail, a transcription factor linked to epithelial to mesenchymal transition (EMT) and cancer metastasis. To elucidate its role(s) in EMT, we expressed Snail in the non-invasive, ER-α positive MCF-7 cell line. Snail expression led to decreased cell-cell adhesion and increased cell invasiveness. Further, we observed loss of ER-α expression at both the RNA and protein level that was accompanied by direct interaction of Snail with regulatory DNA sequences at the ESR1 locus. A consequence of loss of ER-α function in this system was the increased abundance of key components of the transforming growth factor-β (TGF-β) signaling pathway. Thus, cross-talk between ER-α, Snail and the TGF-β pathway appears to control critical phenotypic properties of breast cancer cells.
Keywords: Snail, Estrogen receptor alpha, transcription, EMT, breast cancer, TGF-beta
Introduction
The local signaling environment plays a crucial role in dictating cellular phenotype and behavior. Signals from a cell’s surroundings can determine not only intracellular functions, but also govern the way cells interact with each other. Early in embryonic development, the male and female mammary glands follow similar developmental pathways. However, at puberty, development is directed by hormonal signals in females, leading to ductal morphogenesis, while the mammary anlage atrophies in the male (1). During pregnancy and subsequent lactation, a hormonal surge leads to intensive elaboration of the mammary epithelium, in part through the mitogenic action of estradiol (1-3). At the molecular level, these physiologic changes in the gland during puberty, pregnancy and lactation result from the action of ligand-dependent nuclear hormone receptors (4-6) leading to transcriptional activation of target genes (7-10). One such receptor, ER-α, impacts both proliferation and differentiation of the mammary epithelium (5, 11).
Besides its well-documented role in transcriptional activation of genes, ER-α can also serve in a repressive capacity. MTA3, which is directly activated by ER-α, is a cell-type specific subunit of the Mi-2/NuRD transcriptional corepressor complex, which can direct the complex to distinct genes where it plays a repressive role (12). One such target of the MTA3-containing Mi-2/NuRD complex is the transcriptional repressor, Snail (SNAI1) (12). This protein was identified as an essential component of pathways in early development in flies (13-15) and mammals (16), as well as in cancer progression and metastasis (17-19). Snail acts to repress genes that encode vital structural components of the cell-cell junctional apparatus, such as E-cadherin (CDH1) (17, 18) and occludin (OCLN) (20), resulting in a de-differentiated, mesenchymal phenotype characterized by increased motility. This phenomenon, termed epithelial to mesenchymal transition (EMT), was first described in 1982 by Greenburg and Hay (21).
Recent work indicates a strong correlation between Snail and tumor recurrence following treatment: biopsies of human breast cancer cells revealed a higher prevalence of Snail expression in (22)metastatic tumors. This finding may reflect a role for Snail as a converging point for many signaling pathways, all eventually leading to EMT (23). For instance, Snail is implicated in regulating Wnt-1-induced EMT in MCF-7 cells (24). Additionally, upregulation of Snail in colon cancer cells is associated with downregulation of the Vitamin D receptor (25). A critical signaling pathway that intersects both Snail and ER-α biology involves members of the transforming growth factor-β (TGF-β) family (26-28). The TGF-β family of peptide growth factors acts through cell-surface receptors to modulate cellular signaling cascades. All three TGF-β isoforms bind to the TGF-β receptor, which then triggers the activation of the Smad signaling pathway. Translocation of the Smad proteins to the nucleus then results in the activation of several genes [reviewed in (29)]. With respect to breast cancer cells, TGF-β signaling is normally responsible for cell cycle arrest, thereby countering the mitogenic role of ER-α (30). It has been suggested that ER-α positive breast cancer cells lose responsiveness to the TGFβ-signaling cascade due to loss or decreased expression of TGFβ-RII (31). Replacement of the TGF-βRII in these cells restores TGF-β mediated cell cycle arrest (32). Detailed studies by Ammanamanchi and colleagues indicated that TGF-βRII is repressed in ER-α positive breast cancer due to decreased activity of the Sp1/Sp3 family of transcription factors (33).
Breast cancer cell lines can be broadly classified into two categories: one group displays the classic properties of epithelial cells such as polarized architecture, cell-cell contact, and growth in a contiguous 2-dimensional sheet in culture. Most cells in this class express ER-α and are not metastatic in nature (34). The second category has the ability to form metastatic tumors in xenograft models, as a result of aggressive growth arising from estrogen- independence (34). These cell lines are more mesenchymal and lack many of the features that characterize epithelial cells, including loss of contact inhibition and polarity. In addition, cells in this second category are more mobile.
In this study, we utilized an exogenous expression strategy to introduce Snail into MCF-7 cells. We found that increased Snail expression resulted in decreased cell-cell adhesive properties and an increased ability to invade through matrigel, consistent with induction of EMT. Surprisingly, Snail expression caused a decrease in ER-α protein and RNA levels. Loss of ER-α appeared to result from direct transcriptional repression of the ER-α locus by Snail. This is evidenced by a loss of histone H3K9 acetylation at the ER-α locus. This decrease in ER-α had measurable downstream consequences on cellular physiology, including decreased pS2 (TFF1 or Trefoil factor 1, a gene that is activated by ER-α) RNA levels and increased steady state levels of the TGF-β signaling system components. Estrogen receptor and TGF-β signaling pathways influence cell growth and proliferation in opposing ways. While estrogen receptor has a stimulatory effect, TGF-β causes cell-cycle arrest (30). Here, we show that expression of Snail leads to transcriptional repression of ER-α, while ER-α in turn controls Snail and TGF-β expression. These findings suggest that exogenous expression of Snail in ER-α positive breast cancer cells results in a switch in dominant regulatory pathways from estradiol to TGF-β. Thus, cross-talk between ER-α, Snail, and the TGF-β pathway creates a balance in mammary epithelial cells between a differentiated, epithelial state and epithelial to mesenchymal transitions.
Results
Breast cancer cells exhibit an inverse relationship between ER-α and Snail
Previous work from our laboratory indicated that ER-α acts to inhibit the expression of Snail via stimulation of MTA3, a cell-type specific subunit of the Mi-2/NuRD corepressor complex (12, 35). Concordant with these data, a survey of commonly used breast cancer cell lines revealed that, at the protein level, ER-α and occludin (a component of tight junctions) are expressed to a greater degree in the epithelial cell lines MCF-7 and T-47D than in the mesenchymal MDA-MB-231 (Figure 1A). On the other hand, Snail is more readily detected in MDA-MB-231 compared to the epithelial MCF-7 and T-47D cell lines, which express it to a much lower degree (Figure 1A). Thus, breast cancer cell lines present an inverse relationship between ER-α and Snail expression.
Figure 1. An inverse relationship exists between Snail and ER-α in breast cancer cell lines.

A) Immunoblots using whole cell lysates from two ER-α positive cell lines (MCF-7 and T-47D) and an ER-α negative cell line (MDA-MB-231) were performed using antibodies against ER-α, Occludin, Snail, and β-Actin.
B) MCF-7 cells were targeted with siRNA against ER-α or GFP (normalization control), and RNA isolated after 48 hours. RT-PCR was performed using primers directed against ER-α and Snail. Data shown are an average of three biological experiments.
These data agree with a current model depicting Mi-2/NuRD dependent transcriptional repression of Snail as a secondary biological effect of ER-α action (12, 35). As a direct test of this model, we asked whether perturbing ER-α expression would result in simultaneous alterations in Snail expression. Treatment of MCF-7 with siRNA duplexes specific for ER-α led, as expected, to decreased steady state levels of ER-α mRNA. As predicted from the model, these declines in ER-α were accompanied by a concomitant increase in Snail RNA levels (Figure 1B).
Phenotypic consequences of Snail overexpression
In order to determine molecular targets of Snail in breast cancer cell lines, we exogenously expressed Snail in MCF-7 breast carcinoma cells using a previously described adenovirus strategy (36). As a prelude to molecular analysis, we characterized the phenotypic changes associated with increased expression of Snail in MCF-7. A slow aggregation assay (37) was employed to determine whether expression of Snail influences the adhesion properties of the cells. MCF-7 cells were infected with control- or Snail-expressing adenoviruses for 3 days. The cells were then trypsinized, counted and resuspended in serum- and phenol red- free medium, and an equal number were cultured over a bed of agar dissolved in DMEM/F-12 medium for a further period of 24 hours. MCF-7 cells that were infected with the control virus formed large aggregates, while the Snail-expressing cells were spread diffusely across the agar (Figure 2). We concluded from this experiment that Snail expression has a dramatic impact on cell-cell contacts in MCF-7.
Figure 2. Snail expression decreases cell-cell adhesion properties of MCF-7 cells.
MCF-7 cells infected with control or Snail-adenovirus for 3 days were trypsinized, counted, and 10,000 cells were resuspended in DMEM/F-12 medium lacking both FBS and phenol-red and placed over a bed of Agar in a 96-well plate. After a period of 24 hours, they were observed under a 5X lens of a Zeiss imaging microscope. Data are representative of three independent biological experiments.
To determine whether Snail expression altered invasive properties of MCF-7 cells, we utilized Boyden chambers containing Matrigel-coated membranes (38-40). MCF-7 cells were infected with Snail or control-adenovirus for 3 days, trypsinized, and resuspended in FBS-free media in the upper chamber, while the lower chamber contained media with 10% FBS as the chemoattractant. Cells were allowed to invade for 24 hours, then were fixed and counted. We observed a statistically significant (p-value=0.01, t-test), increase (approximately 3-fold) in the number of invading cells when comparing Snail-expressing cultures to controls (Figure 3). While the number of invading cells demonstrated by Snail-infected MCF-7 cells is much less than MDA-MB-231 cells (data not shown), it is significantly more than control virus-infected MCF-7 cells.
Figure 3. Snail increases invasiveness of MCF-7 cells through matrigel.

MCF-7 cells infected with control or Snail-adenovirus for 3 days were trypsinized, counted, and 20,000 cells were resuspended in DMEM/F-12 medium lacking FBS and pipetted carefully over a membrane coated with Matrigel in the upper well of a Boyden chamber. The lower chamber contained the same media supplemented with 10% FBS as the chemoattractant. After a period of 24 hours, the membranes were removed and the cells that had invaded through the matrigel to the other side were stained with Diff-Quik and counted under the microscope. Data shown are an average of three biological replicates. A t-distribution analysis was performed on the samples within each set (single asterisk * indicates p-value≤0.05, ** indicates p-value ≤ 0.01). A two-sample t-test comparing Snail to control-treated samples showed a p-value of 0.01.
Snail represses the epithelial cell transcriptional program while upregulating components of the TGF-β signaling pathway
Recent work demonstrated that Snail functions in a pathway downstream of ER-α to negatively regulate genes like the tumor suppressor gene E-cadherin (35). The Mi-2/ NuRD chromatin remodeling complex has been shown to associate with the promoter region of and negatively regulate Snail in breast cancer cells. In other contexts, Snail directly represses transcription factors associated with an epithelial phenotype (25). Given our demonstration that ER-α and Snail are negatively correlated in breast cancer cell lines (Figure 1a and b), we asked whether Snail expression in MCF-7 cells directly altered ER-α levels. As a positive control of Snail repression, we used the previously defined Snail target gene occludin (20). In our system, Snail expression led to a downregulation (maximum approximately 4-fold compared to control) of ER-α RNA (Figure 4A) within 48 hours. As expected, occludin was also downregulated, approximately 22-fold following 2 days, and 47-fold compared to control-adenovirus treated cells after 4 days of Snail expression (Figure 4A). A similar trend in expression of these genes was observed in the ER-α positive cell line T-47D upon Snail expression, although not to the same extent as in MCF-7 (Supplementary Figure 1A and B).
Figure 4. Snail expression causes a decrease in ER-α, while causing an increase in TGF-β family RNA levels in MCF-7 cells.

MCF-7 cells were infected with Snail or control-adenovirus over a period of 4 days and RNA expression detected via RT-PCR. RNA fold change was calculated after normalizing to 18S RNA for (A) ER-α (ESR1) and Occludin (OCLN)(B) Snail (SNAI1), TGF-β2 and TGF-βRII (note log scale), (C) pS2 and (D) Slug (SNAI2). Data shown are an average of three biological replicates. A t-test was performed on the samples within each set (single asterisk * indicates p-value≤0.05, ** indicates p-value ≤ 0.01). MCF-7 cells were infected with Snail or control-adenovirus for a period of 2 days and total protein was isolated. Equal amounts were loaded and analyzed via immunoblotting (E) using antibodies against ER-α, Occludin, and Snail. Actin (ACTB) was used as a loading control. Data are representative of at least three biological replicates. MCF-7 cells were infected with Snail or control-adenovirus for a period of 2 days and the cellular distribution of ER-α (F) and occludin (G) were visualized as described in materials and methods. Data are representative of at least three biological replicates. Arrowheads indicate adenovirus-infected cells.
Similarly, we observed downregulation in levels of ER-α and occludin protein, as seen by immunoblot analysis (Figure 4E) as well as immunofluorescence (Figures 4F and G). Following infection of MCF-7 cells with Snail adenovirus, we noticed a marked change in morphology compared to the control-virus treated cells. The presence of Snail caused a more diffuse and dispersed appearance (data not shown), as opposed to the more sheet-like form characteristic of uninfected MCF-7 cells. Immunofluorescence staining for the cell-cell adhesion marker occludin revealed a distinct ‘chicken-wire’ staining pattern, illustrative of intact cell-cell contact points in the control- adenovirus treated cells. On the other hand, a marked reduction in ER-α (Figure 4F, see arrowheads) as well as that of occludin (Figure 4G, see arrowheads) staining was observed in cells that were infected with the Snail adenovirus.
We further explored the physiologic consequences of the loss of ER-α following expression of Snail. RNA levels of pS2, a direct target of ER-α mediated transcriptional activation, are decreased (Figure 4C). Brattain and colleagues have identified ER-α action in repression of key components of the TGF-β signaling system in breast cancer cells (31, 32). A kinetic analysis revealed alterations in the levels of TGF-β2 and TGF-βRII RNA levels following 4 days of Snail expression (Figure 4B). At this time, there is very little detectable ER-α in the cell. Finally, as Snail and Slug levels are strongly correlated in a subset of breast tumors (41), we determined steady state levels of Slug mRNA following exogenous Snail expression. Snail expression did not affect the expression levels of Slug at the RNA level (Figure 4D). We concluded from these experiments that exogenous expression of Snail in an ER-α positive breast cancer cell line has a dramatic impact on cell physiology and on the response to critical signaling pathways. Further, as we observed no significant impact on Slug expression, we infer that the phenotypic and molecular alterations described in this work result from action of Snail and not Slug.
Snail binds to the promoter and intronic regions of the ER-α gene
To examine whether downregulation of ER-α represents a direct effect of Snail action, we performed chromatin immunoprecipitation (ChIP) at the ER-α locus, using E-cadherin locus as a control, focusing our analyses on clusters of putative Snail binding sites. After immunoprecipitation with the anti-Snail antibody and subsequent PCR amplification (see Supplementary Table 1 for a list of primer sequences), we normalized Snail binding at ER-α to that seen at β-Actin, where there are no Snail binding sites, as described in the materials and methods. Compared to the control adenovirus- treated cells, the Snail-infected cells exhibited a 7-fold increase in Snail binding above background at the ER-α promoter (primer set I). A strong cluster of putative Snail binding sites in the first intron of ER-α (primer set II) showed an approximately threefold increase of Snail binding (Figure 5). The E-cadherin (CDH1) gene was used as a positive control for Snail binding, with primers encompassing the promoter region as previously published (42). Therefore we concluded that the phenomenon of ER-α downregulation results from a direct effect of Snail binding at the promoter.
Figure 5. Snail associates with the ER-α locus.
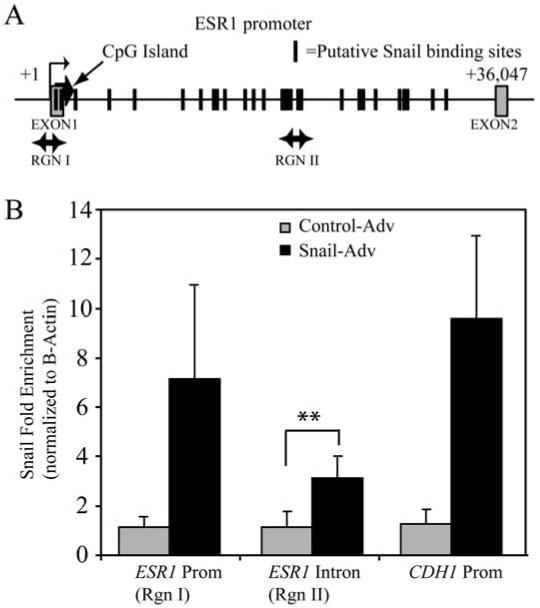
(A) Schematic of the ER-α locus showing location of the primer sets used in ChIP analysis. The boxes represent the exons, while the hash marks represent clusters of putative Snail binding sites. (B) MCF-7 cells were infected with Snail or control adenovirus and ChIP performed as described in materials and methods. Amplification of input and DNA precipitated with either a control IgG or anti-Snail antibody is shown for the indicated primer sets. The data represent fold-change of material immunoprecipitated with the Snail antibody versus with IgG, and normalized to Snail binding at the beta-Actin intron, which has no known Snail binding sites.
Snail decreases histone H3K9 acetylation, but does not increase H3K9 methylation at the ER-α promoter
Histone acetylation is typically thought to be associated with gene activation, while histone methylation (specifically, H3K9) has been shown to correlate positively with repressed or silenced genes (43, 44). Work by several laboratories has shown that ER-α expression can be decreased by overexpression of HDACs (45); while inhibition of HDACs and DNA methylation causes an increase in ER-α expression (46). Further, Snail has been shown to bring about repression by recruitment of HDAC1/2 complex at the E-cadherin locus (47).
To determine whether any chromatin changes occur as a consequence of Snail binding at the ER-α locus, we assessed histone modifications at the ER-α promoter using the ChIP assay. To establish a baseline, we compared the two breast carcinoma cell lines, MCF-7 (which expresses ER-α and is estradiol-dependent for growth) and MDA-MB-231 (ER-α negative cell line which is estradiol-independent for growth). By tiling PCR amplicons, we surveyed an approximately 9.3 kb stretch of DNA encompassing the ER-α promoter, CpG island and part of the first intron (Figure 6A). In the ER-α positive, MCF-7 cell line, we found significant enrichment of histone H3K9 acetylation levels, but low or nonexistent H3K9 trimethylation levels (Figure 6B). In contrast, the ER-α negative MDA-MB-231 cell line exhibits high histone H3K9 trimethylation, but low levels of H3K9 acetylation (Figure 6B). Further, these marks appear to be centered on a certain region of the CpG island of ER-α encompassed by the primer set ‘M’, which encompasses a putative Snail binding site (Figures 6A and B). Also of interest, the NotI site identified by Ottaviano and colleagues (48) as the critical target of aberrant DNA methylation in breast cancer cells is 66bp upstream of this primer set. Next, we investigated whether Snail expression can alter the chromatin landscape at the ER-α locus. We observed an approximately four-fold decrease in acetylation at the ER-α promoter in Snail- versus control- adenovirus expressing MCF-7 cells (Figure 6C) over the region encompassed by primer set M, and a general decrease in acetylation levels over the rest of the region surveyed. However, there was no significant increase in the levels of histone H3K9 trimethylation at this promoter over the CpG island (Figure 6C), suggesting that histone H3K9 trimethylation is probably acquired over time, and the immediate role of Snail binding is to repress ER-α expression, but not permanently silence the locus.
Figure 6. Snail elicits changes in histone H3K9 modifications at the ER-α promoter.

(A) Schematic representation of the primer sets used in chromatin IP covering ∼9.3Kb of ER-α promoter region. The putative Snail binding sites are depicted as well.
(B) Chromatin IP (ChIP) was performed using antibodies against acetylated and trimethylated histone H3K9, with Rabbit IgG as a negative control. A survey of ChIP DNA across the ER-α locus reveals a peak of histone H3K9 acetylation over the region encompassed by primer set ‘M’ in MCF-7 cells (top left panel). This peak is also present in MCF-7 cells treated with control (bottom left) or Snail (bottom right) adenovirus. However, the peak of acetylation in Snail-infected cells is decreased about two-fold relative to control-treated cells. In MDA-MB-231 cells (top right), on the other hand, there is virtually no histone H3K9 acetylation; instead a peak of histone H3K9 trimethylation is seen around primer set ‘M’. Data are representative of three independent biological replicates. The data are normalized as indicated in the materials and methods.
Analysis of existing microarray data reveals a negative correlation between Snail and ER-α in human breast tumors
Moody and colleagues identified a significant negative correlation between Snail and ER-α in two out of four microarray data sets examined (p values were well below 0.01) (22), suggesting that the presence of Snail had a predictive value for tumor recurrence. We analyzed three datasets to determine whether a relationship between ER-α expression and Snail exists in human breast tumor samples. As reported previously (49), Wang and colleagues classified expression profiles from patients with ER-α positive or negative tumors. By t-test, we confirmed differential expression of Snail in this dataset. Snail is expressed more frequently in the ER-α negative subset (p-value of 1.6 E-05, see Table 1). Sotiriou and colleagues (50) reported microarray data from 189 invasive breast carcinomas. When we compared Snail expression in those samples that were positive for ER-α versus those that were negative, we found a significant difference between the two (t-test, p-value=7.2 E-10, Table 1). Finally, Hess et al analyzed 133 patients with stage I-III breast cancer for expression of various genes using an Affymetrix U133A chip. Cases where ≥10% of tumor cells stained positive for ER with immunohistochemistry (IHC) were considered positive (51). A comparison of Snail expression indicated a substantial negative correlation with ER-α (t-test, p value of 1.15 E-05, Table 1). Further, correlation between Snail and ER-α in these three datasets were tested by Pearson correlation coefficient, the values of which also revealed a significant negative association (See Table 1). Thus, the reciprocal relationship we have observed in MCF-7 cells with respect to Snail expression being mutually exclusive with ER-α is supported by microarray analyses of primary tumor material.
Table 1. Microarray data analysis of three datasets from the Oncomine database comparing ER-α to Snail expression.
We analyzed three datasets by t-test and Pearson correlation (see text for details) to determine the relationship between Snail and ER-α in these microarray analyses of tumor samples
Discussion
The transcriptional factor Snail plays important roles in both normal development (13-15, 19) and cancer (17-19). This zinc finger protein, upon association with a variant of the E-box motif, CAGGTG, is thought to recruit corepressors such as CtBP (52), the HDAC1/2 complex and Sin3a (47, 53), resulting in transcriptional repression. In cancers, the pathological expression of Snail and its close relative, Slug, is associated with a migratory, mesenchymal phenotype arising from a loss of expression of molecules integral to the epithelial phenotype, including cell-cell adhesion molecules like E-cadherin (17, 18, 42, 54-56) and occludin (20, 57). This loss of hallmark structures and physiologic properties associated with epithelia and the gain of new properties, including migratory and invasive growth patterns, are characteristic of the epithelial to mesenchymal transitions critical to normal development and postulated to influence cancer progression.
Previous studies have led to a proposed genetic pathway acting in breast cancer cells (Figure 7) that regulates the process of EMT through an indirect action of the estrogen receptor alpha (12, 35). In this model, ER-α serves as a master regulator and directs synthesis of MTA3, a key component of the Mi-2/NuRD chromatin remodeling complex. MTA3, in turn, directly represses transcription of the Snail locus, resulting in maintenance of a differentiated, epithelial phenotype (Figure 7). Thus, ER-α and MTA3 are associated with an epithelial cell morphology, while Snail expression favors a more mesenchymal phenotype. In the current work, we have addressed the molecular outcome of aberrant Snail expression in an epithelial model of breast cancer and observed two important consequences, direct transcriptional repression of the ER-α locus by Snail and activation of key components of the TGF-β signaling pathway.
Figure 7. A model for interactions between ER-α, Snail and the TGF-β pathways in breast cancer.

TGF-β and ER-α pathways are mutually exclusive in breast cancer cells, and Snail helps the switch from ER-α to TGF-β regulation. Features of this model are described in more detail in the text.
From a broader perspective, however, there is as yet no direct evidence in tumors in vivo that this change in phenotype from ER-α positive to ER-α negative is the immediate consequence of Snail expression and hence EMT. Indeed, there are instances of advanced tumors that are not responsive to treatment with tamoxifen, but are nevertheless estrogen receptor positive (58). It has been also suggested that the presence or absence of progesterone receptor might play an important role in this lack of response to tamoxifen (58). While the exact mechanisms leading to loss of ER-α expression are currently uncertain, recent work suggests that activation of growth factor receptor pathways such as EGF, IGF-1, transforming growth factor ß, and heregulin may contribute to estrogen receptor loss. For instance, the Type I insulin-like growth factor receptor (IGF-IR) has been shown to influence EMT in MCF10A, an immortalized mammary epithelial cell line, via inhibition of GSK3-β, leading to upregulation of Snail, NF-κB, and subsequent downregulation of E-cadherin (59). While some of these pathways have indirect relationships with Snail and could thus bring about loss of ER-α, whether or not Snail influences EMT via any/all of the other pathways is currently unclear.
The finding that Snail directly represses ER-α expression in breast cancer cell lines suggests the genetic pathway put forth by the work of Fujita and colleagues (12, 35) is a complex regulatory circuit rather than a simple, linear pathway (Figure 7). While ER-α represses Snail indirectly through the action of MTA3, Snail in turn can directly repress ER-α and compromise the downstream transcriptional program. Our observation that Snail impacts the function of this key transcriptional regulator mirrors the finding that Snail directly represses the Vitamin D receptor in colon cancer, leading to an altered phenotype and dramatically worse prognosis (25). It is conceivable that a common strategy utilized by EMT-inducing transcription factors including Snail may be to not only impact structural components of epithelial cells but also to disable key regulatory transcription factors that govern the epithelial program.
Histone methylation marks such as H3K9 trimethylation are often associated with repressed genes (43, 44). DNA methylation is another epigenetic modification thought to be more prevalent at loci that are repressed and/or silenced. Recent work has also established a connection between histone H3 trimethylation at lysine 9 and DNA methylation in many different model systems (60, 61). The CpG island at the ER-α promoter has been shown to be heavily methylated in ER-α negative cell lines, but not in ER-α positive cells lines (48). We found that histone H3K9 trimethylation is enriched over the ER-α promoter in MDA-MB-231 breast cancer cells but not in MCF-7 cells (Figure 6B). Snail expression in MCF-7 cells leads to a decrease in histone H3K9 acetylation, but no corresponding increase in histone H3K9 trimethylation (Figure 6C). This inverse correlation between H3K9 acetylation and trimethylation corresponds with what was observed at the PABPC1 gene (62). This suggests that while the initial role of Snail is to bring about a loss of ER-α transcript, as evidenced by loss of histone acetylation, events that occur after Snail binding may set the stage for histone methylation events associated with long-term silencing of ER-α gene expression. A recent study in human embryonic stem cells seems to suggest that the promoters of several genes exist in a ‘poised’ state, ready for transcription to initiate, whether or not their transcripts are readily detectable (63), similar to heat shock promoters (64). These promoters displayed histone modifications characteristic of actively transcribing genes as well as the presence of appropriately phosphorylated forms of RNA Polymerase II. The fact that we detect Snail in the ER-α intronic region and that histone acetylation at the ER-α promoter is not completely lost, leads to the speculation that Snail may serve to maintain the promoter in a quiescent state till the appropriate signals to either silence or activate it are received. Given that Snail is thought to bring about EMT leading to invasive growth and metastasis, one can speculate that the events leading to long-term repression might be dependent on the environment the cells are exposed to after they have metastasized.
Studies in mammary epithelia have demonstrated an inverse relationship between the estrogen receptor and TGF-β signaling pathways. While estrogen serves to stimulate cell growth and proliferation (5, 10), TGF-β has been shown to arrest the cell-cycle (30). Breast cancer cells, on the other hand, are able to overcome the cell cycle block imposed by TGF-β through various mechanisms, such as loss of the TGF-β receptor type II (31, 32). In addition to effects on cell cycle progression, the TGF-β signaling pathway leads to epithelial to mesenchymal transitions in some instances (27, 28, 65, 66). One mechanism by which TGF-β promotes this phenotypic change is through induction of EMT-promoting transcription factors, including Snail (28, 67). Exogenous expression of Snail in ER-α positive cells, as reported here, led to an upregulation of TGF-β pathway components (Figures 4 and 9), suggesting that activation of Snail in cancer cells may be self-reinforcing through an autocrine signaling pathway.
In normal cells, there appears to be a delicate balance between the activities of the estrogen and TGF-β pathways. This balance regulates structural components central to cell shape, cell cycle progression, and growth patterns. Each pathway exerts its influence on cells, in part, through activation of key regulatory transcription factors. During the process of malignant transformation, cells lose the balance in signaling with predictable results on cell behavior. This loss of equilibrium between opposing signaling pathways is reflected in the striking negative correlation between ER-α and Snail in tumors, as exemplified by microarray analyses. This situation likely reflects a basic strategy adopted by master regulatory transcription factors to impact multiple targets integral to phenotype, including transcription factors governing opposing pathways.
Materials and Methods
Cell culture and adenovirus methods
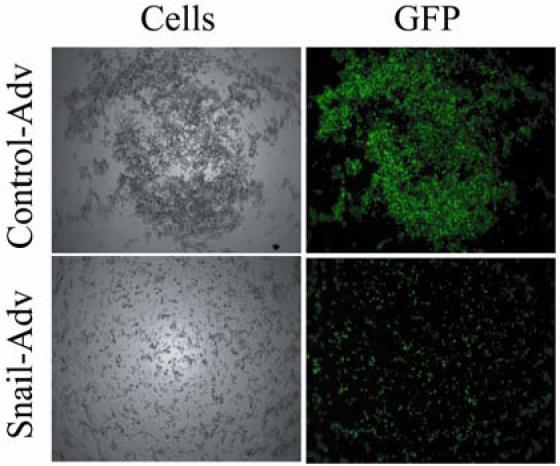
Human breast carcinoma cell lines MCF-7, MDA-MB-231 and T-47D were obtained from the American Type Culture Collection (ATCC) and cultured in DMEM/F-12 medium supplemented with 10% FBS (GIBCO). Adenoviruses for expression of Snail and GFP (green fluorescent protein) or control (GFP alone) were prepared as described previously (36). MCF-7 cells were titrated with varying amounts of the viruses to determine the amount (in μl) that would result in around 80-90% infection of the cells with either Snail or control adenoviruses in the experiments described.
siRNA
After overnight culture of MCF-7 cells in a 6 well dish, the medium was replaced with 2ml new medium (DMEM + 10% FBS and no antibiotics) and transfected with siRNA (from Dharmacon) using Lipofectamine™ 2000 (Invitrogen) against ER-α or GFP (negative control) for a further period of 48 hours (using the manufacturer’s protocol). Total RNA was extracted using Trizol reagent (Invitrogen) and cDNA was prepared by reverse transcriptase PCR using random hexamer priming. To quantify nascent RNA, PCR with real-time quantitation was performed using SYBR-green in an iCycler system (Bio-Rad) as previously described (36). 18S RNA was used as a normalization control. Quantitation was performed using the comparative Ct method, using the formula 2-[delta] [delta]Ct, where [delta][delta]Ct = [delta]Ct,sample - [delta]Ct,reference (18S in this case). The fold change was calculated as a ratio of siRNA to control (GFP). Data shown are an average of three independent biological experiments.
Slow aggregation assay (Agar assay)
The assay was performed as previously described (37) with the following adaptations. Briefly, MCF-7 cells were infected with Snail - or Control-adenovirus for 3 days. The infected cells were trypsinized, resuspended in serum-free DMEM/F-12 medium lacking phenol red, and 10,000 cells were seeded on agar (dissolved in DMEM/F-12 media without 10% FBS, without phenol red) in a 96-well plate and placed in a CO2 incubator for a further period of 24 hours. They were then examined using a 5X lens on the Zeiss Axiovert 200M microscope (Zeiss Microimaging Inc.). Data are representative of three independent biological experiments.
Invasion assay
Nucleopore track-etch membranes (Whatman, 13mm diameter, 8μm pore size) were prepared by coating with Growth factor- reduced Matrigel without Phenol red (BD Biosciences). Boyden chambers were prepared with the lower chamber containing DMEM/F-12 with 10% FBS and the membranes were placed above the lower chamber with the coated side facing up. MCF-7 cells were infected with adenovirus, resuspended in media without FBS and counted; and 20,000 cells were then seeded in the upper chamber. The FBS in the lower chamber served as the attractant. After 24 hours of incubation in a 37°C CO2 incubator, the membranes were removed and the cells on the surface were scraped off. The cells that had invaded to the other side of membrane were then fixed and stained with the Diff-Quik Stain kit (Dade Behring) and mounted on glass slides using permount. The cells were counted using a 5X lens on the Zeiss Axiovert 200M microscope (Zeiss Microimaging Inc.). Data shown are an average of three biological replicates. A t-distribution analysis was performed on the samples within each set (single asterisk * indicates p-value≤0.05, ** indicates p-value ≤ 0.01). A two-sample t-test comparing Snail to control-treated samples showed a p-value of 0.01.
Reverse transcription-polymerase chain reaction (RT-PCR) analysis
Total RNA was extracted using Trizol (Invitrogen) reagent. cDNA was synthesized with MuMLV reverse transcriptase using random hexamer priming. To quantify nascent RNA, RT-PCR with real-time quantitation was performed using SYBR-green with an iCycler system (Bio-Rad) as previously described (36). Quantitation was performed using the comparative Ct method or the 2-[delta][delta]Ct method, (18S was used as a reference). The fold change between control and Snail for each gene was then calculated as a ratio using this value. The ratio of control to Snail (or Snail to control) was then normalized to the value obtained for Day 0 (untreated sample). Data shown are an average of three biological replicates. A t-distribution test was performed on the samples within each set (single asterisk * indicates p-value≤0.05, ** indicates p-value ≤ 0.01). RT-PCR primer sets for ER-α, occludin and 18S were obtained from Qiagen (Quantitect primers). Primer sets for Snail and Slug RT-PCR are shown in Supplemental Table 1.
Antibodies and immunoblotting
Antibodies utilized include Snail (Abcam ab17732), Occludin (Zymed 33-1500), Actin (Chemicon MAB1501) and ER-α (Santa Cruz sc-8005). MCF-7 cells were grown in DMEM/F-12, infected with control or Snail-expressing adenovirus for 2 days. Cells were washed with 1X Phosphate buffered saline (PBS) and total protein was isolated using a Urea-SDS Lysis buffer (8M Urea, 1% SDS in 0.126M Tris-HCl, pH 6.8). Immunoblotting was performed using standard procedures as described previously (36).
Immunofluorescence Staining
MCF-7 cells were seeded on glass coverslips in 6-well tissue culture dishes and infected with control or Snail adenovirus for 2 days. They were fixed with 4% formaldehyde in PBS for 10 minutes, washed with PBS and permeabilized with 0.1% Triton-X for 2 minutes, washed with PBS and blocked with 5% Bovine Serum Albumin (BSA) in PBS. They were then incubated with the primary antibody (anti-ER-α or anti-Occludin) for 1 hour, washed with PBS and incubated with the secondary antibody (Alexa Fluor®568) for 1 hour, washed with PBS and mounted on glass slides with mounting medium containing DAPI. The slides were examined and photographed using a Zeiss Axiovert 200M microscope (Zeiss Microimaging Inc.). Data are representative of at least three biological replicates. Arrowheads indicate adenovirus-infected cells.
Chromatin Immunoprecipitation Analysis (ChIP)
Chromatin Immunoprecipitation was performed as previously described (68) with the following exceptions. In brief, cells were crosslinked with 1% formaldehyde for 10 minutes at 37°C, quenched with glycine and PBS, and then sonicated using a Bioruptor™ (Diagenode) to generate 300-600bp DNA fragments. Immunoprecipitation was performed with the antibodies indicated, and IgG was used as a control. Precipitated DNAs were detected by PCR using specific primers (see Supplementary Table 1). Real time quantitation using SYBR-green (Bio-Rad) was performed on immunoprecipitated DNA and the percent input for each sample was calculated based on a standard curve using 10%, 1%, 0.1% and 0.01% of input DNA. The fold enrichment for Snail was then determined by normalizing to the IgG-immunoprecipitated DNA. As we observed a low level of background Snail binding at the β-actin locus, this fold change (anti-Snail vs. IgG) was further normalized to the enrichment observed at β-actin with the Snail antibody, which served as a background control. The data shown therefore represent fold-change of material immunoprecipitated with the Snail antibody versus that seen with IgG, and subsequently normalized to Snail binding at the beta-Actin intron, which has no known Snail binding sites. Data shown are an average of three biological replicates.
For the histone modification ChIPs, the values are normalized to the highest enrichment (primer set M, histone H3K9Acetylation) seen (i.e. MCF-7 in 6B and to MCF-7 with control adenovirus in 6C) and are represented as a percentage of enrichment observed with primer set M. Antibodies utilized include Snail (Abcam ab17732), Histone H3K9 acetyl (Upstate 07-352) and Histone H3K9 trimethyl (Abcam ab8898-100). Data shown are representative of three independent biological experiments.
Supplementary Material
Acknowledgements
We would like to thank Sherry Grissom and Jonathan Miller in the Microarray facility at NIEHS for help with analysis of microarray datasets and Dr. Grace Kissling from the biostatistics branch at NIEHS for help with statistical analyses. We also thank Dr. Harriet K. Kinyamu for advice and help with ChIP and Mark Rubino for help with the invasion assay. This manuscript was significantly improved by critical comments offered by Drs. Trevor Archer, John Couse, and Harriet Kinyamu.
This work was supported by the Intramural Research Program of the National Institute of Environmental Health Science, NIH.
Footnotes
DISCLOSURE STATEMENT: The authors have nothing to disclose.
References
- 1.Lapidus RG, Nass SJ, Davidson NE. The loss of estrogen and progesterone receptor gene expression in human breast cancer. J Mammary Gland Biol Neoplasia. 1998;3:85–94. doi: 10.1023/a:1018778403001. [DOI] [PubMed] [Google Scholar]
- 2.Ferguson AT, Lapidus RG, Davidson NE. The regulation of estrogen receptor expression and function in human breast cancer. Cancer Treat Res. 1998;94:255–278. doi: 10.1007/978-1-4615-6189-7_14. [DOI] [PubMed] [Google Scholar]
- 3.Prall OW, Rogan EM, Sutherland RL. Estrogen regulation of cell cycle progression in breast cancer cells. J Steroid Biochem Mol Biol. 1998;65:169–174. doi: 10.1016/s0960-0760(98)00021-1. [DOI] [PubMed] [Google Scholar]
- 4.Clarke RB, Anderson E, Howell A. Steroid receptors in human breast cancer. Trends Endocrinol Metab. 2004;15:316–323. doi: 10.1016/j.tem.2004.07.004. [DOI] [PubMed] [Google Scholar]
- 5.Nilsson S, Makela S, Treuter E, Tujague M, Thomsen J, Andersson G, Enmark E, Pettersson K, Warner M, Gustafsson JA. Mechanisms of estrogen action. Physiol Rev. 2001;81:1535–1565. doi: 10.1152/physrev.2001.81.4.1535. [DOI] [PubMed] [Google Scholar]
- 6.Nilsson S, Gustafsson JA. Estrogen receptor transcription and transactivation: Basic aspects of estrogen action. Breast Cancer Res. 2000;2:360–366. doi: 10.1186/bcr81. [DOI] [PMC free article] [PubMed] [Google Scholar]
- 7.Deroo BJ, Korach KS. Estrogen receptors and human disease. J Clin Invest. 2006;116:561–570. doi: 10.1172/JCI27987. [DOI] [PMC free article] [PubMed] [Google Scholar]
- 8.Mangelsdorf DJ, Thummel C, Beato M, Herrlich P, Schutz G, Umesono K, Blumberg B, Kastner P, Mark M, Chambon P, Evans RM. The nuclear receptor superfamily: the second decade. Cell. 1995;83:835–839. doi: 10.1016/0092-8674(95)90199-x. [DOI] [PMC free article] [PubMed] [Google Scholar]
- 9.Tsai MJ, O’Malley BW. Molecular mechanisms of action of steroid/thyroid receptor superfamily members. Annu Rev Biochem. 1994;63:451–486. doi: 10.1146/annurev.bi.63.070194.002315. [DOI] [PubMed] [Google Scholar]
- 10.McDonnell DP, Norris JD. Connections and regulation of the human estrogen receptor. Science. 2002;296:1642–1644. doi: 10.1126/science.1071884. [DOI] [PubMed] [Google Scholar]
- 11.Couse JF, Korach KS. Estrogen receptor null mice: what have we learned and where will they lead us? Endocr Rev. 1999;20:358–417. doi: 10.1210/edrv.20.3.0370. [DOI] [PubMed] [Google Scholar]
- 12.Fujita N, Jaye DL, Kajita M, Geigerman C, Moreno CS, Wade PA. MTA3, a Mi-2/NuRD complex subunit, regulates an invasive growth pathway in breast cancer. Cell. 2003;113:207–219. doi: 10.1016/s0092-8674(03)00234-4. [DOI] [PubMed] [Google Scholar]
- 13.Alberga A, Boulay JL, Kempe E, Dennefeld C, Haenlin M. The snail gene required for mesoderm formation in Drosophila is expressed dynamically in derivatives of all three germ layers. Development. 1991;111:983–992. doi: 10.1242/dev.111.4.983. [DOI] [PubMed] [Google Scholar]
- 14.Nieto MA, Bennett MF, Sargent MG, Wilkinson DG. Cloning and developmental expression of Sna, a murine homologue of the Drosophila snail gene. Development. 1992;116:227–237. doi: 10.1242/dev.116.1.227. [DOI] [PubMed] [Google Scholar]
- 15.Smith DE, Franco del Amo F, Gridley T. Isolation of Sna, a mouse gene homologous to the Drosophila genes snail and escargot: its expression pattern suggests multiple roles during postimplantation development. Development. 1992;116:1033–1039. doi: 10.1242/dev.116.4.1033. [DOI] [PubMed] [Google Scholar]
- 16.Carver EA, Jiang R, Lan Y, Oram KF, Gridley T. The mouse snail gene encodes a key regulator of the epithelial-mesenchymal transition. Mol Cell Biol. 2001;21:8184–8188. doi: 10.1128/MCB.21.23.8184-8188.2001. [DOI] [PMC free article] [PubMed] [Google Scholar]
- 17.Cano A, Perez-Moreno MA, Rodrigo I, Locascio A, Blanco MJ, del Barrio MG, Portillo F, Nieto MA. The transcription factor snail controls epithelial-mesenchymal transitions by repressing E-cadherin expression. Nat Cell Biol. 2000;2:76–83. doi: 10.1038/35000025. [DOI] [PubMed] [Google Scholar]
- 18.Batlle E, Sancho E, Franci C, Dominguez D, Monfar M, Baulida J, Garcia De Herreros A. The transcription factor snail is a repressor of E-cadherin gene expression in epithelial tumour cells. Nat Cell Biol. 2000;2:84–89. doi: 10.1038/35000034. [DOI] [PubMed] [Google Scholar]
- 19.Nieto MA. The snail superfamily of zinc-finger transcription factors. Nat Rev Mol Cell Biol. 2002;3:155–166. doi: 10.1038/nrm757. [DOI] [PubMed] [Google Scholar]
- 20.Ikenouchi J, Matsuda M, Furuse M, Tsukita S. Regulation of tight junctions during the epithelium-mesenchyme transition: direct repression of the gene expression of claudins/occludin by Snail. J Cell Sci. 2003;116:1959–1967. doi: 10.1242/jcs.00389. [DOI] [PubMed] [Google Scholar]
- 21.Greenburg G, Hay ED. Epithelia suspended in collagen gels can lose polarity and express characteristics of migrating mesenchymal cells. J Cell Biol. 1982;95:333–339. doi: 10.1083/jcb.95.1.333. [DOI] [PMC free article] [PubMed] [Google Scholar]
- 22.Moody SE, Perez D, Pan TC, Sarkisian CJ, Portocarrero CP, Sterner CJ, Notorfrancesco KL, Cardiff RD, Chodosh LA. The transcriptional repressor Snail promotes mammary tumor recurrence. Cancer Cell. 2005;8:197–209. doi: 10.1016/j.ccr.2005.07.009. [DOI] [PubMed] [Google Scholar]
- 23.Davidson NE, Sukumar S. Of Snail, mice, and women. Cancer Cell. 2005;8:173–174. doi: 10.1016/j.ccr.2005.08.006. [DOI] [PubMed] [Google Scholar]
- 24.Yook JI, Li XY, Ota I, Fearon ER, Weiss SJ. Wnt-dependent regulation of the E-cadherin repressor snail. J Biol Chem. 2005;280:11740–11748. doi: 10.1074/jbc.M413878200. [DOI] [PubMed] [Google Scholar]
- 25.Larriba MJ, Munoz A. SNAIL vs vitamin D receptor expression in colon cancer: therapeutics implications. Br J Cancer. 2005;92:985–989. doi: 10.1038/sj.bjc.6602484. [DOI] [PMC free article] [PubMed] [Google Scholar]
- 26.Jamora C, Lee P, Kocieniewski P, Azhar M, Hosokawa R, Chai Y, Fuchs E. A signaling pathway involving TGF-beta2 and snail in hair follicle morphogenesis. PLoS Biol. 2005;3:e11. doi: 10.1371/journal.pbio.0030011. [DOI] [PMC free article] [PubMed] [Google Scholar]
- 27.Zavadil J, Bottinger EP. TGF-beta and epithelial-to-mesenchymal transitions. Oncogene. 2005;24:5764–5774. doi: 10.1038/sj.onc.1208927. [DOI] [PubMed] [Google Scholar]
- 28.Medici D, Hay ED, Goodenough DA. Cooperation between snail and LEF-1 transcription factors is essential for TGF-beta1-induced epithelial-mesenchymal transition. Mol Biol Cell. 2006;17:1871–1879. doi: 10.1091/mbc.E05-08-0767. [DOI] [PMC free article] [PubMed] [Google Scholar]
- 29.ten Dijke P, Hill CS. New insights into TGF-beta-Smad signalling. Trends Biochem Sci. 2004;29:265–273. doi: 10.1016/j.tibs.2004.03.008. [DOI] [PubMed] [Google Scholar]
- 30.Siegel PM, Massague J. Cytostatic and apoptotic actions of TGF-beta in homeostasis and cancer. Nat Rev Cancer. 2003;3:807–821. doi: 10.1038/nrc1208. [DOI] [PubMed] [Google Scholar]
- 31.Sun L, Wu G, Willson JK, Zborowska E, Yang J, Rajkarunanayake I, Wang J, Gentry LE, Wang XF, Brattain MG. Expression of transforming growth factor beta type II receptor leads to reduced malignancy in human breast cancer MCF-7 cells. J Biol Chem. 1994;269:26449–26455. [PubMed] [Google Scholar]
- 32.Brattain MG, Ko Y, Banerji SS, Wu G, Willson JK. Defects of TGF-beta receptor signaling in mammary cell tumorigenesis. J Mammary Gland Biol Neoplasia. 1996;1:365–372. doi: 10.1007/BF02017392. [DOI] [PubMed] [Google Scholar]
- 33.Ammanamanchi S, Kim SJ, Sun LZ, Brattain MG. Induction of transforming growth factor-beta receptor type II expression in estrogen receptor-positive breast cancer cells through SP1 activation by 5-aza-2′-deoxycytidine. J Biol Chem. 1998;273:16527–16534. doi: 10.1074/jbc.273.26.16527. [DOI] [PubMed] [Google Scholar]
- 34.Murthy MS, Scanlon EF, Jelachich ML, Klipstein S, Goldschmidt RA. Growth and metastasis of human breast cancers in athymic nude mice. Clin Exp Metastasis. 1995;13:3–15. doi: 10.1007/BF00144013. [DOI] [PubMed] [Google Scholar]
- 35.Fujita N, Kajita M, Taysavang P, Wade PA. Hormonal regulation of metastasis-associated protein 3 transcription in breast cancer cells. Mol Endocrinol. 2004;18:2937–2949. doi: 10.1210/me.2004-0258. [DOI] [PubMed] [Google Scholar]
- 36.Kajita M, McClinic KN, Wade PA. Aberrant expression of the transcription factors snail and slug alters the response to genotoxic stress. Mol Cell Biol. 2004;24:7559–7566. doi: 10.1128/MCB.24.17.7559-7566.2004. [DOI] [PMC free article] [PubMed] [Google Scholar]
- 37.Boterberg T, Vennekens KM, Thienpont M, Mareel MM, Bracke ME. Internalization of the E-cadherin/catenin complex and scattering of human mammary carcinoma cells MCF-7/AZ after treatment with conditioned medium from human skin squamous carcinoma cells COLO 16. Cell Adhes Commun. 2000;7:299–310. doi: 10.3109/15419060009015001. [DOI] [PubMed] [Google Scholar]
- 38.Albini A, Iwamoto Y, Kleinman HK, Martin GR, Aaronson SA, Kozlowski JM, McEwan RN. A rapid in vitro assay for quantitating the invasive potential of tumor cells. Cancer Res. 1987;47:3239–3245. [PubMed] [Google Scholar]
- 39.Kleinman HK, McGarvey ML, Hassell JR, Star VL, Cannon FB, Laurie GW, Martin GR. Basement membrane complexes with biological activity. Biochemistry. 1986;25:312–318. doi: 10.1021/bi00350a005. [DOI] [PubMed] [Google Scholar]
- 40.Bae SN, Arand G, Azzam H, Pavasant P, Torri J, Frandsen TL, Thompson EW. Molecular and cellular analysis of basement membrane invasion by human breast cancer cells in Matrigel-based in vitro assays. Breast Cancer Res Treat. 1993;24:241–255. doi: 10.1007/BF01833264. [DOI] [PubMed] [Google Scholar]
- 41.Come C, Arnoux V, Bibeau F, Savagner P. Roles of the transcription factors snail and slug during mammary morphogenesis and breast carcinoma progression. J Mammary Gland Biol Neoplasia. 2004;9:183–193. doi: 10.1023/B:JOMG.0000037161.91969.de. [DOI] [PMC free article] [PubMed] [Google Scholar]
- 42.De Craene B, Gilbert B, Stove C, Bruyneel E, van Roy F, Berx G. The transcription factor snail induces tumor cell invasion through modulation of the epithelial cell differentiation program. Cancer Res. 2005;65:6237–6244. doi: 10.1158/0008-5472.CAN-04-3545. [DOI] [PubMed] [Google Scholar]
- 43.Hake SB, Xiao A, Allis CD. Linking the epigenetic ‘language’ of covalent histone modifications to cancer. Br J Cancer. 2007;96(Suppl):R31–39. [PubMed] [Google Scholar]
- 44.Strahl BD, Allis CD. The language of covalent histone modifications. Nature. 2000;403:41–45. doi: 10.1038/47412. [DOI] [PubMed] [Google Scholar]
- 45.Kawai H, Li H, Avraham S, Jiang S, Avraham HK. Overexpression of histone deacetylase HDAC1 modulates breast cancer progression by negative regulation of estrogen receptor alpha. Int J Cancer. 2003;107:353–358. doi: 10.1002/ijc.11403. [DOI] [PubMed] [Google Scholar]
- 46.Yang X, Phillips DL, Ferguson AT, Nelson WG, Herman JG, Davidson NE. Synergistic activation of functional estrogen receptor (ER)-alpha by DNA methyltransferase and histone deacetylase inhibition in human ER-alpha-negative breast cancer cells. Cancer Res. 2001;61:7025–7029. [PubMed] [Google Scholar]
- 47.Peinado H, Ballestar E, Esteller M, Cano A. Snail mediates E-cadherin repression by the recruitment of the Sin3A/histone deacetylase 1 (HDAC1)/HDAC2 complex. Mol Cell Biol. 2004;24:306–319. doi: 10.1128/MCB.24.1.306-319.2004. [DOI] [PMC free article] [PubMed] [Google Scholar]
- 48.Ottaviano YL, Issa JP, Parl FF, Smith HS, Baylin SB, Davidson NE. Methylation of the estrogen receptor gene CpG island marks loss of estrogen receptor expression in human breast cancer cells. Cancer Res. 1994;54:2552–2555. [PubMed] [Google Scholar]
- 49.Wang Y, Klijn JG, Zhang Y, Sieuwerts AM, Look MP, Yang F, Talantov D, Timmermans M, Meijer-van Gelder ME, Yu J, Jatkoe T, Berns EM, Atkins D, Foekens JA. Gene-expression profiles to predict distant metastasis of lymph-node-negative primary breast cancer. Lancet. 2005;365:671–679. doi: 10.1016/S0140-6736(05)17947-1. [DOI] [PubMed] [Google Scholar]
- 50.Sotiriou C, Wirapati P, Loi S, Harris A, Fox S, Smeds J, Nordgren H, Farmer P, Praz V, Haibe-Kains B, Desmedt C, Larsimont D, Cardoso F, Peterse H, Nuyten D, Buyse M, Van de Vijver MJ, Bergh J, Piccart M, Delorenzi M. Gene expression profiling in breast cancer: understanding the molecular basis of histologic grade to improve prognosis. J Natl Cancer Inst. 2006;98:262–272. doi: 10.1093/jnci/djj052. [DOI] [PubMed] [Google Scholar]
- 51.Hess KR, Anderson K, Symmans WF, Valero V, Ibrahim N, Mejia JA, Booser D, Theriault RL, Buzdar AU, Dempsey PJ, Rouzier R, Sneige N, Ross JS, Vidaurre T, Gomez HL, Hortobagyi GN, Pusztai L. Pharmacogenomic predictor of sensitivity to preoperative chemotherapy with paclitaxel and fluorouracil, doxorubicin, and cyclophosphamide in breast cancer. J Clin Oncol. 2006;24:4236–4244. doi: 10.1200/JCO.2006.05.6861. [DOI] [PubMed] [Google Scholar]
- 52.Nibu Y, Zhang H, Bajor E, Barolo S, Small S, Levine M. dCtBP mediates transcriptional repression by Knirps, Kruppel and Snail in the Drosophila embryo. Embo J. 1998;17:7009–7020. doi: 10.1093/emboj/17.23.7009. [DOI] [PMC free article] [PubMed] [Google Scholar]
- 53.McGhee L, Bryan J, Elliott L, Grimes HL, Kazanjian A, Davis JN, Meyers S. Gfi-1 attaches to the nuclear matrix, associates with ETO (MTG8) and histone deacetylase proteins, and represses transcription using a TSA-sensitive mechanism. J Cell Biochem. 2003;89:1005–1018. doi: 10.1002/jcb.10548. [DOI] [PubMed] [Google Scholar]
- 54.Poser I, Dominguez D, de Herreros AG, Varnai A, Buettner R, Bosserhoff AK. Loss of E-cadherin expression in melanoma cells involves up-regulation of the transcriptional repressor Snail. J Biol Chem. 2001;276:24661–24666. doi: 10.1074/jbc.M011224200. [DOI] [PubMed] [Google Scholar]
- 55.Hiraguri S, Godfrey T, Nakamura H, Graff J, Collins C, Shayesteh L, Doggett N, Johnson K, Wheelock M, Herman J, Baylin S, Pinkel D, Gray J. Mechanisms of inactivation of E-cadherin in breast cancer cell lines. Cancer Res. 1998;58:1972–1977. [PubMed] [Google Scholar]
- 56.Perl AK, Wilgenbus P, Dahl U, Semb H, Christofori G. A causal role for E-cadherin in the transition from adenoma to carcinoma. Nature. 1998;392:190–193. doi: 10.1038/32433. [DOI] [PubMed] [Google Scholar]
- 57.Ohkubo T, Ozawa M. The transcription factor Snail downregulates the tight junction components independently of E-cadherin downregulation. J Cell Sci. 2004;117:1675–1685. doi: 10.1242/jcs.01004. [DOI] [PubMed] [Google Scholar]
- 58.Cui X, Schiff R, Arpino G, Osborne CK, Lee AV. Biology of progesterone receptor loss in breast cancer and its implications for endocrine therapy. J Clin Oncol. 2005;23:7721–7735. doi: 10.1200/JCO.2005.09.004. [DOI] [PubMed] [Google Scholar]
- 59.Kim HJ, Litzenburger BC, Cui X, Delgado DA, Grabiner BC, Lin X, Lewis MT, Gottardis MM, Wong TW, Attar RM, Carboni JM, Lee AV. Constitutively active type I insulin-like growth factor receptor causes transformation and xenograft growth of immortalized mammary epithelial cells and is accompanied by an epithelial-to-mesenchymal transition mediated by NF-kappaB and snail. Mol Cell Biol. 2007;27:3165–3175. doi: 10.1128/MCB.01315-06. [DOI] [PMC free article] [PubMed] [Google Scholar]
- 60.Hashimshony T, Zhang J, Keshet I, Bustin M, Cedar H. The role of DNA methylation in setting up chromatin structure during development. Nat Genet. 2003;34:187–192. doi: 10.1038/ng1158. [DOI] [PubMed] [Google Scholar]
- 61.Lehnertz B, Ueda Y, Derijck AA, Braunschweig U, Perez-Burgos L, Kubicek S, Chen T, Li E, Jenuwein T, Peters AH. Suv39h-mediated histone H3 lysine 9 methylation directs DNA methylation to major satellite repeats at pericentric heterochromatin. Curr Biol. 2003;13:1192–1200. doi: 10.1016/s0960-9822(03)00432-9. [DOI] [PubMed] [Google Scholar]
- 62.Vakoc CR, Sachdeva MM, Wang H, Blobel GA. Profile of histone lysine methylation across transcribed mammalian chromatin. Mol Cell Biol. 2006;26:9185–9195. doi: 10.1128/MCB.01529-06. [DOI] [PMC free article] [PubMed] [Google Scholar]
- 63.Guenther MG, Levine SS, Boyer LA, Jaenisch R, Young RA. A chromatin landmark and transcription initiation at most promoters in human cells. Cell. 2007;130:77–88. doi: 10.1016/j.cell.2007.05.042. [DOI] [PMC free article] [PubMed] [Google Scholar]
- 64.Lis J. Promoter-associated pausing in promoter architecture and postinitiation transcriptional regulation. Cold Spring Harb Symp Quant Biol. 1998;63:347–356. doi: 10.1101/sqb.1998.63.347. [DOI] [PubMed] [Google Scholar]
- 65.Ozdamar B, Bose R, Barrios-Rodiles M, Wang HR, Zhang Y, Wrana JL. Regulation of the polarity protein Par6 by TGFbeta receptors controls epithelial cell plasticity. Science. 2005;307:1603–1609. doi: 10.1126/science.1105718. [DOI] [PubMed] [Google Scholar]
- 66.Oft M, Heider KH, Beug H. TGFbeta signaling is necessary for carcinoma cell invasiveness and metastasis. Curr Biol. 1998;8:1243–1252. doi: 10.1016/s0960-9822(07)00533-7. [DOI] [PubMed] [Google Scholar]
- 67.Peinado H, Quintanilla M, Cano A. Transforming growth factor beta-1 induces snail transcription factor in epithelial cell lines: mechanisms for epithelial mesenchymal transitions. J Biol Chem. 2003;278:21113–21123. doi: 10.1074/jbc.M211304200. [DOI] [PubMed] [Google Scholar]
- 68.Fujita N, Wade PA. Use of bifunctional cross-linking reagents in mapping genomic distribution of chromatin remodeling complexes. Methods. 2004;33:81–85. doi: 10.1016/j.ymeth.2003.10.022. [DOI] [PubMed] [Google Scholar]
Associated Data
This section collects any data citations, data availability statements, or supplementary materials included in this article.