

Abstract
In vitro assessment of cytotoxicity based on electrochemical impedance spectroscopy (EIS) needs more quantitative methods to analyze the alteration of cell morphology and motility, and hence the potential risk to human health. Here, we applied electric cell-substrate impedance sensing (ECIS) to evaluate dose-dependent responses of human umbilical vein endothelial cells exposed to cytochalasin B. To detect subtle changes in cell morphology, the frequency-dependent impedance data of the cell monolayer were measured and analyzed with a theoretical cell-electrode model. To detect the alternation of cell micromotion in response to cytochalasin B challenge, time-series impedance fluctuations of cell-covered electrodes were monitored and the values of power spectrum, variance, and variance of the increments were calculated to verify the difference. While a dose-dependent relationship was generally observed from the overall resistance of the cell monolayer, the analysis of frequency-dependent impedance and impedance fluctuations distinguished cytochalasin B levels as low as 0.1 μM. Our results show that cytochalasin B causes a decrease of junctional resistance between cells, an increase of membrane capacitance, and the reduction in micromotion.
Keywords: ECIS, cytotoxicity, cytochalasin B, variance, power spectrum
1. Introduction
Among various cell-based assays, electrochemical impedance spectroscopy (EIS) using microelectrode arrays has emerged as a promising label-free method for detecting cellular responses to toxins of chemical or biological origin (Ceriotti et al., 2007; Keese et al., 1998; Slaughter et al., 2004; Xing et al., 2005). Electrochemical impedance measurements using microelectrodes have been first used to study the characteristics of anchorage dependent cultured cell lines by Giaever and Keese in 1984 (Giaever and Keese, 1984). The electric cell-substrate impedance sensing (ECIS) is a device developed by them that monitors the impedance of small gold electrodes used as substrata for cells in culture. The system has been extensively studied and can be used to detect subtle changes in the cell-substrata interactions including cell motion. Using this device, Giaever and Keese and other ECIS users have been able to measure cell attachment and spreading (Mitra et al., 1991), cell motility (Giaever and Keese, 1991; Lo et al., 1993), barrier function of cell layers (Tiruppathi et al., 1992), and in vitro toxicology (Keese et al., 1998; Ko et al., 1998; Xiao et al., 2002).
For ECIS and other EIS systems, the most commonly used assay for cytotoxicity test is to take the time course of overall impedance of a cell-covered electrode and then derive the half-inhibition concentration from the response function. It can be employed to follow cell attachment and spreading in response to different toxin concentrations and exposure time (Xiao et al., 2002). In this method, the toxic compound is added to the cell suspension right before cells are inoculated to electrode wells. Another way is to seed cells over the electrode wells until a confluent monolayer is achieved. Toxic compound is then added to the cell monolayer and impedance changes of the cell-covered electrode are followed (Ceriotti et al., 2007; Ehret et al., 2001; Xing et al., 2005; Yeon and Park, 2005). It has been shown that the half-inhibition concentrations determined by EIS assays agreed well with the values determined with standard biochemical methods, such as neutral red uptake (NRU), (3-(4,5-dimethylthiazol-2-yl)-2,5-diphenyltetrazolium bromide (MTT) test, lactate dehydrogenase (LDH) measurement, colony forming efficiency (CFE) growth assay, and standard luminescence-based methods (Ceriotti et al., 2007; Xiao et al., 2002; Xing et al., 2005).
Despite the documented success in the EIS measurement of the impedance time series and the derivation of the half-inhibition concentration, the application of EIS for cytotoxicity assessment can go considerably beyond this. As the name implies, it can be used to scan the sample impedance over a wide range of frequencies, typically covering several decades. Another promising and intriguing feature of the EIS assay is the noise analysis of the impedance time series. A few published ECIS results have demonstrated that cell motion may reveal itself as a fluctuation in the measured impedance, which is always associated with living cells and persists even when the cells grow into a confluent layer (Giaever and Keese, 1991; Lo et al., 1993).
The toxin cytochalasin B interferes with cytoskeleton function by inhibiting actin polymerization (Bonder and Mooseker, 1986; Brown and Spudich, 1981). At sufficiently high concentration, cytochalasin poisoning of cells leads to a number of morphological and functional effects, including arborization, inhibition of endocytosis and secretion, suppression of cytoplasmic division, and enucleation (Carter, 1967; Hirano and Kurimura, 1974; Ohmori et al., 1992). In the present study, ECIS was used to monitor human umbilical vein endothelial cells (HUVEC) in response to the challenge of cytochalasin B, ranging from zero to 10 μM. By performing both micromotion and frequency scan experiments and analyzing the impedance data, we are able to distinguish cytochalasin B levels as low as 0.1 μM, suggesting that these two methods provide a more sensitive assessment of cytotoxicity than the measurement of time course of overall impedance.
2. Materials and methods
2.1. Cell culture
The human umbilical vein endothelial cells (HUVEC) (Cambrex, Walkersville, MD) were cultured at 37°C and 5% CO2 in endothelial cell growth medium (EGM; Cambrex) which was supplemented with the following: 10 ng/ml human recombinant epidermal growth factor, 1 μg/ml hydrocortisone, 50 μg/ml getamicin, 50 ng/ml amphotericin B, 12 μg/ml bovine brain extract, and 2% fetal bovine serum (amounts indicate final concentration). Cells were subculture when they were 70% confluent, and the medium was changed every 48 hours thereafter. Only HUVECs passaged less than six times were used in experiments.
2.2. Measurement of impedance time course
Electrode arrays, relay bank, lock-in amplifier and software for the ECIS measurement and data analysis were obtained from Applied BioPhysics (Troy, NY). Each electrode array consisted of eight wells which was 1 cm in height and 0.8 cm2 in bottom area; each well contained a 250 μm diameter gold electrode (area ~ 5×10⁻⁴ cm2) and a much larger gold counter electrode. The large electrode and one of the small electrodes were connected via the relay bank to a phase-sensitive lock-in amplifier. A 1 volt AC signal at 4 kHz was applied to the sample through a 1 MΩresistor to maintain an approximately constant current of 1 microampere through the sample; i.e., the in-phase voltage was proportional to the resistance, and the out-of-phase voltage was proportional to the capacitive reactance. In all work reported, the electrodes were precoated with 0.2 mg/ml gelatin for 20 minutes before seeding HUVEC cells. For impedance measurement of the HUVEC monolayer upon addition of cytochalasin B, cells were plated into electrode wells at 105 cells/cm2 density and allowed to attach and spread for at least 24 hr before impedance was measured. After 24 hours in culture, the confluency and viability of the cell monolayer was confirmed by light microscopy and electrically by the impedance values. Cytochalasin B (Sigma-Aldrich, ST. Louis, MO) in DMSO or DMSO alone as a control was added to each cell-covered electrode well. The electrical impedance of each well was measured every 2 min and up to sixteen individual wells were followed successively. For detection of cell micromotion, impedance data of each well were taken every second with exquisite sensitivity until 2048 points had been acquired and then another well was measured. The time series data were normalized and numerically analyzed by calculating power spectrum, variance (the square of the standard deviation), and variance of the increments as we previously described (Lo et al., 1993).
2.3. Frequency scan measurement
Frequency scan is another main method in ECIS and measures impedance of the cell-electrode system as a function of frequency. To quantify the changes in cell morphology, we measured impedance for a cell-free electrode and the same electrode covered with cells at frequencies ranging from 25 Hz to 60 kHz with respective applied voltages ranging from 0.1 volt to 1 volt. By comparing the experimental data of confluent cell layers with the calculated values obtained from cell-electrode model, morphological parameters such as the junctional resistance between the cells (Rb) and the average cell-substrate separation (h) could be determined (Giaever and Keese, 1991). For cells with disk-like shape such as endothelial cells, we used the cell-electrode model with three adjustable parameters, Rb, α(= rc (ρ/h)1/2), and Cm, to fit the experiment data (Giaever and Keese, 1991):
| (1) |
where Zc is specific impedance (per unit area) of the cell-covered electrode, Zn is specific impedance of the cell-free electrode, Zm is specific impedance through both ventral and dorsal cell membranes, rc is cell radius, I0 and I1 are modified Bessel functions of the first kind in order 0 and 1, and
| (2) |
| (3) |
| (4) |
where ρ is resistivity of the cell culture medium, S is electrode area, Rn is measured resistance of the cell-free electrode, f is frequency of the AC signal, Cn is measured capacitance of the cell-free electrode, Rm is specific resistance of the cell membrane, and Cm is specific capacitance of the cell membrane (Lo et al., 1998).
3. Results and discussion
3.1. Effect of cytochalasin B on the time course of overall resistance
The effect of varying cytochalasin B concentration on the overall resistance of the HUVEC monolayer was monitored for 20 hours. Sixteen electrodes were followed one after another with each well’s data point requiring a few seconds. Although the impedance of each electrode well was set to be measured every 2 minutes, fluctuations were observed on each curve at different level. The data were first presented as the measure resistance normalized to its value at the start of each run (Fig. 1). At high concentrations of cytochalasin B such as 2.5, 5.0, or 10 μM with cells, a drastic drop of resistance was observed almost immediately following the addition. At low concentrations such as 0, 0.1, 0.5, and 1.0μM, the resistance drop was less evident. Noise analysis was also applied to characterize the normalized resistance time courses shown in Fig. 1. The variance and the variance of the increments of the data were calculated and plotted against time (Figs S1a and S1b in the supplement). Here the variance was calculated for the first 60 points of the data (data points 1 through 60) and this was plotted as one point. Next the 60 point data was shifted over one point (data points 2 through 61) and the variance was calculated and plotted. This process was continued until the last 60 points of data was read. To determine the variance of the increments, first all the increments of the successive data were calculated. Their variance was then calculated and plotted in the same way as described above. Decreased variance and variance of the increments for the cytochalasin B treated cells, as compared with controls, indicated reduced fluctuations in the resistance time course. Although overall resistance and its fluctuations indicate different aspects of cell activities, together these results suggest that while the three higher concentrations were easily distinguished from the four lowest, it was difficult to tell the differences among the three lowest concentrations.
Figure 1.

Normalized resistance measurements of a confluent HUVEC monolayer upon addition of different concentrations of cytochalasin B. Cells were inoculated into electrode-containing wells and allowed to develop into confluent layers for approximately 24 h. At the time indicated by the arrow, cytochalasin B diluted in DMSO was added to give the final concentrations of 0.1 μM (red), 0.5μM (blue), 1.0μM (green), 2.5μM (yellow), 5.0μM (violet), 10 μM (cyan), and control (black), and the resultant changes in normalized resistance were followed. Data were collected every 2 minutes for 20 hours.
3.2. Effect of cytochalasin B on junctional resistance and membrane capacitance
Cytochalasin B is known to disrupt actin filaments and rapidly affect cellular morphology (Ehret et al., 2001). Images of the confluent HUVEC monolayer subjected to different concentrations of cytochalasin B for 20 hours were taken and compared (data not shown). It was observed that cell layer exposed to toxin levels of 0, 0.1, 0.5, and 1 μM remained confluent, but cells exposed to 2.5, 5.0, and 10 μM contracted and became loose. To further understand the effect of cytochalasin B on morphological changes of a HUVEC monolayer, frequency scan measurements were taken from cell-covered electrodes 20 hours after exposure to different concentrations of cytochalasin B. To analyze differences in impedance curves, it is helpful to use normalized values, where the impedance values from the electrode confluent with HUVECs were divided by the corresponding quantities for the cell-free electrode (Fig. 2). For the control impedance spectrum (Black lines in Figs. 2a and 2b), the normalized resistance starts from ~1.0 at 25 Hz, increases with increasing frequency to the highest value, approximately ~7.0 at 4 kHz, and then decreases with increasing frequency until ~2.5 at 60 kHz. The reason for the peak is that the constriction resistance masks the resistance of the cell-covered electrode at high frequency (Giaever and Keese, 1991). Normalized capacitance on the other hand remains 0.95 from 25 Hz to 200 Hz and then decreases with increase in frequency until approximately 0.15 at 60 kHz. After fitting the experimental data with Eq. 1, the result indicated that upon challenge of 0, 0.1, 0.5, and 1 μM cytochalasin B, the junctional resistance between cells (Rb) dose-dependently decreased, indicating the alternation of cell morphology due to the perturbation of the actin filaments (Table 1). Furthermore, while the distance between the basolateral cell surface and substratum (h) slightly decreased, the membrane capacitance (Cm) dose-dependently increased, implying an increase of membrane folding. Notice that model analysis was unable to fit frequency scan data of the HUVEC monolayer exposed to 5.0 and 10 μM cytochalasin B since the cell monolayer under these conditions developed noticeable holes and was no longer confluent. Although the mean values for Rb at every concentration in Table 1 are separated from those at every other concentration by at least a standard error, Student’s t-Test for two-sample unequal variance show an insignificant (p = 0.09) separation between the control and 0.1 μM populations. All other pairs of populations are significantly separated (p < 0.009). As for the mean values of Cm, not only do they display a clear trend, they also show a significant (p < 0.01) separation between any pairs. In general, the specific capacitance of cell membranes is approximately 1 μF/cm2 but can appear to be much larger if the membrane wrinkles and its surface roughness becomes higher. Using frequency scan measurement the effect of cytochalasin B was discernible at levels as low as 0.1 μM, as Table 1 brought out.
Figure 2.
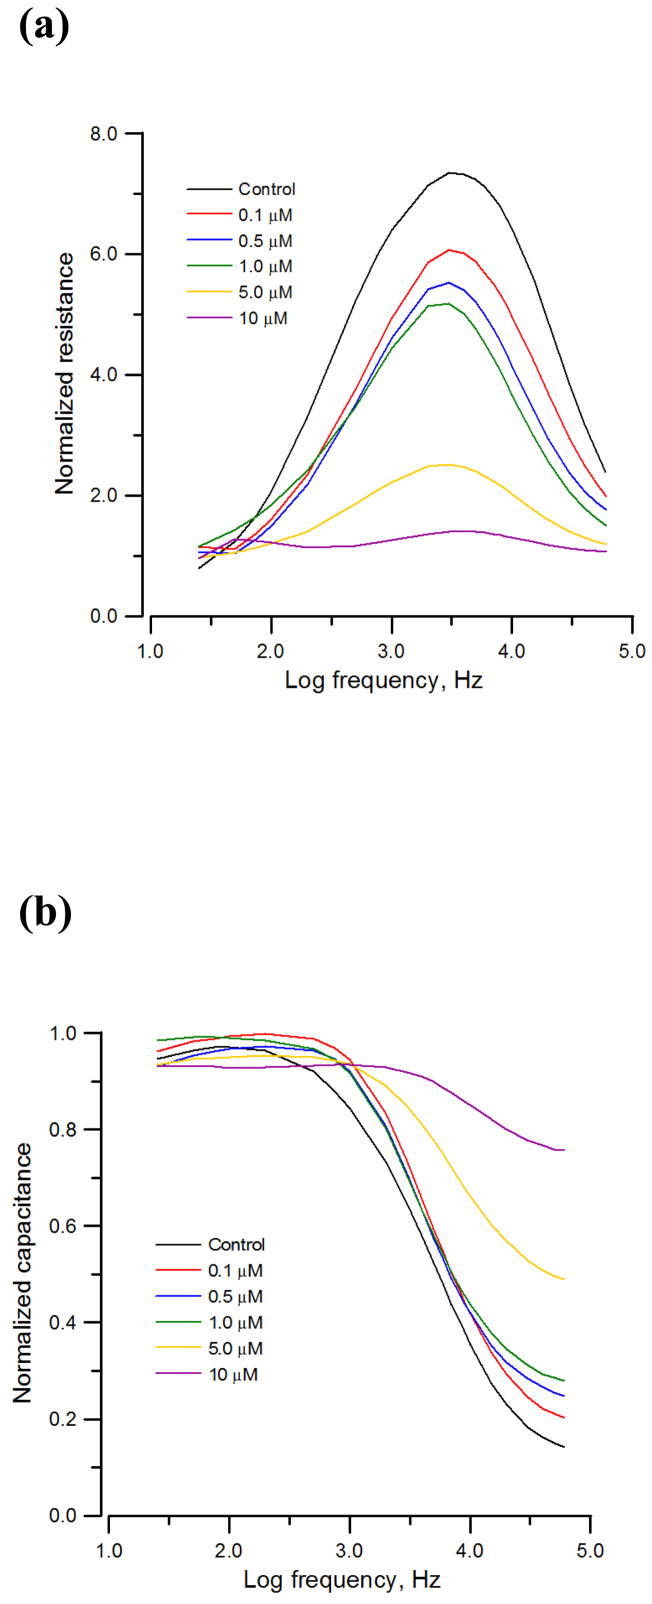
Normalized (a) resistance and (b) capacitance as a function of log10(frequency) obtained from a frequency scan measurement 20 hours after the addition of medium containing cytochalasin B or medium alone to a confluent HUVEC layer to give the final concentrations of 0.1 μM (red), 0.5μM (blue), 1.0μM (green), 5.0μM (yellow), 10μM (violet), and control (black).
Table 1.
Impedance analysis of HUVEC monolayer 20 hr after exposure to cytochalasin B
| Conc. (μM) | Rb (Ω· cm2) | % | h (nm) | % | Cm (μF/cm2) | % |
|---|---|---|---|---|---|---|
| 0 | 1.73 ± 0.15 | 100 | 78.7 ± 3.4 | 100 | 2.46 ± 0.09 | 100 |
| 0.1 | 1.39 ± 0.19 | 80 | 77.8 ± 5.1 | 99 | 3.14 ± 0.24 | 128 |
| 0.5 | 1.15 ± 0.17 | 66 | 75.4 ± 8.7 | 96 | 4.15 ± 0.47 | 169 |
| 1.0 | 0.95 ± 0.20 | 55 | 61.5 ± 3.3 | 78 | 4.33 ± 0.40 | 176 |
All values, Rb, h, and Cm, were obtained from fitting measured impedance with Eq. 1. Values shown are mean ± standard error (n = 8). Each value is also expressed as a percentage of control.
3.3. Effect of cytochalasin B on micromotion
Cytochalasin B is also known to interfere with cell motility and can substantially reduce the amplitude of the fluctuation in the measured impedance (Giaever and Keese, 1984). By looking at the variance analysis of the resistance time course shown in Fig. S1, there was an intriguing hint that noise analysis could be a better assessment of cytotoxicity if data acquisition had been faster and more sensitive. To this end micromotion measurements of HUVEC-covered electrodes were taken 20 hours after exposure to different concentrations of cytochalasin B. At this moment cultures had reached some sort of equilibrium and did not exhibit a large downward or upward trend in impedance. Due to the selection of 4 kHz AC signal for the micromotion measurement, the fluctuations in the resistance were much larger than those in the capacitive reactance. Thus, we focused on the resistance time course for data analysis. Figure 3 shows a graph of typical resistance data normalized by dividing with the average resistance for the whole period (second column in Table 2), where dose-dependently smaller fluctuations were evidently observed for cytochalasin B treated cells as compared with controls. Here only four resistance curves are shown, as the total seven data curves in a single graph would be too crowded to see their differences. Three methods of numerical analysis, fast Fourier transform (FFT), variance, and variance of the increments, were used to characterize the level of fluctuations (Lo et al., 1993). As seen in Figs. S2a, S2b, and S2c in the supplement, for all frequencies and times, there is a clear difference in the level of fluctuations obtained under the four different conditions. The scale is logarithmic; thus, the difference is significant.
Figure 3.

Normalized resistance data recorded 20 hours after the addition of medium containing cytochalasin B or medium alone to a confluent HUVEC layer to give the final concentrations of 1 μM (red), 5 μM (blue), 10 μM (green), and control (black). Each curve consists of 2048 data points taken at one-second intervals.
Table 2.
ECIS micromotion data obtained from confluent HUVEC layers 20 hours after exposure to cytochalasin B
| Conc. (μM) | Res. (kΩ) | % | Power Slope | % | Var32 (×10−6) | % | VoI32 (×10−3) | % | Hurst | % |
|---|---|---|---|---|---|---|---|---|---|---|
| 0 | 8.11 ± 0.47 | 100 | 2.90 ± 0.05 | 100 | 8.37 ± 0.90 | 100 | 7.13 ± 0.43 | 100 | 0.66 ± 0.03 | 100 |
| 0.1 | 8.43 ± 0.38 | 104 | 2.93 ± 0.03 | 101 | 5.96 ± 0.52 | 71 | 6.30 ± 0.30 | 88 | 0.74 ± 0.08 | 111 |
| 0.5 | 8.25 ± 1.09 | 102 | 2.84 ± 0.07 | 98 | 4.68 ± 0.63 | 56 | 5.55 ± 0.32 | 78 | 0.75 ± 0.03 | 114 |
| 1.0 | 6.42 ± 0.67 | 79 | 2.80 ± 0.03 | 96 | 2.86 ± 0.60 | 34 | 4.33 ± 0.49 | 61 | 0.79 ± 0.02 | 118 |
| 2.5 | 3.20 ± 0.18 | 39 | 2.42 ± 0.20 | 84 | 0.30 ± 0.07 | 4 | 1.30 ± 0.25 | 18 | 0.62 ± 0.10 | 93 |
| 5.0 | 3.19 ± 0.33 | 39 | 2.24 ± 0.06 | 77 | 0.22 ± 0.05 | 3 | 1.10 ± 0.15 | 16 | 0.60 ± 0.08 | 91 |
| 10 | 2.48 ± 0.20 | 31 | 2.01 ± 0.19 | 69 | 0.07 ± 0.01 | 1 | 0.58 ± 0.09 | 8 | 0.60 ± 0.07 | 91 |
The column labeled Res. is the average resistance value of the cell layer over a 2048-second run. The column labeled power slope is the slope of the log-log plot of power versus frequency. The column labeled Var32 is the statistical variance for the 32-point intervals of the normalized 2048-second data set. The column labeled VoI32 is the variance of the increments for the 32-point sampling intervals of the 2048-second data set. The column labeled Hurst is the Hurst exponent. Values shown are mean ± standard error (n = 10 for each concentration of cytochalasin B). Each value is also expressed as a percentage of control.
A summary of micromotion data is shown in Table 2. In order to represent the resistance fluctuations with a single number for each analysis, the table includes the average resistance value of the cell layer over a 2048-second run, the slope of the log-log plot of power spectrum (power slope), variance for the 32-point intervals and variance of the increments for the 32-point sampling intervals of the normalized 2048-second data set (Var32 and VoI32). The power slope βcharacterizing f−βnoise was estimated with least-squares straight-line fits of power at the lowest 100 frequencies (excluding the first and the last). The Var32 was obtained by calculating the statistical variance for each 32-point segment of the 2048 point data set and then taking the average of these 64 values. The VoI32 was obtained by calculating the variance of the increments between the 32-point sampling intervals. Since the original data were sampled every second for 2048 points, we treated the data as if it had been sampled every 32 seconds. We then had 64 data points and calculated the variance for the 63 increments. To easily evaluate the sensitivity of different numerical methods, analyzed value for each treatment group was also expressed as a ratio obtained by dividing its average value by that of the control group.
The first thing we notice in Table 2 is that even averaging on the order of ten independent 2048-second runs can only distinguish the concentrations as low as 1 μM (p = 0.03). This result confirms the incapacity of overall resistance measurement to distinguish the three lowest concentrations of cytochalasin B as described in Fig. 1. Similarly, the lowest concentration that the power-slope averages can significantly distinguish from the control is also 1 μM (p = 0.04). A log-log plot of power spectrum against frequency f indicates an intensity varying as f−β Brownian noise displays an f−2power law and a nonzero β shows signs of long-time (or fractal) correlations (Bassingthwaighte et al., 1994). Giaever and Keese have analyzed the resistance fluctuations obtained from both normal WI-38 and transformed WI-38 VA13 cells using a digital filtering technique (Giaever and Keese, 1986). The power spectrum for the WI-38 VA13 cells varies as f−2.6, and the WI-38 cells have a slightly smaller exponent β. The higher β (~2.9) value suggests a stronger temporal correlation in the HUVECs’ activities. Of special interest is the apparent drop of the β, from 2.8 to 2.0, as concentration increases from 1 μM to 10 μM (Fig. S2a and Table 2). It is likely that cytoskeletal structures are involved in cellular responses to cytotoxic stimulation. The initial cytotoxic event at the cell surface may cause cytoskeleton reorganization, via generating a variety of second messengers and activating diverse signal transduction pathways. As actin filaments are disrupted by addition of the cytochalasin B, cellular networks no longer act as integrated units to transduce cytotoxic stimulation into coordinated cellular responses, leading to the loss of long-time correlation in cell behavior.
Other than the average resistance and power slope analysis, variance and variance of the increments give us efficient ways of quantifying resistance fluctuations. By simply inspecting the log-log plots in Figs. S2b and S2c, it is apparent that as cytochalasin B concentration increases, calculated variance decreases for all sampling sequences and calculated variance of the increments decreases for all sampling times. Both Var32 and VoI32 values show a dose-dependent drop and are capable of detecting effects of low levels of cytochalasin B on the HUVEC monolayer (Table 2). However, the reduction of the percentage of control is less apparent for VoI32 values (88% for 0.1 μM, p = 0.06) than for Var32 values (71% for 0.1 μM, p = 0.02). The micromotion data presented in Table 2 were used to interpolate the IC50 (half-inhibition concentration) values 20 hours after exposure assuming the response versus the log of concentration is linear in the half-inhibition region. IC50 values obtained from Var32 and VoI32 data are 0.6 μM (~ 0.3 μg/ml) and 1.3 μM (~ 0.6 μg/ml) respectively. These two IC50 values of cytochalasin B are smaller than those obtained by MTT assay (~ 1.5–6.3 μg/ml), DNA synthesis measurement (~ 2.5 μg/ml), and whole cell patch clamp technique to measure the cytochalasin B-induced inhibition of hKv1.5 currents (~ 4.2 μM), indicating higher sensitivity for the ECIS micromotion measurement (Berger et al., 1997; Brownstein et al., 1975; Choi et al., 2005).
In general, the variance is similar to the power obtained from FFT, and the inverse of the number of sampling points is similar to a frequency. On the other hand, if the data is fractal, the variance of the increments may yield information about the Hurst exponent which equals to the slope of the line (Lo et al., 1993). The Hurst exponents for the HUVECs in response to different concentrations of cytochalasin B are in the range of 0.6 to 0.8, suggesting that the cells have a persistent behavior (Table 2). Though Hurst exponents are not dose-dependently different, before a decline is observed from 2.5 μM to 10 μM, there is a noticeable rise of Hurst exponent from 0.1 μM to 1.0 μM when compared with the control. One obvious result is that the three higher concentrations were easily distinguished from the four lowest. This distinction is also clearly seen from the average resistance and power slope analysis (Table 2). The reason for the increase in Hurst exponents upon exposure to cytochalasin B shown by the HUVECs is not known. In these experiments, we deal with the average activities of 20–30 cells that interact with each other and with the electrode. Cellular networks connected by both cell-cell and cell-substrate adhesion complexes may represent an effective means for communication and play a crucial role in the persistent responses to cytotoxic stimuli. We are now repeating these experiments with different cell lines cultured on electrodes with different sizes. It will be interesting to examine if the persistent behavior in response to different levels of toxins remains the same.
4. Conclusion
We have applied various ECIS assays to follow the activities of HUVECs in response to different concentrations of cytochalasin B. Frequency scan has been used to detect subtle changes in cell morphology and micromotion measurement has been used to monitor time-series impedance fluctuations. Although these two measurements provide different profiles of data, they can sensitively distinguish toxin levels as low as 0.1 μM. The calculated variance of the fluctuations may be taken as an indication of the general cell health and can be used to follow the cells in real time. The analytical methods used in this study can serve as a model approach for ECIS and other EIS biosensors to investigate various aspects of cellular responses to toxins in general.
Supplementary Material
Acknowledgments
This work was supported by National Institute of Health Grant 1R03CA123621-01A1.
Footnotes
Publisher's Disclaimer: This is a PDF file of an unedited manuscript that has been accepted for publication. As a service to our customers we are providing this early version of the manuscript. The manuscript will undergo copyediting, typesetting, and review of the resulting proof before it is published in its final citable form. Please note that during the production process errors may be discovered which could affect the content, and all legal disclaimers that apply to the journal pertain.
References
- Bassingthwaighte JB, Liebovitch LS, Weat BJ. Fractal Physiology. Oxford University Press; New York: 1994. [Google Scholar]
- Berger W, Micksche M, Elbling L. Exp Cell Res. 1997;237(2):307–317. doi: 10.1006/excr.1997.3798. [DOI] [PubMed] [Google Scholar]
- Bonder EM, Mooseker MS. J Cell Biol. 1986;102(1):282–288. doi: 10.1083/jcb.102.1.282. [DOI] [PMC free article] [PubMed] [Google Scholar]
- Brown SS, Spudich JA. J Cell Biol. 1981;88(3):487–491. doi: 10.1083/jcb.88.3.487. [DOI] [PMC free article] [PubMed] [Google Scholar]
- Brownstein BL, Rozengurt E, Jimenezdeasua L, Stoker M. J Cell Physiol. 1975;85(3):579–585. doi: 10.1002/jcp.1040850309. [DOI] [PubMed] [Google Scholar]
- Carter SB. Nature. 1967;213(5073):261. doi: 10.1038/213261a0. [DOI] [PubMed] [Google Scholar]
- Ceriotti L, Kob A, Drechsler S, Ponti J, Thedinga E, Colpo P, Ehret R, Rossi F. Anal Biochem. 2007;371(1):92–104. doi: 10.1016/j.ab.2007.07.014. [DOI] [PubMed] [Google Scholar]
- Choi BH, Park JA, Kim KR, Lee GI, Lee YT, Choe H, Ko SH, Kim MH, Seo YH, Kwak YG. Am J Physiol-Cell Ph. 2005;289(2):C425–C436. doi: 10.1152/ajpcell.00450.2004. [DOI] [PubMed] [Google Scholar]
- Ehret R, Baumann W, Brischwein M, Lehmann M, Henning T, Freund I, Drechsler S, Friedrich U, Hubert ML, Motrescu E, Kob A, Palzer H, Grothe H, Wolf B. Fresenius J Anal Chem. 2001;369(1):30–35. doi: 10.1007/s002160000628. [DOI] [PubMed] [Google Scholar]
- Giaever I, Keese CR. Proc Natl Acad Sci U S A. 1984;81(12):3761–3764. doi: 10.1073/pnas.81.12.3761. [DOI] [PMC free article] [PubMed] [Google Scholar]
- Giaever I, Keese CR. IEEE Trans Biomed Eng. 1986;33(2):242–247. doi: 10.1109/TBME.1986.325896. [DOI] [PubMed] [Google Scholar]
- Giaever I, Keese CR. Proc Natl Acad Sci U S A. 1991;88(17):7896–7900. doi: 10.1073/pnas.88.17.7896. [DOI] [PMC free article] [PubMed] [Google Scholar]
- Hirano A, Kurimura T. Exp Cell Res. 1974;89(1):111–120. doi: 10.1016/0014-4827(74)90193-1. [DOI] [PubMed] [Google Scholar]
- Keese CR, Karra N, Dillon B, Goldberg AM, Giaever I. In Vitro Mol Toxicol. 1998;11(2):183–192. [Google Scholar]
- Ko KSC, Lo CM, Ferrier J, Hannam P, Tamura M, McBride BC, Ellen RP. J Microbiol Methods. 1998;34(2):125–132. [Google Scholar]
- Lo CM, Glogauer M, Rossi M, Ferrier J. Eur Biophys J. 1998;27(1):9–17. doi: 10.1007/s002490050105. [DOI] [PubMed] [Google Scholar]
- Lo CM, Keese CR, Giaever I. Exp Cell Res. 1993;204(1):102–109. doi: 10.1006/excr.1993.1014. [DOI] [PubMed] [Google Scholar]
- Mitra P, Keese CR, Giaever I. BioTechniques. 1991;11(4):504–510. [PubMed] [Google Scholar]
- Ohmori H, Toyama S, Toyama S. J Cell Biol. 1992;116(4):933–941. doi: 10.1083/jcb.116.4.933. [DOI] [PMC free article] [PubMed] [Google Scholar]
- Slaughter GE, Bieberich E, Wnek GE, Wynne KJ, Guiseppi-Elei A. Langmuir. 2004;20(17):7189–7200. doi: 10.1021/la049192s. [DOI] [PubMed] [Google Scholar]
- Tiruppathi C, Malik AB, Del Vecchio PJ, Keese CR, Giaever I. Proc Natl Acad Sci U S A. 1992;89(17):7919–7923. doi: 10.1073/pnas.89.17.7919. [DOI] [PMC free article] [PubMed] [Google Scholar]
- Xiao CD, Lachance B, Sunahara G, Luong JHT. Anal Chem. 2002;74(22):5748–5753. doi: 10.1021/ac025848f. [DOI] [PubMed] [Google Scholar]
- Xing JZ, Zhu LJ, Jackson JA, Gabos S, Sun XJ, Wang XB, Xu X. Chem Res Toxicol. 2005;18(2):154–161. doi: 10.1021/tx049721s. [DOI] [PubMed] [Google Scholar]
- Yeon JH, Park JK. Anal Biochem. 2005;341(2):308–315. doi: 10.1016/j.ab.2005.03.047. [DOI] [PubMed] [Google Scholar]
Associated Data
This section collects any data citations, data availability statements, or supplementary materials included in this article.