

Abstract
Described is the photoluminescence (PL) of water soluble CdSe/ZnS core/shell quantum dots (QDs) as perturbed by salts of the chromium(III) complexes trans-Cr(cyclam)Cl2+ (1), trans-Cr(cyclam)(ONO)2+ (2), and trans-Cr(cyclam)(CN)2+ (3) (cyclam = 1,4,8,11-tetraazacyclo-tetradecane). The purpose is to probe the characteristics of such QDs as antennae for photosensitized release of bioactive agents (in the present case, the bioregulatory molecule NO) from transition metal centers. Addition of 1 or 2 to a QD solution results in concentration dependent quenching of the band edge emission, but 3 has a minimal effect. Added KCl strongly attenuates the quenching by 1, and this suggests that the Cr(III) cations and the QDs form electrostatic assemblies via ion pairing on the negatively charged QD surfaces. Quenching by 2, a known photochemical NO precursor, was accompanied by photosensitized NO release. All three, however, do quench the broad red emission (~650–850 nm) attributed to radiative decay of surface trapped carriers. The effect of various concentrations of 1 on time-resolved PL and absorbance were explored using ultra-fast spectroscopic methods. These observations are interpreted in terms of the Förster resonance energy transfer mechanism for quenching of the band edge PL by multiple units of 1 or 2 at the QD surface, while quenching of the low energy trap emission occurs via a charge transfer pathway.
Introduction
Nitric oxide (NO) has key regulatory roles in mammalian biology, and there is considerable interest in designing compounds for controlled delivery to physiological targets.1 In this context, our laboratory2,3 and others4 have been concerned with developing transition metal complexes for photoactivated NO delivery to specific tissues upon demand. However, the low absorptivity of many such photochemical NO precursors at the longer visible wavelengths where tissue penetration is greater5 may limit their utility. To address this problem, we have initiated studies with strongly absorbing antennae in order to increase light harvesting capability and to enhance the rate of photochemical NO release.3c
Semiconductor quantum dots (QDs) are attractive for this application due to the strong visible absorption for the exciton,6 the large two photon absorption cross-sections,7 the ease of tunability which allows optimizing energy overlap, and the simplicity of modifications to allow attachment of desired molecules at the surface of the nanocrystal, and/or to impart water solubility or biological specificity.8,9 Quantum confinement effects allow one to shift the QD optical absorbance and photoluminescence (PL) by varying the size,10 suggesting that QDs should be tunable antennae for photoreaction sensitization. Notably, QDs have proved effective for several such applications11–13 including singlet oxygen production.12 While there have been reports of nanoparticles14 as devices for thermally activated NO delivery, the use of semiconductor QDs to photosensitize NO release from stable precursors has not been addressed except in an recent communication from this laboratory.15
Here, we describe studies that probe energy transfer processes between water-soluble core/shell CdSe/ZnS quantum dots and several transition metal complexes. These studies were initiated with the goal of providing guidelines for the design of systems where QD photooptical properties facilitate the photochemical release of NO or other bioactive agent from a transition metal precursor. Aqueous solubility of the QDs was accomplished by exchanging surface capping groups with dihydrolipoic acid (which is ionized in moderately alkaline media),8 and we have probed the photoluminescence behavior of water soluble CdSe/ZnS core/shell QDs in buffer solutions as affected by the Cr(III) complexes trans-Cr(cyclam)Cl2+ (1, Cl− salt), trans-Cr(cyclam)(ONO)2+ (2, BF4− salt), or trans-Cr(cyclam)(CN)2+ (3, ClO4− salt).3 The time-resolved PL and the temporal excited state absorption behavior of the negatively charged QDs were monitored at various concentrations of added 1, 2 or 3. These studies indicate that the donor-acceptor interaction in solution is dominated by pre-association between the anionic CdSe/ZnS QDs and the cationic Cr(III) complexes prior to optical excitation. The photophysical and photochemical consequences of such interactions are described and discussed.
Experimental Section
Synthesis of water soluble CdSe/ZnS core/shell QDs
A three step procedure preparing the CdSe cores by pyrolysis of organometallic precursors, growing ZnS shells around the cores, and exchanging DHLA for the surface ligands8 was used for the synthesis of water soluble core/shell QDs.
The CdSe cores were prepared by decomposition of dimethylcadmium (Me2Cd) and trioctylphosphine selenide (TOP-Se) in a 40:20:40 (mol %) melt of hexadecylamine (HDA), trioctylphosphine (TOP) and trioctylphosphine oxide (TOPO) according to published procedures.16 After several purification steps (see Supporting Information), the QDs were dissolved in a solution of ~0.1 M HDA in hexanes, and their size and concentration were estimated by correlating the peak position and intensity of the lowest exciton transition (1S-1S3/2) with the reported QD sizing curve17 and the size dependent extinction coefficient6c of this transition. This preparation gave ~2.4 μmol of CdSe cores with a lowest excitonic transition centered at 541 nm and a narrow photoluminescence (full width at half maximum (FWHM = 29 nm) centered at 555 nm (See Supporting Information Figure S1). Based on the position of the 1S-1S3/2 absorption band, these CdSe core QDs have diameters of ~3.8 nm.17 The PL quantum yield (ΦPL) was 11%.
A zinc sulfide shell was grown on the cores using established procedures18 with quantities of the precursors (diethylzinc and hexamethyldisilathiane) necessary to give a six monolayer thick shell calculated from the core size and the bulk lattice parameters of CdSe and ZnS. The resulting core/shell QDs were stored in the dark in their growth mixture. Isolation/purification was affected by flocculation of the QDs with four volume equivalents of methanol. Following supernatant removal, the QDs were washed twice with methanol and dried under reduced pressure. These procedures gave core/shell QDs with a PL band centered at 561 nm (FWHM = 45 nm) and ΦPL of ~15%.
The HDA/TOP/TOPO surface ligands were exchanged for dihydrolipoic acid (DHLA) (freshly prepared by the reduction of lipoic acid with sodium borohydride19) according to published procedures with slight modifications (see Supporting Information).8,20 Following purification, the DHLA capped core/shell QDs had a PL maximum centered at 570 nm (FWHM = 45 nm) and a ΦPL of ~2% in 15 mM phosphate buffer solution at pH 8.2.
Synthesis of chromium(III) complexes
Trans-[Cr(cyclam)Cl2]Cl (1) was prepared according to Bakac and Espenson21 and twice recrystallized from hot aq. HCl (1 M). UV-Vis(H2O): λmax in nm (ε in M−1 cm−1): 368 (27.1), 404sh (24.3), 570 (16.9)). Trans-[Cr(cyclam)(ONO)2]BF4 (2) was prepared from 1 in 60% yield according to DeLeo et al.22 UV-Vis(H2O): 340 (246), 476 (32). Trans-[Cr(cyclam)(CN)2]ClO4 (3) was prepared from 1 according to Kane-Maguire et al.23 UV-Vis (H2O): 328 (54), 414(62).
Luminescence quantum yield and quenching experiments
All photophysical experiments with the water soluble QDs were carried out in 15 mM phosphate buffer solution at pH 8.2. Photoluminescence spectra and intensities under continuous excitation were measured in a right angle configuration on a SPEX Fluorolog–2 spectrofluorimeter. The resolution was ~4 nm unless otherwise indicated. Absorption spectra were recorded on a Shimadzu Model UV-2401 spectrophotometer.
Samples used to determine the PL quantum yield of the water soluble core/shell QDs were excited at 450 nm in a 10 mm pathlength quartz cuvette. The emission intensities were compared quantitatively to an absorbance matched solution of [Ru(bpy)3](PF6)2 (bpy =2,2′-bipyridine) in degassed acetonitrile (ΦPL = 0.062).24
Quenching experiments were carried out in pH 8.2 buffer solution. Samples of QDs or mixtures of QDs and varying concentrations of 1, 2, or 3 were entrained with Ar to remove O2. Measurements were taken in 10 mm cuvettes immediately after dilution. In mixtures with 1 or 3, samples were excited at 460 nm in a region of relatively low absorbance of the added Cr(III) salt to avoid inner-filter effects. For experiments with 2, samples were excited at 366, 460 or 546 nm, and the PL spectra were corrected for absorbance due to the chromium complex.
Luminescence lifetime measurements
These were performed in the UCSB Optical Characterization Facility using the time-correlated single-photon-counting technique (TCSPC)25. The sample was excited by 460 nm laser pulses (~120 fs, <1 nJ) produced via the second harmonic generation of the output from a Ti:sapphire laser (SpectraPhysics Tsunami). In order to avoid saturation of the chromophore, the repetition rate of the excitation pulses was reduced to 2 MHz by a custom-built acousto-optical pulse picker. The luminescence was dispersed in a monochromator (Acton Research SPC-300) and detected by a micro channel-plate photomultiplier tube (MCP PMT; Hamamatsu R3809U-51). The triggering signal for the correlator board was generated by a fast photodiode illuminated via a beam-splitter introduced into the excitation beam. The MCP PMT output and triggering signal were connected to a SPC-630 time-correlated single photon counting board (Becker & Hickl) that performed statistical analysis of the photon flux and restored the fluorescence transients. The instrument response function (IRF) width was found to be ~55 ps by measurements with suspensions of non-fluorescent scatterers and the detector set at a wavelength close to the excitation wavelength. No fluorescence or scattering signal was seen for solutions of the QDs when the detector monochromator was set at a wavelength outside the PL band and more than 5 nm from the excitation wavelength. The TCSPC data were not deconvoluted with IRF.
Transient absorbance (TA) experiments
Femtosecond TA experiments were performed in the UCSB Optical Characterization Facility with a transient absorption spectrometer similar to that described by Klimov and McBranch.26 The system utilizes a Ti:Sapphire regenerative amplifier (SpectraPhysics Spitfire) producing 100 fs optical pulses (1 kHz repetition rate, 800 nm central wavelength pulse energy < 1 mJ) from which 400 nm pulses were prepared by second harmonic generation in a 1 mm thick β-BBO crystal for excitation of the sample. The pulse energy was adjusted by a calibrated neutral density filter wheel to ensure a QD excitation level < 1 exciton per nanoparticle on average. Photoinduced absorption changes were monitored by fs continuum pulses generated by focusing low energy (< 2 μJ) 800 nm pulses onto a 2 mm thick crystalline sapphire plate. The delay between pump and probe pulses was varied by a translation stage with a corner cube reflector inserted into the pump beam. An optical chopper synchronized with the laser repetition frequency was employed to modulate the excitation beam and provided a synchronization signal for the lock-in amplifier (SRS SR830). Solutions of QDs or mixtures of QDs with varied concentrations of 1 were placed in 1 mm pathlength quartz cuvettes and entrained with Ar to remove O2. The pump and probe beams were focused on the sample in a near-collinear geometry using a lens and a parabolic mirror, respectively. The probe light was dispersed by a monochromator (Acton SpectraPro 300) and detected by a silicon photodiode connected to a lock-in amplifier via a transimpedance amplifier. The operation of the setup was controlled by a Lab View program running on a PC.
Continuous photolysis and nitric oxide detection
A NO sensitive electrode (amiNo–700, Innovative Instruments, Inc.) was used for real time detection of NO produced by photochemical decomposition of 2. All experiments were done under aerated conditions in pH 8.2 buffer solution. The electrode was polarized overnight in deionized H2O prior to use and then was allowed to equilibrate in the stirred buffer solution for ~10 min in the dark. The light (output of a high pressure Hg arc lamp spectrally selected by band pass filter) was turned on taking care to ensure the electrode was not directly illuminated. Once the background signal was stable, an aliquot of 2 was added and the electrode response monitored to determine NO release from 2 alone. Alternatively, an aliquot of QDs was introduced and allowed to mix for ~100–200 s followed by an aliquot of 2 and the electrode response monitored to determine NO release from the mixture.
Cyclic Voltammetry
Cyclic voltammograms were collected using a Bioanalytical Systems Electrochemical Analyzer (Model 100A) with a glassy carbon working electrode (BAS), platinum wire counter electrode, and Ag/AgCl reference electrode (BAS) in solutions of degassed acetonitrile with 0.5 M [NBu4]PF6 for the supporting electrolyte.
Results and Discussion
This report is concerned with analyzing the effects of the Cr(III) cations trans-Cr(cyclam)X2+ on the photophysical behavior of water-soluble CdSe/ZnS core/shell QDs. The goal is to evaluate the nature of energy transfer processes that might be utilized to sensitize the photochemical release of NO (or other bioactive agents) from appropriate precursors. Neither the dichloro complex 1 (X− = Cl−)27 nor its dicyano analog 3 show significant photoreactivity when directly excited in solution, in contrast to the dinitrito complex 2 (X− = ONO−), which releases NO with high quantum yields under similar conditions.3a,b Although 2 is photoactive, the Laporte forbidden, visible range, absorption bands are quite weak, so one goal of the present study is examine the use of QDs as strongly absorbing antennae.
Figure 1 displays the absorption behavior of these three Cr(III) complexes in aqueous solution and the PL spectrum of the water soluble QDs under analogous conditions. For 1 there is excellent overlap of the lowest energy quartet ligand field absorption band (Q1) with the band edge PL of the QDs. This feature suggests that QD → 1 energy transfer via the Förster mechanism would be favorable.28 In the same context, 2 shows moderate overlap, but 3 shows very little. Static and time resolved PL studies, as well as fs flash photolysis experiments with time-resolved transient absorbance detection, were all carried out in buffer solution.
Figure 1.

Comparison of the spectral overlap between the QD PL and the absorption spectra of trans-Cr(cyclam)Cl2+ (1, Cl− salt), trans-Cr(cyclam)(ONO)2+ (2, BF4− salt), and trans-Cr(cyclam)(CN)2+ (3, ClO4− salt). The spectra were recorded in pH 8.2 phosphate buffered (15 mM) solution.
QD PL quenching by trans-Cr(cyclam)Cl2+
Figure 2A shows the PL behavior of solutions containing a fixed concentration (~190 nM) of QDs and varied concentrations of 1 (0 to 1000 μM). The PL intensity of the QD decreases with increasing [1]. A Stern-Volmer analysis (Figure 2B; I being the intensity at the λmax) exhibits nonlinear behavior with the quenching effect leveling off for [1] greater than 500 μM. This behavior is inconsistent with simple diffusional quenching of the optically excited QDs, and is indicative of a different type of photophysical interaction between the QD and cyclam complex(es). Pure diffusional quenching should exhibit a linear plot throughout the concentration range according to the Stern-Volmer treatment (I0/I = 1 + KSV[Q], where KSV = kqτ0).28b Instead, the plots are nonlinear. Furthermore, if one takes the initial slope of this plot at low [1] as KSV and calculate a kq value by using the lifetime data (see treatment below), the value would be greater than the limiting second order rate constant for diffusion in aqueous solutions. Thus, instead of invoking a diffusional mechanism for quenching, which, if operational, would be a minor contributor, the discussion below will lead to a model where a nondiffusional process, involving ion pairing between the anionic QD surface and multiple trans-Cr(cyclam)Cl2+ cations, appears more likely.
Figure 2.

A) Top: Photoluminescence spectra of the QDs showing changes due to increasing concentration of 1 in pH 8.2 phosphate buffer solution (15 mM). Each trace represents an independently prepared sample having a constant QD concentration (190 nM) and different concentrations of 1 (0–1000 μM). The samples were excited at 460 nm where the absorbance of 1 is negligible at the concentrations used here. The inset shows the UV-vis absorbance of each sample. Arrow indicates increasing [1]. B) Bottom: Stern-Volmer type plot where I is the PL intensity of the QDs at the λmax for various solutions with different concentrations of 1 and I0 is the PL intensity of the QDs in the absence of 1. The upper set of points (dots) indicate data acquired in 15 mM phosphate buffer solution at pH 8.2, while the lower set (squares) were acquired under otherwise identical solutions with 250 mM added KCl.
If such electrostatic assembly of Cr(III) cations on the QD surfaces is indeed responsible for the quenching, this effect should be attenuated by adding another electrolyte, Figure 2B shows that added KCl (250 mM) strongly reduces the impact of added 1 on the QD PL, presumably by screening the electrostatic interaction between the negatively charged QDs and the cationic Cr(III) complex. As a control, it should be noted that, under otherwise analogous conditions, there was little effect of added KCl (up to 1 M) on QD PL intensities in the absence of added 1 (Supporting Information Figure S2).
The complicated time-resolved PL behavior of the QD solutions without added 1 is shown in Figure 3. The PL decay is multi-exponential, as is common for such QD systems.29 An acceptable fit to these data (Figure 3, random noise in the residuals) was obtained using the relationship described in Eq. 1 with n = 4. The multi-exponential luminescence decay kinetics indicate the heterogeneous excited state behavior of QDs in an ensemble measurement.30 Although one possibility is that the QDs represent a distribution of sizes, the relatively narrow band shapes of the absorption and emission bands belie this.
Figure 3.

Time-resolved photoluminescence of the water soluble QDs (190 nM) in aqueous pH 8.2 phosphate buffer solution. QDs were excited with ~120 fs pulses tuned to 460 nm, and the PL was monitored at λmax = 570 nm. The trace through the data represents a fit according to Eq. 1 with n = 4 (see text). The residual plot above the data demonstrates the “goodness of fit”.
| (1) |
Figure 4 shows the effect of added 1 on the temporal PL behavior. Qualitatively, it is seen that the decay is accelerated. Again, these data can be fit to Eq. 1, and the lifetimes and amplitude so generated are listed in Table 1. In this analysis, the lifetime (τ1) of the shortest component was limited by the instrument response function (~55 ps) and the amplitude α1, calculated to be 0.39 in the absence of quencher, was assumed to be invarient. The remaining resolvable components show shorter lifetimes with increasing concentration of 1, while the amplitude of the second component, α2, increases at the expense of the longest lived component α4. Notably, quenching of the τ4 component accounts for over 75% of the total loss in the integrated PL intensity, so any error induced by assuming a constant value of α1τ1 would be minor.
Figure 4.

Comparison of time-resolved QD PL as a function of increasing [1]. These temporal measurements were made with the samples used to generate the steady state emission spectra shown in Figure 2.
Table 1.
Computed lifetimes (τ in ns) and amplitudes (Σαi = 1.00) (using Eq. 1) for the QD emission data with various concentrations of trans-[Cr(cyclam)Cl2]Cl salt. Measurement of the fastest detected decay process is limited by the instrument response function (IRF ~55 ps) and the value α1τ1 is assumed to be constant.
| [1] (in μM) | α1 | τ1 | α2 | τ2 | α3 | τ3 | α4 | τ4 | Σ αxτx | Σ0/Σa |
|---|---|---|---|---|---|---|---|---|---|---|
| 0 | 0.39 | 0.055 | 0.31 | 0.500 | 0.21 | 3.54 | 0.12 | 15.4 | 2.8 | 1.00 |
| 100 | IRF | 0.33 | 0.499 | 0.20 | 3.17 | 0.10 | 14.1 | 2.2 | 1.27 | |
| 200 | IRF | 0.35 | 0.466 | 0.21 | 2.85 | 0.10 | 13.0 | 2.1 | 1.33 | |
| 300 | IRF | 0.36 | 0.454 | 0.20 | 2.67 | 0.09 | 12.1 | 1.8 | 1.56 | |
| 500 | IRF | 0.37 | 0.476 | 0.20 | 2.72 | 0.09 | 11.4 | 1.8 | 1.56 | |
| 800 | IRF | 0.36 | 0.467 | 0.20 | 2.38 | 0.09 | 9.9 | 1.6 | 1.75 | |
| 1000 | IRF | 0.36 | 0.469 | 0.20 | 2.30 | 0.09 | 9.4 | 1.5 | 1.87 | |
Σ0 = Σαxτx in the absence of 1. Σ = Σαxτx for various [1].
The steady state and time-resolved PL data demonstrate that added 1 quenches the photoluminescence of the water-soluble CdSe/ZnS core/shell quantum dots in a concentration dependent manner. As noted above, the initial slope of the plot shown in Figure 2B gives an estimated Ksv value of 1950 M−1. If this were assumed to be due to dynamic quenching of the longest lived component of the QD PL, (τO = τ4= 15.4 ns), the estimated kq (Ksv/τ) would be ~1.3 × 10¹¹ M−1 s−1, an order of magnitude faster than diffusion limits in this medium. Such a high apparent kq suggests ground-state complex formation between donor and acceptor prior to photo-excitation, that is, a static quenching mechanism rather than dynamic quenching.31
One can attribute the quenching to electrostatic assemblies between the anionic QDs and the cationic complexes 1. Water solubility of the core/shell CdSe/ZnS QDs was accomplished by deprotonation of the dithiol dihydrolipoic acid ligands in the mildly basic medium. From the estimated number of Zn2+ centers on the surface,32 the QDs would accommodate up to 600 DHLA ligands,33 assuming a ratio of one DHLA per two zinc surface ions. Earlier studies have reported that >85% of surface ligand sites are exchanged during a typical recapping procedure.33a While one might not expect complete ionization of these surface DHLA ligands even at pH 8.2, there is little doubt that the QD surfaces have multiple negative charges and should form electrostatic ion-pairing interactions with a number of the trans-Cr(cyclam)Cl2+ cations. Accumulation of multiple acceptors at the QD surface provides multiple channels for nonradiative excited state decay following optical excitation.
PL quenching by trans-Cr(cyclam)(ONO)2+
The band edge PL of the QDs in buffered solutions was also quenched when progressively higher concentrations of 2 (0–1000 μM) were added (Figure S3, Supporting Information), and a small red shift of the emission maximum (~3 nm) was observed (Figure S4). This quenching occurs irrespective of the excitation wavelength (366 nm or 546 nm), although the relative effect appears somewhat stronger for the shorter wavelength.34 Again we attribute the quenching by 2 to the formation of an electrostatic assembly between multiple units of 2 and the anionic QD surface. The Stern-Volmer type plot of I0/I vs. [2] (Supporting Information, Figure S5) is similar to Figure 2B, although there are some quantitative differences, most significantly the quenching being ~20% larger for 2 than for equivalent concentrations of 1. The effect again levels off at ~500 μM, perhaps due to saturation of the QD hydration sphere with the cationic metal complexes.
Effect of added trans-[Cr(cyclam)(CN)2]ClO4
For 3, the quartet ligand field absorption bands are shifted strongly to the blue with respect to those of 1 and 2 owing to the much greater ligand field strength of the axial cyano groups (Figure 1). As a consequence there is virtually no spectral overlap between the Q1 absorption band of 3 and the QD PL band centered at 570 nm. Thus, it is significant that added 3, unlike 1 and 2, does not quench the band-edge PL (Figure S6). For example, solutions containing ~210 nM QDs and up to 500 μM 3, show only slight variations in the band edge PL (< 10%) from solutions with no quencher present.
In addition to the very prominent band edge emission, the PL spectrum of the water soluble QDs also shows a weak broad band centered at ~750 nm of the type that has been attributed35 to emission from a surface ″trap″ state. It is notable that this trap emission is largely depleted by even the lowest concentration (100 μM) of 1 utilized in the steady state quenching experiments (Figure 2). Similar depletion of this feature was also seen (Figure S6) for the lower concentrations of 2 and 3 used to study the effects of the various Cr(III) complexes on the QD PL.
FRET Mechanism for PL quenching?
Given the spectral overlap between the QD PL and the Q1 absorbance bands of 1 and 2 and the absence of such overlap with 3 (Figure 1), quenching by the first two but not the third suggests the operation of Förster resonance energy transfer (FRET) as the likely quenching mechanism. The FRET formalism has been used to describe the non-radiative energy transfer from QDs to various acceptors, including other QDs, quantum wires, dye molecules, and metalloproteins.36–38 In this framework, the predicted rate constant for energy transfer (kEN) from the donor chromophore (D) to a single acceptor chromophore (A) is given by28
| (2) |
where ΦPL is the PL donor quantum yield in the absence of acceptor, τD(o) is the donor lifetime in the absence of acceptor, κ is the dipole-dipole orientation factor (κ2 = 2/3; for randomly oriented dipoles), N is Avogadro’s number and n is the refractive index of the medium. J(λ) takes into account the spectral overlap between the donor PL and the acceptor absorption spectra as a function of the wavelength λ. The Förster radius R0 represents the D-A separation distance where the rate of energy transfer, kEN, and the rate of excited state deactivation of D (1/τD(0)) are equal. By using the spectral data of Figure 1 to calculate J(λ), one obtains a value for R0 = 2.8 nm for the quenching of QDs by the Cr cyclam complex, if we assume a ΦPL = 0.02 and τD(o) = 15.4 ns (i.e., τ4) by 1. (Details of this calculation are described in the Supporting Information).
In order to apply the FRET formalism in the current study, the D-A distance r needs to be estimated. The QD core radius Rcore would be 1.9 nm (spherical shape assumed). To this is added the thickness of the ZnS shell (~6 × 0.31 nm/ZnS monolayer =1.9 nm)18 and of the DHLA surface layer (~1 nm) to give an overall radius Rc+S+L of 4.8 nm (Figure 5). This can be compared to the reported hydrodynamic radii of 6–7 nm for similar water soluble core/shell/ligand CdSe/ZnS/DHLA QDs (λem = 570 nm) as determined by dynamic light scattering measurements.39 One may assume that the electrostatic assembly process draws the Cr(cyclam)Cl2+ cations into the hydration sphere as conceptualized by Figure 5, so a distance of ~5 nm from the center of the core or of ~3 nm from the core surface would be a reasonable estimate.
Figure 5.
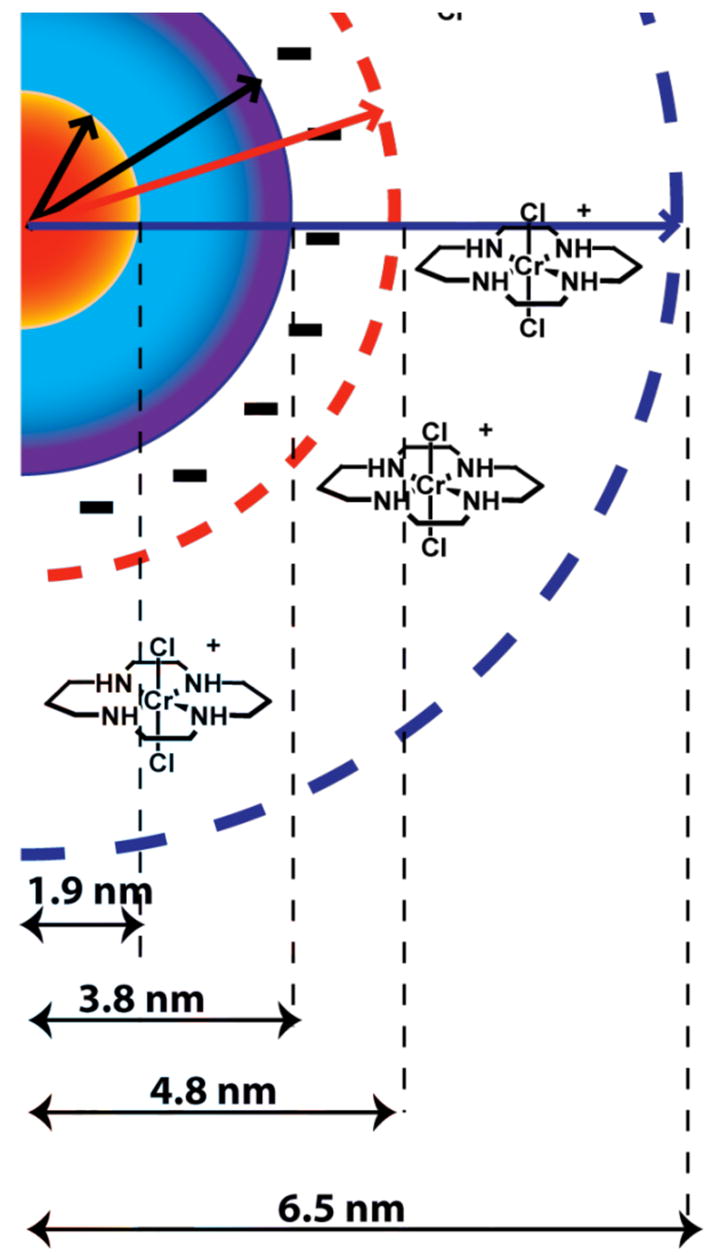
Idealized drawing of trans-Cr(cyclam)Cl2+ cations electrostatically assembled in the hydration sphere of DHLA coated CdSe/ZnS core/shell QD. The radius was estimated from measurements of similar systems.39
Both the center37 and the surface40 have been used by others to estimate distances for FRET in QD systems. If one uses the former, Eq. 2 would give a calculated kEN in the range (0.42 to 2.6) × 106 s−1 for a single Cr(cyclam)Cl2+ cation lying within the hydration sphere (~6.5 >r > 4.8 nm). (The longest lifetime τ4 was used for this estimate, since changes in this PL decay component account for 75% of the emission yield decrease upon addition of 1.) On the other hand, if the distance from the core surface were used (~4.6> r> 2.9 nm), the estimated kEN values would be higher, (0.34 to 5.4) × 107 s−1. Even these latter values would be too small to account for the quenching effect on the longest PL lifetimes by a single Cr(cyclam)Cl2+ cation. However, it is important to reemphasize that the large QD surface area can accommodate numerous acceptors. Thus, even an r value based on the core center might be reasonable if there is linear enhancement of the quenching kinetics due to the multiple acceptors.37 This model is represented by eq. 3, where τis the measured lifetime in the presence of the quencher and the term Nq accounts for the number of acceptors intimately associated with the QD.
| (3) |
The decrease in τ4 seen for the highest [1] (Table 1) would require N = ~18 for the kEN calculated for r = 4.8 nm and N = ~110 for that calculated for r = 6.5 nm. The latter number is close to the capacity for Cr(cyclam)Cl2+ cations in the QD hydration sphere.41
It is unclear why 2 is at least as effective a quencher as 1 given the former’s lower spectral overlap of its Ql band with the CdSe/ZnS PL (Figure 1). One possible explanation lies in the strong distance dependence of the rate of FRET (kEN ∝ 1/r6), and thus its overall efficiency, predicted by eq. 2. Even small differences in the average donor/acceptor distance for assemblies of QDs with 1 versus 2 may have large effects on the observed PL quenching efficiency. Notably, we also observed quenching of the QD PL lifetime with added 2 in analogy to that seen for mixtures with 1; i.e. shortening of the longer decay components with a modest enhancement in the contribution of τ2 (Table S1, Supporting Information). This observation suggests that the non-zero spectral overlap of QD PL with the ligand field absorption band of 2 facilitates quenching by a similar pathway, namely via energy transfer.
Transient absorbance experiments
Figure 6 displays the TA behavior initiated by fs flash photolysis of QD solutions (1.9 μM) in the presence of different concentrations of 1 (0, 5 mM, 10 mM). Prompt transient bleaching of the IS band edge transition was observed and the decay of this bleach displayed several components. A fast process with a time constant of ~20–30 ps accounts for roughly 15% of the total signal for [1] = 0. The remaining decay observable within the instrumentation limits demonstrated a time constant of ~l–2 ns. (The dynamics of the substantial residual bleach at the end of the latter time frame were not accessed by this experiment). Introduction of 1 diminished the longer component of the decay, which was manifested in an increase of the relative amplitude of the fast process to 35% at the highest quencher/QD ratio (Table S2, see Supporting Information). These data suggest that 1 introduces a new, very fast, excited decay pathway in the QDs. The residual bleach was also significantly decreased by added 1, and this observation is consistent with the quenching of the longer lived PL components noted in Table 1.
Figure 6.

TA dynamics of the QDs measured at 530 nm for 1.9 μM solutions of QDs with varied concentrations of 1. The data sets are 0 mM (filled circles), 5 mM (filled squares), and 10 mM (filled triangles) 1. The lines represent double exponential fits to the data. Inset shows the spectral data for the recovery of the bleach of the QD 1S transition (without 1 added) at various delay times after the pump pulse.
QD preparations are known to include “bright” and “dark” species;42 the former display the band-edge PL while the latter do not owing to efficient charge carrier trapping. The ultrafast TA experiment probes a time-scale not accessible in the time-resolved PL data and samples the entire ensemble, while PL only samples QDs that decay with a measurable luminescence. Decay of the 1S bleach on the sub-nanosecond timescale has been associated with surface trapping of charge carriers for a portion of the QDs,30 and in the present case it appears that 1 introduces a new component, or enhances an existing one, associated with this process. Although the increased contribution to the very short-lived TA decay appears to be outside the expectation of a FRET mechanism, a recent study has demonstrated bleach dynamics effects on a similar time scale (~30–50 ps) for the interaction of pthalocyanines (Pcs) with CdSe QDs.40,43
One might postulate that the effects seen in the short time regime of the TA experiment is associated with the surface trapped carriers that give rise to the weak broad luminescence band at ~750 nm, which is quenched by low concentrations (100 μM) of 1. Similar effects are seen for added 2 and 3, despite failure by the latter to quench the band edge emission band. Charge transfer between the trapped carrier(s) and complex at or near the QD surface would be consistent both with quenching of the deep trap luminescence and with acceleration of the 1S bleach dynamics observed in the TA experiment. In this context we propose that while energy transfer is the dominant mechanism for the band edge PL quenching by 1 or 2, another process is active whereby the deep trap luminescence is quenched, perhaps due to ultra-fast charge transfer between the QD and surface associated complex cations.
The latter conclusion is further supported by comparison of the reduction potentials of the Cr complexes and the QDs. As shown in Figure 7, the CrIV/III redox couple of each complex lies above the valence band potential of the QDs but below that of the conduction band. This characteristic would make hole injection from optically excited QD (from a shallow trap state) to the surface associated Cr(III) complex energetically feasible. Such hole transfer would quench the low energy emission from such states.
Figure 7.
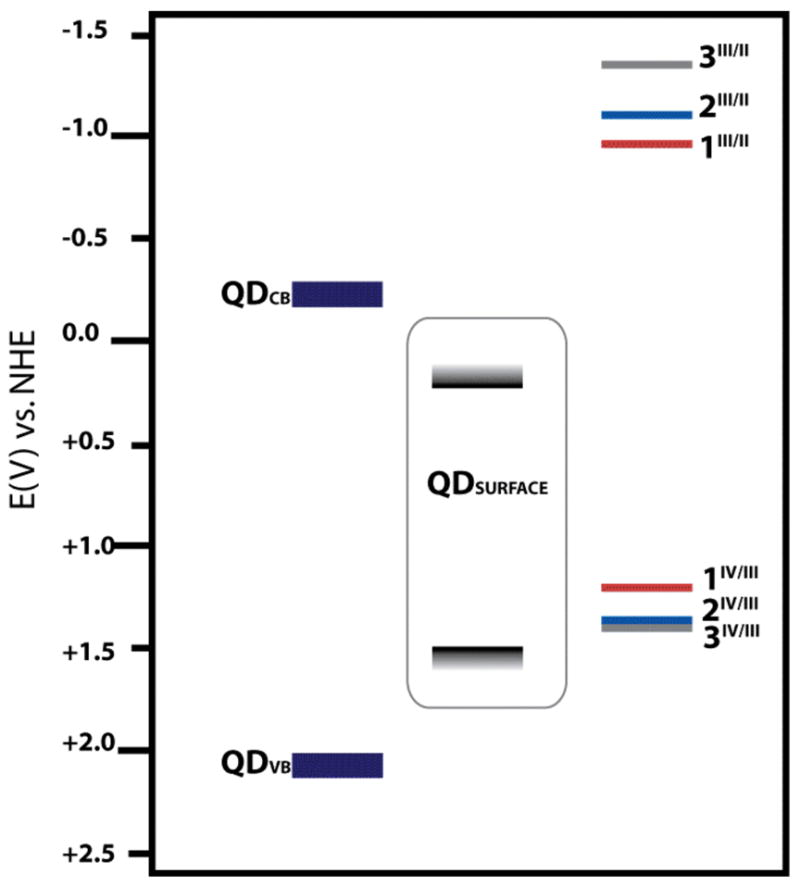
Energy level diagram showing relative positions of the QD valence and conduction bands (see ref. 45) and the reduction potentials from CrIII to CrII and CrIV to CrIII for the ground state chromium complexes as measured by cyclic voltammetry.
Photosensitized NO release from trans-Cr(cyclam)(ONO)2+
The quenching of QD PL by 2 was also accompanied by sensitization of the photoreaction illustrated by Scheme 1, as described in an earlier communication from this laboratory.15 The release of NO from 2 can be initiated by direct photolysis of its weakly absorbing, visible range LF bands as illustrated in Figure 8 for 200 μM solutions of 2 in pH 8.2 buffer. However, when the water-soluble CdSe/ZnS core/shell QDs (200 nM) were added, NO generation was dramatically enhanced (Figure 8). This can be attributed to energy transfer from the excited QDs to trans-Cr(cyclam)(ONO)2+ cations electrostatically bound to the surface.
Scheme 1.

Figure 8.

Comparison of the NO detected (normalized signal) after irradiation of solutions containing 2 (200 μM in phosphate buffer pH 8.2) without (white) and with (grey) QDs (200 nM).
The marked enhancement of the photochemical activity of 2 induced by adding QDs to the solution is similar regardless of whether the excitation with the mercury arc lamp used a filter that cut off wavelengths <350 nm or one that cut off wavelengths <460 nm. In both cases ~15-fold enhancement in NO release is seen from the assemblies of QDs and 2 (the smaller absolute production of NO in the latter case is due to the lower intensity of light absorbed). This marked increase indicates that the quantum dots are acting as antennae, increasing the amount of light absorbed by 2 and thus the NO released, much the same as pendant chromophores have been used to stimulate photochemical NO release from analogs of 2.3c,d Based on these results, quantum dot constructs offer an interesting new approach for the design of photochemical drugs for the release of NO, as well as other bioactive agents, from an appropriate precursor.
Summary
The PL quenching behavior of the water soluble QDs in response to added 1 or 2 is consistent with an energy transfer mechanism involving electrostatic assemblies of these Cr(III) cations on the anionic quantum dot surfaces. The quenching of the emissive QDs was analyzed in terms of a FRET mechanism, and could be attributed to the presence of a number of Cr(III) cations within the QD hydration sphere. The FRET analysis is consistent with the leveling of the PL quenching effect owing to saturation of the QD surfaces with 1 or 2, as estimated by independent calculations based on steric effects.
This system confirms that QDs can function as effective sensitizers to photochemical reactions of transition metal complexes, notably NO release from 2, and clearly exemplifies the enhanced energy transfer efficiency when there are multiple acceptors associated with the donor. Due the strong absorbance of the QDs, photoinduced release of NO from the assemblies containing 2 is strongly enhanced at visible wavelengths. We are currently in the process of quantifying QD sensitized release of NO from 2 and from other photochemical NO precursors after single or two photon excitation. Meanwhile, studies are ongoing to develop more sophisticated QD/NO donor platforms in which derivatives of 2 or other NO donor compounds are strongly associated with the QD sensitizers via covalent surface attachment. We envision that such systems will present a new class of photochemical prodrugs for delivery of NO on demand.
Supplementary Material
Figures S-l through S-6 display the optical properties of the QDs under various conditions discussed in the text. More detailed discussions of the methods used to prepare QDs and to determine the Förster radius, the energy transfer rate, and the number of chromium complexes that can associate around a single QD are also presented. This material is available free of charge via the Internet at http://pubs.acs.org.
Acknowledgments
These studies were supported by a grant to PCF from the National Science Foundation (CHE-0352650), to GFS from National Institute of Health (NBIB 7 R01 EB000832), and by a UC-CARE grant from Los Alamos National Laboratory to PCF and GFS. We thank Prof. Steve Buratto for helpful discussions.
References
- 1.(a) Saavedra JE, Hoffman A, Bove AA, Isaac L, Hrabie JA, Keefer LK. J Medicinal Chem. 1991;34:3242–3247. doi: 10.1021/jm00115a013. [DOI] [PubMed] [Google Scholar]; (b) Wang PG, Xian M, Tang X, Wu X, Wen Z, Cai T, Janczuk AJ. Chem Rev. 2002;102:1091–1134. doi: 10.1021/cr000040l. [DOI] [PubMed] [Google Scholar]; (c) King SB. Cur Topics Med Chem. 2005;5:665–673. doi: 10.2174/1568026054679362. [DOI] [PubMed] [Google Scholar]; (d) Wheatley P, Butler AR, Crane M, Fox S, Xiao B, Rossi A, Megson IL, Morris RE. J Am Chem Soc. 2006;128:502–509. doi: 10.1021/ja0503579. [DOI] [PubMed] [Google Scholar]
- 2.(a) Bourassa J, DeGraff W, Kudo S, Wink DA, Mitchell JB, Ford PC. J Am Chem Soc. 1997;119:2853–2860. [Google Scholar]; (b) Ford PC, Bourassa J, Miranda KM, Lee B, Lorkovic I, Boggs S, Kudo S, Laverman L. Coord Chem Rev. 1998;171:185–202. [Google Scholar]; (c) Works CF, Ford PC. J Am Chem Soc. 2000;122:7592–7593. [Google Scholar]; (d) Wecksler S, Mikhailovsky A, Ford PC. J Am Chem Soc. 2004;126:13566–13567. doi: 10.1021/ja045710+. [DOI] [PubMed] [Google Scholar]; (e) Wecksler SR, Mikhailovsky A, Korystov D, Ford PC. J Amer Chem Soc. 2006;128:3831–3837. doi: 10.1021/ja057977u. [DOI] [PubMed] [Google Scholar]
- 3.(a) DeLeo MA, Ford PC. J Am Chem Soc. 1999;121:1980–1981. [Google Scholar]; (b) DeLeo MA, Ford PC. Coord Chem Rev. 2000;208:47–59. [Google Scholar]; (c) DeRosa F, Bu X, Ford PC. Inorg Chem. 2005;44:4157–4165. doi: 10.1021/ic048311o. [DOI] [PubMed] [Google Scholar]; (d) Ford PC. Accts Chem Res. in press. [Google Scholar]
- 4.(a) Tfouni E, Krieger M, McGarvey BR, Franco DW. Coord Chem Rev. 2003;236:57–69. [Google Scholar]; (b) Pavlos CM, Xu H, Toscano JP. Cur Topics Med Chem. 2005;5:635–645. doi: 10.2174/1568026054679326. [DOI] [PubMed] [Google Scholar]; (c) Eroy-Reveles AA, Leung Y, Mascharak PK. J Am Chem Soc. 2006;128:7166–7167. doi: 10.1021/ja061852n. [DOI] [PubMed] [Google Scholar]
- 5.(a) Dougherty TJ, Marcus SL. Eur J Cancer. 1992;28A:1734–42. doi: 10.1016/0959-8049(92)90080-l. [DOI] [PubMed] [Google Scholar]; (b) Konig K. J Microscopy. 2000;200:83–104. doi: 10.1046/j.1365-2818.2000.00738.x. [DOI] [PubMed] [Google Scholar]
- 6.(a) Leatherdale CA, Woo WK, Mikulec FV, Bawendi MG. J Phys Chem B. 2002;106:7619–7622. [Google Scholar]; (b) Schmelz O, Mews A, Basché T, Herrmann A, Müllen K. Langmuir. 2001;17:2861–2865. [Google Scholar]; (c) Yu WW, Qu L, Guo W, Peng X. Chem Mater. 2003;15:2854–2860. [Google Scholar]
- 7.Larson Daniel R, Zipfel WR, Williams RM, Clark SW, Bruchez MP, Wise FW, Webb WW. Science. 2003;300:1434–1436. doi: 10.1126/science.1083780. [DOI] [PubMed] [Google Scholar]
- 8.Mattoussi H, Mauro JM, Goldman ER, Anderson GP, Sundar VC, Mikulec FV, Bawendi MG. J Am Chem Soc. 2000;122:12142–12150. [Google Scholar]
- 9.(a) Pinaud F, Michalet X, Bentolila LA, Tsay JM, Doose S, Li JJ, Iyer G, Weiss S. Biomater. 2006;27:1679–1687. doi: 10.1016/j.biomaterials.2005.11.018. [DOI] [PMC free article] [PubMed] [Google Scholar]; (b) Alivisatos AP, Gu W, Larabell C. Annu Rev Biomed Eng. 2005;7:55–76. doi: 10.1146/annurev.bioeng.7.060804.100432. [DOI] [PubMed] [Google Scholar]; (c) Gao X, Yang L, Petros JA, Marshall FF, Simons JW, Nie S. Curr Opin Biotech. 2005;16:63–72. doi: 10.1016/j.copbio.2004.11.003. [DOI] [PubMed] [Google Scholar]; (d) Medintz IL, Tetsuo Uyeda H, Goldman ER, Mattoussi H. Nat Mater. 2005;4:435–446. doi: 10.1038/nmat1390. [DOI] [PubMed] [Google Scholar]
- 10.Alivisatos AP. J Phys Chem. 1996;100:13226–13239. [Google Scholar]
- 11.(a) Wijtmans M, Rosenthal SJ, Zwanenburg B, Porter NA. J Am Chem Soc. 2006;128:11720–11726. doi: 10.1021/ja063562c. [DOI] [PubMed] [Google Scholar]; (b) Warrier M, Lo MKF, Monbouquette H, Garcia-Garibay M. A Photochem Photobio Sci. 2004;3:859–863. doi: 10.1039/b404268a. [DOI] [PubMed] [Google Scholar]
- 12.(a) Samia ACS, Chen X, Burda C. J Am Chem Soc. 2003;125:15736–15737. doi: 10.1021/ja0386905. [DOI] [PubMed] [Google Scholar]; (b) Shi L, Hernandez B, Selke M. J Am Chem Soc. 2006;128:6278–6279. doi: 10.1021/ja057959c. [DOI] [PMC free article] [PubMed] [Google Scholar]; (c) Clarke S, Hollmann CA, Zhang Z, Suffern D, Bradforth SE, Dimitrijevic NM, Minarik WG, Nadeau JL. Nat Mater. 2006;5:409–417. doi: 10.1038/nmat1631. [DOI] [PubMed] [Google Scholar]; (d) Bakalova R, Ohba H, Zhelev Z, Nagase T, Jose R, Ishikawa M, Baba Y. Nano Lett. 2004;4:1567–1573. [Google Scholar]; (e) Dayal S, Krolicki R, Burda C. Proc SPIE. 2005;5705:247–254. [Google Scholar]; (f) Shi L, Hernandex B, Selke M. J Am Chem Soc. 2006;128:6278–6279. doi: 10.1021/ja057959c. [DOI] [PMC free article] [PubMed] [Google Scholar]
- 13.(a) Sykora M, Petruska MA, Alstrum-Acevedo J, Bezel I, Meyer TJ, Klimov VI. J Am Chem Soc. 2006;128:9984–9985. doi: 10.1021/ja061556a. [DOI] [PubMed] [Google Scholar]; (b) Sharma SN, Pillai Z, Kamat PV. J Phys Chem B. 2003;107:10088–10093. [Google Scholar]; (c) Landes C, Burda C, Braun M, El-Sayed MA. J Phys Chem B. 2001;105:2981–2986. [Google Scholar]
- 14.(a) Rothrock AR, Donkers RL, Schoenfisch MH. J Am Chem Soc. 2005;127:9362–9363. doi: 10.1021/ja052027u. [DOI] [PubMed] [Google Scholar]; (b) Caruso EB, Petralia S, Conoci S, Giuffrida S, Sortino S. J Am Chem Soc. 2007;129:480–481. doi: 10.1021/ja067568d. [DOI] [PubMed] [Google Scholar]
- 15.Neuman D, Ostrowski AD, Absalonson RO, Strouse GF, Ford PC. J Am Chem Soc. 2007;129:4146–4147. doi: 10.1021/ja070490w. [DOI] [PubMed] [Google Scholar]
- 16.(a) Murray CB, Norris DJ, Bawendi MG. J Am Chem Soc. 1993;115:8706–8715. [Google Scholar]; (b) Talapin DV, Rogach aL, Kornowski A, Haase M, Weller H. Nano Lett. 2001;1:207–211. doi: 10.1021/nl0155126. [DOI] [PubMed] [Google Scholar]; (c) de Mello Donega C, Hickey SG, Wuister S, Vanmaekelbergh D, Meijerink A. J Phys Chem B. 2003;107:489–496. [Google Scholar]
- 17.Mikulec FV, Kuno M, Bennati M, Hall DA, Griffin RG, Bawendi MG. J Am Chem Soc. 2000;122:2532–2540. [Google Scholar]
- 18.Dabbousi BO, Rodriguez-Viejo J, Mikulec FV, Heine JR, Mattoussi H, Ober R, Jensen KF, Bawendi MG. J Phys Chem B. 1997;101:9463–9475. [Google Scholar]
- 19.(a) Uyeda HT, Medintz IL, Jaiswai JK, Simon SM, Mattoussi H. J Am Chem Soc. 2005;127:3870–3878. doi: 10.1021/ja044031w. [DOI] [PubMed] [Google Scholar]; (b) Gunsalus IC, Barton LS, Gruber W. J Am Chem Soc. 1956;78:1763–1766. [Google Scholar]; (c) Wagner AF, Walton E, Boxer GE, Pruss MP, Holly FW, Folkers K. J Am Chem Soc. 1956;78:5079–5081. [Google Scholar]
- 20.Cheng C-T, Chen C-Y, Lai C-W, Liu W-H, Pu S-C, Chou P-T, Chou Y-H, Chiu H-T. J Mater Chem. 2005;15:3409–3414. [Google Scholar]
- 21.Bakac A, Espenson JH. Inorg Chem. 1992;31:1108–1109. [Google Scholar]
- 22.De Leo MA, Bu X, Bentow J, Ford PC. Inorg Chim Acta. 2000;300–302:944–950. [Google Scholar]
- 23.Kane-Maguire NAP, Bennett JA, Miller PK. Inorg Chim Acta. 1983;76:L123–L125. [Google Scholar]
- 24.Caspar JV, Meyer TJ. J Am Chem Soc. 1983;105:5583–5590. [Google Scholar]
- 25.O’Connor DV, Phillips D. Time Correlated Single Photon Counting. Academic Press; London, U. K: 1984. [Google Scholar]
- 26.Klimov VI, McBranch DW. Opt Lett. 1998;23:277–279. doi: 10.1364/ol.23.000277. [DOI] [PubMed] [Google Scholar]
- 27.Kutal C, Adamson AW. Inorg Chem. 1973;12:1990–1994. [Google Scholar]
- 28.(a) Förster T. Discuss Faraday Soc. 1959;27:7–17. [Google Scholar]; (b) Lakowicz JR. Principles of Fluorescence Spectroscopy. 2. Kluwer Academic; New York: 1999. [Google Scholar]
- 29.(a) Kloepfer JA, Bradforth SE, Nadeau JL. J Phys Chem B. 2005;109:9996–10003. doi: 10.1021/jp044581g. [DOI] [PubMed] [Google Scholar]; (b) Selmarten D, Jones M, Rumbles G, Yu P, Nedeljkovic J, Shaheen S. J Phys Chem B. 2005;109:15927–15932. doi: 10.1021/jp0515479. [DOI] [PubMed] [Google Scholar]; (c) Crooker SA, Barrick T, Hollinsworth JA, Klimov VI. Appl Phys Lett. 2003;82:2793–2795. [Google Scholar]; (d) Javier A, Magana D, Jennings T, Strouse GF. Appl Phys Lett. 2003;83:1423–1425. [Google Scholar]
- 30.Klimov VI, McBranch DW, Leatherdale CA, Bawendi MG. Phys Rev B. 1999;60:13740–13749. [Google Scholar]
- 31.Maurel V, Laferrière M, Billone P, Godin R, Scaiano JC. J Phys Chem B. 2006;110:16353–16358. doi: 10.1021/jp061115d. [DOI] [PubMed] [Google Scholar]
- 32.The number of Zn atoms on the surface (outermost monolayer of ZnS) was estimated based on the known bulk lattice parameters of ZnS assuming a spherical shell.
- 33.(a) Bowen Katari JE, Colvin VL, Alivisatos AP. J Phys Chem. 1994;98:4109–4117. [Google Scholar]; (b) Becerra LR, Murray CB, Griffin RG, Bawendi MG. J Chem Phys. 1994;100:3297–3300. [Google Scholar]
- 34.(a) It should be noted that in the former case, the samples were studied under air atmosphere to approximate the conditions used during the photochemical experiments. At this point it is unclear what affect air (presumably O2) has on the PL of these particular QDs. It has been shown in this laboratory34b and by others (see for example: Nazzal AY, Wang X, Qu L, Yu W, Wang Y, Peng X, Xiao M. J Phys Chem B. 2004;108:5507–5515.Wang Y, Tang Z, Correa-Duarte MA, Pastoriza-Santos I, Giersig M, Kotov NA, Liz-Márzan LM. J Phys Chem B. 2004;108:15461–15469.Myung N, Bae Y, Bard AJ. Nano Lett. 2003;3:747–749..) that various QD preparations (solution and solid state) undergo changes in PL spectral position and intensity as a function of extended light irradiation in the presence of O2. Although similar changes are not expected under the low light intensities used for the present experiment, the influence of dioxygen on the PL behavior of the current system has not been systematically evaluated, (b) Neuman, D. Ph.D. Dissertation, University of California, Santa Barbara 2007.
- 35.Klimov VI. Semiconductor and Metal Nanocrystals-Synthesis and Electronic and Optical Properties. Marcel Dekker; New York: 2004. [Google Scholar]
- 36.(a) Kagan CR, Murray CB, Bawendi MG. Phys Rev B. 1996;54:8633–8643. doi: 10.1103/physrevb.54.8633. [DOI] [PubMed] [Google Scholar]; (b) Crooker SA, Hollingsworth JA, Tretiak S, Klimov VI. Phys Rev Lett. 2002;89:186802-1–186802-4. doi: 10.1103/PhysRevLett.89.186802. [DOI] [PubMed] [Google Scholar]; (c) Achermann M, Petruska MA, Crooker SA, Klimov VI. J Phys Chem B. 2003;107:13782–13787. [Google Scholar]; (d) Lee J, Govorov AO, Kotov NA. Nano Lett. 2005;5:2063–2069. doi: 10.1021/nl051042u. [DOI] [PubMed] [Google Scholar]; (e) Wargnier R, Baranov AV, Maslov VG, Stsiapura V, Artemyev M, Pluot M, Sukhanova A, Nabiev I. Nano Lett. 2004;4:451–457. [Google Scholar]
- 37.(a) Clapp AR, Medintz IL, Mattoussi H. ChemPhysChem. 2006;7:47–57. doi: 10.1002/cphc.200500217. and references therein. [DOI] [PubMed] [Google Scholar]; (b) Clapp AR, Medintz IL, Mauro JM, Fisher BR, Bawendi MG, Mattoussi H. J Am Chem Soc. 2004;126:301–310. doi: 10.1021/ja037088b. [DOI] [PubMed] [Google Scholar]
- 38.Ipe BI, Niemeyer CM. Angew Chemie, Int Ed. 2006;45:504–507. doi: 10.1002/anie.200503084. [DOI] [PubMed] [Google Scholar]
- 39.(a) Pons T, Medintz IL, Mattoussi H. Proc SPIE. 2006;6096:60961H-1–60961H-10. [Google Scholar]; (b) Ipe BI, Shukla A, Lu H, Zou B, Rehage H, Niemeyer CM. ChemPhysChem. 2006;7:1112–1118. doi: 10.1002/cphc.200500660. [DOI] [PubMed] [Google Scholar]
- 40.Dayal S, Królicki R, Lou Y, Qiu X, Berlin JC, Kenney ME, Burda C. Appl Phys B. 2006;84:309–315. [Google Scholar]
- 41.(a) Cebula J, Ottewill RH, Ralston J, Pusey PN. J Chem Soc, Faraday Trans. 1981;777:2585–2612. [Google Scholar]; (b) Pompa PP, Chiuri R, Manna L, Pellegrino T, del Mercato LL, Parak WJ, Calabi R, Cingolani R, Rinaldi R. Chem Phys Lett. 2006;417:351–357. [Google Scholar]
- 42.Ebenstein Y, Maokari T, Banin U. Appl Phys Lett. 2002;80:4033–4035. [Google Scholar]
- 43.Dayal S, Lou Y, Cristina A, Samia S, Berlin JC, Kenney ME, Burda C. J Am Chem Soc. 2006;128:13974–13975. doi: 10.1021/ja063415e. [DOI] [PubMed] [Google Scholar]
- 44.Sykora M, Petruska MA, Alstrum-Acevedo J, Bezel L, Meyer TJ, Klimov VI. J Am Chem Soc. 2006;128:9984–9985. doi: 10.1021/ja061556a. [DOI] [PubMed] [Google Scholar]
- 45.As a reviewer has pointed out, flocculation of the QDs might be expected as the result of charge neutralization of the surface owing to the ion pairing with the cationic Cr(III) complexes. Such flocculation was indeed observed to occur very slowly upon standing for solutions at the highest quencher concentrations used. For this reason, photophysics measurements were only made with freshly prepared buffer solutions that did not indicate formation of insoluble particles.
Associated Data
This section collects any data citations, data availability statements, or supplementary materials included in this article.
Supplementary Materials
Figures S-l through S-6 display the optical properties of the QDs under various conditions discussed in the text. More detailed discussions of the methods used to prepare QDs and to determine the Förster radius, the energy transfer rate, and the number of chromium complexes that can associate around a single QD are also presented. This material is available free of charge via the Internet at http://pubs.acs.org.