

Abstract
In subjects trained extensively to indicate a perceptual decision with an action, neural commands that generate the action can represent the process of forming the decision. However, it is unknown whether this representation requires overtraining or reflects a more general link between perceptual and motor processing. We examined how perceptual processing is represented in motor commands in naive monkeys being trained on a demanding perceptual task, as they first establish the sensory–motor association and then learn to form more accurate perceptual judgments. The task required the monkeys to decide the direction of random-dot motion and respond with an eye movement to one of two visual targets. Using electrically evoked saccades, we examined oculomotor commands that developed during motion viewing. Throughout training, these commands tended to reflect both the subsequent binary choice of saccade target and the weighing of graded motion evidence used to arrive at that choice. Moreover, these decision-related oculomotor signals, along with the time needed to initiate the voluntary saccadic response, changed steadily as training progressed, approximately matching concomitant improvements in behavioral sensitivity to the motion stimulus. Thus, motor circuits may have general access to perceptual processing used to select between actions, even without extensive training. The results also suggest a novel candidate mechanism for some forms of perceptual learning, in which the brain learns rapidly to treat a perceptual decision as a problem of action selection and then over time to use sensory input more effectively to guide the selection process.
Keywords: perceptual learning, decision, microstimulation, frontal eye field, saccade, oculomotor
Introduction
Perceptual decisions require the conversion of noisy sensory evidence into a categorical judgment (Link, 1992; Gold and Shadlen, 2002; Ratcliff and Smith, 2004; Bogacz et al., 2006; Gold and Shadlen, 2007). How and where in the brain the decision is formed appears to depend, at least in part, on experience. Learned improvements in perceptual sensitivity can involve changes in how sensory evidence is interpreted to form the decision (Dosher and Lu, 1998; Law and Gold, 2008). Learned associations between the outcome of the decision process and specific, immediate actions can lead to a representation of the decision process in circuits that prepare the actions (Gold and Shadlen, 2000, 2003). Our goal was to better understand the relationship between these phenomena by examining how experience shapes the representation of decision formation in commands that prepare associated actions.
We trained monkeys to decide the direction of random-dot motion and indicate their decision with an eye movement. In monkeys trained extensively on this task, brain regions involved in generating the eye-movement response, including the lateral intraparietal area (LIP), superior colliculus (SC), and parts of the prefrontal cortex including the frontal eye field (FEF), also represent the accumulation of motion information used to select the response (Horwitz and Newsome, 1999; Kim and Shadlen, 1999; Roitman and Shadlen, 2002). However, it is not known whether extensive training is necessary to establish this link between perceptual and motor processing. If so, it would imply that the perceptual processing is typically performed elsewhere in the brain and only eventually reflected in motor circuits. Conversely, if merely associating a perceptual decision with an action can establish this link, circuits that prepare actions might have more general access to perceptual information used to select among those actions.
Training also causes long-lasting improvements in perceptual sensitivity to visual motion (Ball and Sekuler, 1982, 1987; Law and Gold, 2008). Unlike other forms of perceptual learning thought to involve changes in how sensory information is represented in early sensory areas of cortex (Goldstone, 1998; Gilbert et al., 2001), these perceptual gains do not appear to involve changes in the middle temporal area (MT), which represents motion evidence used to solve the task (Newsome and Paré, 1988; Salzman et al., 1990; Britten et al., 1992, 1996). Instead, these improvements correspond to changes in the representation of accumulating motion evidence in area LIP (Law and Gold, 2008). However, nothing is known about the relationship between these changes in decision processing and the effects of learned behavioral associations on where in the brain they are represented.
We used a microstimulation technique to assess the relationship between decision formation and oculomotor preparation (Gold and Shadlen, 2000, 2003). We show that, throughout training, saccadic eye movements evoked with electrical microstimulation of the FEF during motion viewing reflected both the monkey's subsequent saccadic choice and the motion information used to arrive at that choice. The results suggest that action-oriented circuits might play a general role in processing perceptual information used for action selection.
Materials and Methods
We used two adult rhesus monkeys (Macaca mulatta), one male (At) and one female (Av). Both were naive to behavioral and electrophysiological testing before the experiments began. All behavioral, surgical, and electrophysiological procedures were performed in accordance with the National Institutes of Health Guide for the Care and Use of Laboratory Animals and were approved by the University of Pennsylvania Institutional Animal Care and Use Committee.
Surgical preparation.
Each monkey was prepared for experimental testing in a single surgical session, in which a head-holding device, recording cylinder (Crist Instrument), and single scleral search coil used to monitor eye movements (Robinson, 1963; Judge et al., 1980) was implanted. Magnetic resonance imaging (MRI), along with custom additions to publicly available software packages AFNI (Cox, 1996) and the Caret-SureFit Software Suite (Van Essen et al., 2001), were used to visualize the three-dimensional trajectory of the implanted recording cylinder relative to the FEF and thus guide electrode placement during the experiment (Fig. 1) (Kalwani et al., 2009).
Figure 1.
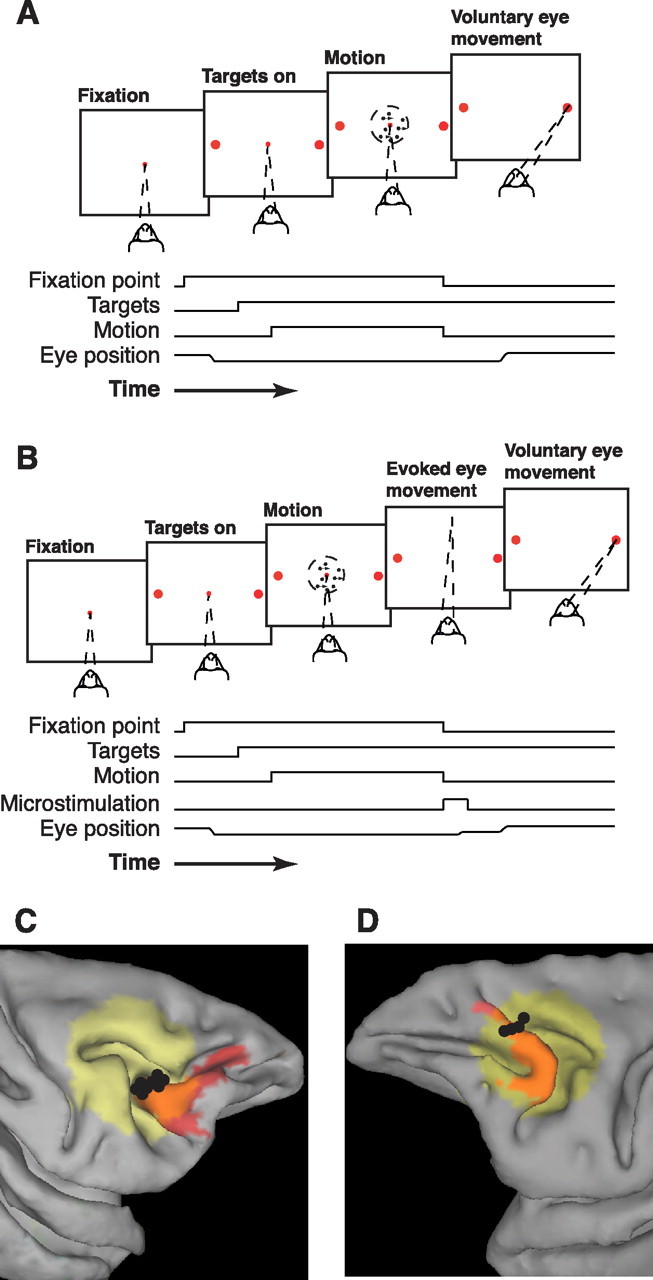
Task design and microstimulation sites. A, Task without microstimulation. The monkeys viewed a random-dot stimulus with a randomly selected duration, motion strength, and direction (two alternatives separated by 180°) of motion. Simultaneous offset of the dots and fixation point indicated to the monkey to make a saccadic eye movement to one of two choice targets located along the axis of motion. A saccade to the target in the direction of motion was followed by auditory feedback and a juice reward. An incorrect saccade was followed by a brief time-out period. B, Task with microstimulation. After finding a microstimulation site in the FEF, the axis of motion was rotated to be approximately perpendicular to the evoked saccades. On a subset of trials, offset of the motion stimulus and fixation point was accompanied by onset of FEF microstimulation, causing an evoked saccade. The monkey then typically made a voluntary saccade to one of the two targets, followed by feedback. C, D, MRI reconstruction of microstimulation sites (black circles) in the FEF (red shaded region) from Felleman and Van Essen (1991) for At (C, right hemisphere) and Av (D, left hemisphere) using Caret (Van Essen et al., 2001) and AFNI (Cox, 1996) brain-mapping software. Yellow shaded region indicates the projection of the recording cylinder onto the surface of the brain (Kalwani et al., 2009).
Behavioral task and training.
The monkeys were initially trained to enter into and sit comfortably in a custom-built primate chair, sit quietly in the testing booth (Acoustic Systems), and perform a simple visually guided saccade task. Once these tasks became routine (after ∼1–2 months), the monkeys were trained on the direction-discrimination task [described in detail by Gold and Shadlen (2003)]. Briefly, the monkey was positioned 60 cm directly in front of a 21-inch CRT monitor (Viewsonic). Visual stimuli were generated in MATLAB on a Macintosh computer, using the Psychophysics Toolbox software (Brainard, 1997; Pelli, 1997) with custom additions to draw the motion stimulus. To perform the task, the monkey was required to fixate a central spot while viewing a random-dot motion stimulus until both the fixation point and motion stimulus were turned off simultaneously and then was rewarded for making a saccadic eye movement to the target located in the direction of coherent motion (or with a probability of 0.5 on trials with no coherent motion). On a given trial, a control computer running REX software (Hays, 1982) on the QNX operating system (QNX Software Systems) pseudorandomly chose the direction of coherent motion (from two equally balanced alternatives separated by 180°), percentage of coherently moving dots (0, 3.2, 6.4, 12.8, 25.6, 51.2, or 99.9%), and viewing duration [chosen from an exponential distribution bounded between 0.1 and 1.5 s to avoid trials that were too brief or too long but also to approximate a flat hazard function and therefore minimize the ability to anticipate stimulus offset; the distribution had a mean value of between 0.2 and 0.8 s in a given session to ensure that most trials ended before the expected response would occur on a reaction-time (RT) version of the task]. As the monkeys' performance improved with training, the distributions of motion coherences and viewing durations were adjusted to maintain a relatively stable overall percentage of correct responses [more trials using stimuli with low coherences and short viewing durations were added in later sessions, giving a median (interquartile range, or IQR) percentage correct per session of 72.0 (4.6)% for monkey At, 72.0 (4.2)% for monkey Av], and thus overall feedback and motivation, for each session.
Rewards and penalty times were varied throughout training to maximize motivation and performance. Trials in which the monkey chose the correct target were immediately followed by one or more audible tones paired with 0–5 drops of apple juice, based on a reward schedule that encouraged multiple correct responses. The intertrial delay following these trials was ∼1–1.5 s. For trials in which the monkey chose the other target (“error trials”) or did not complete the trial appropriately [by either breaking fixation or not selecting one of the two choice targets, which occurred in median (IQR) percentage of trials per session = 13.9 (11.2)% for At, 8.0 (7.5)% for Av; these trials were not included in any of the analyses], an additional penalty time of ∼2–3 s was enforced.
Oculomotor measurements.
Eye position was monitored throughout each experimental session using a scleral search coil technique (CNC Engineering) with a coil implanted monocularly in each monkey. Eye position signals were sampled at 1000 Hz. During motion viewing, the monkeys were required to maintain fixation to within ±2.5° of visual angle. After offset of the motion stimulus and fixation point, the monkeys had 80–700 ms in which to initiate a voluntary saccadic response to one of the two targets. Each target was 0.8° in diameter located 8° from the center of the fixation point in both directions along the axis of motion; saccades were required to end within 3.5° of the center of the nearest target or the trial was classified as “no choice” and not included in the analyses. Saccades were defined as eye movements that traveled at least one degree of visual angle, reached a peak velocity of >100°/s and had an instantaneous acceleration of >4°/s2. The end of a saccade was defined as the eye position at the time that eye deceleration was >−4°/s2 (approaching zero) for at least 5 ms. For each voluntary saccade, we measured mistargeting as the absolute distance between saccade end-point and the center of the nearest target) and latency as the time from fixation-point offset to saccade onset.
To measure ongoing oculomotor activity during motion viewing, we evoked saccades with electrical microstimulation of the FEF. Eye movements evoked with electrical microstimulation of one of several brain areas including the FEF and superior colliculus typically have stereotyped trajectories that can be influenced by ongoing oculomotor activity at the time of microstimulation (Sparks and Mays, 1983; Schlag et al., 1989; Kustov and Robinson, 1996; Tehovnik et al., 1999; Martínez-Trujillo and Treue, 2002; Tehovnik and Slocum, 2004). Accordingly, interrupting the direction-discrimination task with FEF microstimulation results in an evoked saccade with a trajectory that is sensitive to oculomotor activity while the direction decision is being formed. In trained monkeys, this activity reflects both the impending eye-movement response and the motion information used to select that response (Gold and Shadlen, 2000, 2003). We assessed how this activity relates to both the motion stimulus and impending saccadic response throughout training.
In most sessions a glass-coated tungsten electrode with an impedance of ∼0.1 MΩ (Alpha Omega) was inserted into the cortex through a sterile guide tube with a NAN microdrive (Plexon). FEF sites were determined by the ability to evoke saccades in darkness with <50 μA of current and a consistent direction. Microstimulation consisted of a train of 0.25-ms-long, biphasic pulses applied at a rate of 400 Hz for 60 ms. Once a microstimulation site was found, the task was oriented so that the axis of motion was approximately orthogonal to the direction of the evoked saccade. The microstimulation current was adjusted to evoke saccades reliably while the monkey performed the direction-discrimination task (60–110 μA). Microstimulation was applied on a subset of trials (typically ∼50%) randomly interleaved in each experiment. For 10 sessions late in training for At and 14 sessions late in training for Av, no microstimulation data were collected and the task was configured with a horizontal axis of motion.
Evoked-saccade trajectories were measured as the vector from the initial eye position (position at stimulus offset) to the endpoint of the evoked saccade. Endpoints typically drifted over the course of an experiment, probably because of relative movement between the brain and the tip of the microelectrode. This drift was corrected by first computing a 150-point running mean of the x and y coordinates of the saccade endpoints associated with each direction choice. The average of the two running means were then subtracted from each endpoint. This procedure corrected for the drift and centered the distributions of endpoints corresponding to the two direction choices nearly at zero. Deviations of the evoked saccade were quantified as the dot product of the endpoint vector of the run-mean subtracted data with the unit vector along the axis of motion in the direction of the monkey's choice. Thus, deviations in the direction of the monkey's choice were positive.
Behavioral data analysis.
We analyzed the behavioral data using a decision model that assumed the monkey's choice on a given trial was based on the value of a decision variable that represented the accumulation of motion information over time [for details, see Eckhoff et al. (2008), especially “ddPow2” of Eq. 37]. Briefly, the value of the decision variable, x, evolves as a function of a time-varying drift rate A(t) and a noise term c dW:
 |
The mean value (μ) of x at time T is the integrated value of the drift rate, which we assumed was a linear function of motion coherence (C) and a power function of time:
 |
where a and n are parameters that govern the coherence and time dependence of A(t). We also assumed that the noise (variance, v) of x scaled by a factor φ with the average drift rate:
where φ and r0 are free parameters. Note that this was not an RT task and so the experimenter, not the subject, controlled viewing duration. Thus, we assumed that evidence was accumulated not to a fixed threshold, as is used in models of performance on RT tasks (Ratcliff and Rouder, 1998), but rather to a fixed time. Specifically, we assumed that the correct choice was made when the value of x at the end of motion viewing was >0, an error otherwise. The psychometric function describing accuracy as a function of motion coherence and viewing time (T) is therefore the following:
 |
Finally, lapses (L, errors at the highest motion strengths) were measured directly as the fraction of errors for stimuli of the highest motion strength and the longest 40% of viewing times used in a given session (the precision of this estimate was quantified using binomial errors) and used to scale the entire function to reach an upper asymptote at L:
We fit session-by-session behavioral data to P(C, T) using two free parameters, a and n. The remaining parameters were set to values used previously (φ = 0.3 and r0 = 10 spikes/s) (see Gold and Shadlen, 2000, 2003; Eckhoff et al., 2008). For a given fit, we computed discrimination threshold as the motion strength required to achieve 82% correct at 0.5 s viewing time.
We assessed goodness-of-fit of the psychometric functions fit to data from individual sessions using Monte Carlo methods (Wichmann and Hill, 2001). For each session, the best-fitting psychometric function was used as a generating function to simulate 2000 data sets. Goodness-of-fit was quantified for the empirical and simulated data sets using root-mean square deviance (Drms, where deviance is two times the logarithm of the ratio of the likelihood of obtaining the data given the model and the likelihood of the saturated model). The distribution of Drms for the simulated data sets was used to generate confidence limits for the empirical fit.
Oculomotor data analysis.
Multiple weighted linear regression was used to relate the mean magnitude of deviation from individual sessions to several parameters:
 |
where Lapse is the upper asymptote of the psychometric function (Eq. 4), Istim is the microstimulation current, Session is session number, Length is the mean length of the evoked saccade, Latency is mean latency, and ε is Gaussian noise with variance that was estimated from the data (SEM magnitude of deviation) from the given session.
A critical parameter in the decision model is a, which describes how the decision variable scales with motion strength and viewing time (Eckhoff et al., 2008). Our analyses focused on finding similar dependences in the oculomotor data. To account for changes in the overall magnitude and variability of each oculomotor parameter (evoked-saccade deviation and voluntary-saccade latency and mistargeting) that might occur across sessions, we computed the z-score of each parameter separately for data corresponding to each choice in each session. We then fit these z-scored data from each session (or pooled data across sessions) to the following linear equations:
and
where βi and γi are fit, real-valued parameters. Equation 6a describes the dependence on motion coherence (C, the fraction of coherently moving dots) and viewing time (T, in seconds). Equation 6b describes the dependence on the multiplicative interaction between coherence and time (to the power n, which is the median value of the time exponent from Eq. 2 fit to the behavioral data for each monkey: 0.51 for At, 0.94 for Av), analogous to the role of a in the decision model (Eq. 2). To compute predicted (scaled) discrimination thresholds from the fits to Equation 6b (see Fig. 9) for each session, the absolute, best-fitting value of γ1 in Equation 6b replaced a in Equation 2 above after scaling by k such that median(kγ1) = median(a).
Figure 9.

Comparison of the motion sensitivity of perceptual and oculomotor data for At (A–D) and Av (E–H). A, E, The motion (coherence and time) dependence of evoked-saccade deviation (|γ1| in Eq. 6b) plotted versus the motion dependence of behavior (a in Eq. 2). B, F, The motion dependence of voluntary-saccade latency plotted versus the motion dependence of behavior. C, G, The motion dependence of voluntary-saccade mistargeting plotted versus the motion dependence of behavior. In A–C and E–G, points represent data from all individual sessions. D, H, Discrimination thresholds measured from behavior (black) and inferred from evoked-saccade deviation (red) and voluntary-saccade latency (green) and mistargeting (blue) data. Thresholds were inferred using the best-fitting, absolute value of γ1 as a parameter in the decision model. Points represent data from individual sessions. Lines are 41-session running means. Points for each data type were rescaled to have equal overall median values; therefore, only the relative trends across sessions are meaningful.
To limit possible confounding effects on the fits to Equation 6 of the different distributions of motion stimuli used in different sessions, we restricted the fits to a range of values of C and T common to each session (C < 99% and 0.1 s < T < 0.6 s). Within this range, the actual values of each parameter used in each session were similar across sessions [median (IQR) value across sessions of the median coherence within a session was 6.5 (6.5)% coherence for both monkeys and of the median viewing time within a session was 0.35 (0.09) s for At and 0.29 (0.02) s for Av]. We further tested for an effect of the slight session-by-session differences in these values by simulating data sets using Equation 6b as a generative model. Specifically, for each parameter we first computed the weighted mean of the best-fitting value of γ1 and γ2 across sessions (weighted by the SEM from each fit), then for each session computed z(C, T) from those mean values and the actual values of C and T used in that session, plus Gaussian noise (with zero mean and the variance of the residuals to the fits to Eq. 6b of the actual data from each session). We then computed correlation coefficients between these simulated data sets and simulated behavioral data generated in a similar manner using the mean behavioral fits across sessions (from Eq. 2).
Results
We trained two monkeys on the direction-discrimination/eye-movement task (Fig. 1) (monkey At was trained for 161 sessions over 437 d for a total of 321,418 trials; monkey Av was trained for 222 sessions over 607 d for a total of 435,425 trials). The task required a conversion of graded sensory input into a binary choice of motor output. Throughout training, we examined the extent to which aspects of the eye-movement response reflected not just the binary choice but also the process of converting the graded sensory input into that choice.
The results are organized as follows. First we show the effects of training on performance, including relatively rapid acquisition of the visuomotor association and subsequent steady gains in sensitivity to the motion stimulus. Next, using the trajectories of eye movements evoked with FEF microstimulation, we show that the monkeys appeared to be preparing their eye-movement responses while forming their direction decisions throughout training. We then show that these developing oculomotor commands became increasingly sensitive to the strength and duration of the motion stimulus used to form the decision and select the appropriate response. Other oculomotor parameters, including the latency to initiate the voluntary saccadic response, also showed a similar increase in motion sensitivity with training. Finally, we show that these changes in oculomotor sensitivity to the motion stimulus were correlated with the concurrent improvements in behavioral performance, implying an ongoing link between perceptual and motor processing.
Behavioral performance
Both monkeys quickly learned the visuomotor association and then slowly improved their sensitivity to weak motion signals over months of training. Figure 2A–C shows performance data from three example sessions in early, middle, and late periods of training for monkey At. In the early session the upper asymptote did not reach perfect performance. This nonzero “lapse rate,” which indicates choice errors for easily perceptible stimuli and is sensitive to how well the monkeys had learned the general requirements of the task including the sensory–motor association, was not apparent in the later sessions. Moreover, the curves shifted leftward and became more separated as a function of viewing time as training progressed, indicating improved sensitivity to weak, brief motion signals.
Figure 2.

Performance. A–C, Data (points) and decision model fits (solid lines; see Eqs. 1–4) from individual sessions for monkey At. Percentage of correct responses is plotted versus motion strength. Grayscale values correspond to different viewing times (three equally spaced bins between 100 and 800 ms, with darker symbols for longer times). More trials with lower coherences and shorter viewing times were added as training progressed and sensitivity improved to maintain an approximately constant overall percentage of correct responses per session. Dashed lines indicate threshold (percentage coherence corresponding to 82% correct at long viewing times, corrected for lapses as in Eq. 4). D, E, Lapse rate (errors for high-coherence, long-duration stimuli; gray triangles, right ordinate) and discrimination threshold (black symbols, left ordinate with a logarithmic scale) as a function of session for At (D) and Av (E). Error bars are SEM. Lines are weighted fits to a decaying single-exponential function. F, G, Degradation of perceptual sensitivity for unfamiliar axes of motion for At (F) and Av (G). The residuals to the exponential fits to threshold (in logarithmic units) in D and E, respectively, are plotted as a function of the familiarity of the axis of motion (the average, angular difference between the current axis of motion and the axes of motion from all previous sessions; larger values indicate less familiar axes). Only sessions with zero lapse rates were used. Lines are weighted linear fits. Positive slopes (H0: slope = 0, p < 0.01 in both panels) indicate that perceptual sensitivity tended to be worse than the current trend for less familiar axes of motion.
For both monkeys, lapse rates declined rapidly with training (Fig. 2D,E, gray triangles). The highest lapse rates (>10% errors for long-duration, high-coherence stimuli) occurred in the very earliest sessions and then declined to near zero (single-exponential fits of lapse vs session had a lower asymptote of zero for both monkeys and a time constant of 3.8 sessions for monkey At, 5.9 sessions for Av). Thus, the monkeys learned both the general requirements of the task and the association between motion direction and saccadic response early in training and subsequently made few or no choice errors for strong stimuli with easily perceived directions of motion.
Perceptual sensitivity increased throughout training (Fig. 2D,E, black circles). We defined discrimination threshold as the motion coherence corresponding to 82% correct at 0.5 s viewing time determined from a decision model (Eqs. 1–4) fit to performance data from individual sessions (example fits are shown in Fig. 2A–C) (Gold and Shadlen, 2000, 2003; Eckhoff et al., 2008). The details of the model were not critical for this result [similar thresholds were obtained using other functions with similar sigmoidal shapes, including a time-dependent cumulative Weibull function (Law and Gold, 2008)] but are used in later analyses. The model fit the data well throughout training: in all sessions for both monkeys, the goodness-of-fit measure Drms was within the 95% confidence intervals computed using Monte Carlo methods from the best-fitting function [see Materials and Methods; median (IQR) Drms = 1.089 (0.057) for At, 1.081 (0.046) for Av]. Based on the model fits, thresholds were higher, implying lower sensitivity, in earlier than in later sessions (geometric mean threshold = 47.9% and 19.3% coherence for the first and last 25 sessions, respectively, t test for H0: difference of logarithmic means = 0, p < 0.01, for monkey At; 63.7% and 17.0% coherence, p < 0.01 for Av). Moreover, the decline in threshold as a function of training sessions was steady but substantially slower than the decline in lapse rate (single-exponential fits of threshold vs session had a time constant of 94.0 sessions for monkey At and 42.0 sessions for Av).
We consider the improvements in perceptual sensitivity, which occurred in the presence of explicit, trial-by-trial feedback and progressed over the course of months, to be a form of perceptual learning. The fact that the lapse rate was zero for the majority of sessions while discrimination threshold improved suggests that the monkeys' choice errors were due to limitations in perceptual processing in these sessions and not failures of associative learning, strategy, or overall knowledge of the task. Moreover, as is the case for many other forms of perceptual learning, the improvements were at least partially specific to the stimulus configurations used during training (e.g., Karni and Sagi, 1991; Poggio et al., 1992; Fahle and Edelman, 1993; Gilbert, 1994; Liu and Weinshall, 2000). Both monkeys tended to perform worse than expected from their current level of training when presented with unfamiliar axes of motion, even when considering only sessions with zero lapse rates (Fig. 2F,G). Thus, novel stimulus configurations tended to degrade perceptual sensitivity to the motion stimulus without affecting task knowledge.
A final consideration was the potential influence of the microstimulation technique on behavioral performance [median (IQR) percentage of microstimulation trials per session = 35.7 (41.9)% for monkey At, 40.9 (30.9)% for monkey Av]. Even in the earliest sessions this manipulation had only a minor effect on the monkeys' ability to complete the trial by making a second, voluntary saccade to one of the two choice targets (the percentage of trials in which the monkey did not select one of the targets was <6% for trials without microstimulation and <2% for trials with microstimulation for all sessions in both monkeys). Moreover, electrical microstimulation did not alter significantly either lapse rate (mean ± SD difference in lapse rate per session for trials without and with microstimulation = 0.0 ± 0.1, t test for H0: mean = 0, p = 0.40 for monkey At; 0.0 ± 0.1, p = 0.88 for Av) or discrimination threshold (mean ± SD difference in log threshold per session for trials without and with microstimulation = 0.0 ± 0.1, t test for H0: mean = 0, p = 0.11 for monkey At; 0.0 ± 0.1, p = 0.59 for Av). Thus, the microstimulation technique appeared to have little effect on perceptual performance.
Oculomotor preparation during decision formation
We used microstimulation-evoked eye movements to assess ongoing oculomotor activity while the monkeys were viewing the motion stimuli and forming their direction decisions (Fig. 3). On randomly selected trials, we interrupted motion viewing at unpredictable times by simultaneously extinguishing the motion stimulus and fixation point and applying electrical microstimulation to the FEF. This manipulation resulted in an evoked saccadic eye movement with a trajectory that depended on the site of microstimulation and is sensitive to ongoing oculomotor activity at the time of microstimulation (Fig. 3A,F) (Robinson and Fuchs, 1969; Bruce et al., 1985; Tehovnik and Slocum, 2004). After completion of the evoked saccade, the monkey made a second, voluntary saccadic eye movement to shift gaze to one of the two choice targets located along the axis of motion, which was oriented approximately perpendicular to the trajectories of the evoked saccades for the given site, to indicate its direction decision. We measured the relationship between the evoked-saccade trajectories and the subsequent voluntary saccades.
Figure 3.

Relationship between evoked-saccade trajectories and the direction decision for monkey At (A–E) and Av (F–J). A, F, Average evoked-saccade vectors from individual sessions resulting from electrical microstimulation of the left (A) or right (F) FEF. B, G, Endpoints of evoked saccades from correct trials in a single session plotted relative to their running-mean values [to remove the effects of drift on the evoked-saccade trajectories and center the distributions of endpoints at zero, the location of the fixation point; see Materials and Methods and Gold and Shadlen (2000, 2003)] and separated by the subsequent voluntary choice (black points for leftward choices, gray for rightward choices). Solid line indicates the axis of motion. Dashed line indicates the optimal linear classifier for distinguishing between the two groups of points. C, H, Circular histogram of the distribution of the angle between the axis of motion and the optimal linear classifier separating evoked-saccade endpoints corresponding to the two direction choices for each session (the minimum angle between the solid and dashed lines in B and G). D, I, Magnitude of deviation versus session. Points and error bars are mean and SEM values, respectively, from correct (black symbols) or error (gray symbols) trials in individual sessions. Positive values indicate that evoked saccades tended to deviate in the direction of the monkey's subsequent choice. Filled symbols indicate H0: magnitude = 0, p < 0.01 (Mann–Whitney test). Lines are weighted linear fits to data from correct trials only (H0: slope = 0, p ≤ 0.05 in both panels). E, J, Ratio of the average magnitude of deviation measured on discrimination trials versus the average magnitude of deviation measured on instructed-saccade trials (which was not performed in all sessions). X marks indicate outliers that typically resulted from a near-zero denominator, plotted at outer bounds of −1 and 2. These points were not included in the linear fits (lines; H0: slope = 0, p < 0.01 in both cases). pos, Position; deg, degree.
The monkeys appeared to be preparing their voluntary saccadic responses during motion viewing. The endpoints of the evoked saccades corresponding to each of the two direction decisions tended to be separated from each other by a line running approximately perpendicular to the axis of motion (Fig. 3B,C,G,H) [median (IQR) minimum angle of a simple linear classifier relative to the axis of motion = 78.2 (17.1)° for monkey At, 72.4 (28.9)° for Av with an upper bound of 90°]. We quantified the magnitude of deviation of the evoked-saccade trajectories along the axis of motion using the dot product between the run-mean subtracted evoked-saccade endpoints (see Materials and Methods) and the unit vector in the direction of the chosen target. This value tended to be positive, indicating that the evoked saccades tended to deviate in the direction of the impending voluntary saccade to the selected target (Fig. 3D,I, black symbols) [median (IQR) magnitude of deviation on correct trials from all sessions = 0.39 (1.13)°, Mann–Whitney test for H0: median = 0, p < 0.01 for At; 0.17 (1.18)°, p < 0.01 for Av]. Throughout training, these deviations also tended to be in the direction of the impending voluntary saccade even for error trials when the motion was in the opposite direction (Fig. 3D,I, gray symbols) [median (IQR) magnitude of deviation on error trials from all sessions = 0.38 (1.16)°, Mann–Whitney test for H0: median = 0, p < 0.01 for At; 0.17 (1.20)°, p < 0.01 for Av]. Thus, the evoked-saccade deviations appeared to behave similarly during and after training, in both cases reflecting the direction of the impending saccadic response and not simply the direction of the motion stimulus (Gold and Shadlen, 2000, 2003).
The average magnitude of deviation per session declined systematically with training, a particularly striking effect for monkey At (Fig. 3D,I). A multiple, weighted linear regression showed a consistent, session-by-session relationship between deviation magnitude and session number but not lapse rate, microstimulation current, mean length of the evoked saccade, or mean latency of the voluntary response for both monkeys (Eq. 5; p < 0.05 for H0: α3 = 0 for both monkeys and α5 = 0 for Av, p > 0.05 otherwise) (Table 1). There was a similar decline with training of deviation magnitude measured on discrimination trials relative to deviation magnitude measured on randomly interleaved trials of a simple instructed-saccade task, in which only a single (correct) target was shown and thus no deliberative decision process was necessary (Fig. 3E,J). These results imply that ongoing oculomotor activity during motion viewing was strongest early in training, as soon as the monkeys learned to indicate their direction decision with an eye movement. As training progressed, this activity became less like preparing the obligatory saccadic response on instructed trials, mirroring the increasingly deliberative process of forming the direction decision from the sensory evidence.
Table 1.
Regression parameters for deviation magnitude (Eq. 5)
| Parameter | Monkey At | Monkey Av |
|---|---|---|
| Lapse rate (α1, °/% error) | 0.0103 (−0.0080, 0.0286) | −0.0018 (−0.0094, 0.0058) |
| Istim (α2, °/μA) | 0.0134 (−0.0077, 0.0191) | 0.0027 (−0.0009, 0.0044) |
| Session (α3, °/session) | −0.0029 (−0.0048, −0.0011) | −0.0004 (−0.0008, −0.0002) |
| Mean evoked-saccade length (α4, °/°) | −0.0004 (−0.0125, 0.0117) | −0.0002 (−0.0048, 0.0045) |
| Mean latency (α5, °/ms) | −0.0026 (−0.0052, 0.0001) | −0.0020 (−0.0037, −0.0004) |
Values are maximum-likelihood fits (95% confidence intervals). Bold indicates significantly different from zero.
Influence of motion information on oculomotor parameters
We used the evoked-saccade deviations to test whether ongoing oculomotor activity during motion viewing also reflected the perceptual information used to select the saccadic response. To better understand how these oculomotor signals relate to formation of the perceptual decision used to select the saccadic response versus execution of the response itself, we also analyzed two other parameters of the response, both measured on trials without microstimulation. Latency, measured from the offset of the motion stimulus and fixation point to the onset of the saccade [median (IQR) value from all trials = 270 (64) ms for At, 249 (46) ms for Av], can, in principle, reflect factors involved in the selection and preparation of the response (Luce, 1986; Carpenter and Williams, 1995). In contrast, mistargeting, measured as the distance between the endpoint of the voluntary saccade and the midpoint of the nearest target [median (IQR) value from all trials = 0.91 (0.56)° for At, 1.48 (1.06)° for Av], is assumed to be related less to selection and more to the execution of the response.
We compared all three parameters (evoked-saccade deviation and voluntary-saccade latency and mistargeting) to the expected value of the coherence- and time-dependent decision variable inferred from behavior [μ(C, T)/ from Eq. 3] (Fig. 4). This variable, which quantifies the discriminability of the stimulus (Green and Swets, 1966; Graham, 1989), is based on an accumulation of information over time and thus is a form of sequential sampling model used extensively for psychophysical analysis (LaBerge, 1962; Audley and Pike, 1965; Laming, 1968; Luce, 1986; Link, 1992; Ratcliff and Smith, 2004; Bogacz et al., 2006). As has been reported previously for the direction-discrimination task, discriminability grew as a function of viewing time with a rate of rise that increased with increasing motion strength (Fig. 4A–D) (Wang, 2002; Ditterich, 2006; Shadlen et al., 2006; Grossberg and Pilly, 2008). The strength of this dependence on coherence and time increased with training (Fig. 4E,F), accounting for the improvements in discrimination threshold (Eckhoff et al., 2008).
Figure 4.

The coherence- and time-dependent decision variable derived from behavior. A–D, Expected value of the decision variable [μ(C, T)/ from Eq. 3] from correct trials using the mean values of the best-fitting parameters fit to data from individual sessions for both monkeys (A: sessions 1–30; B: sessions 31–80 for At, 31–90 for Av; C: 81–142 for At, 91–170 for Av; D: 143–161 for At, 171–222 for Av) plotted as a function of viewing time for different motion strengths (see inset in A). E, F, Best-fitting value and SEM of the parameter a from Equation 2 describing the scaling of the decision variable fit to behavioral data from individual sessions for At (E) and Av (F), plotted as a function of session number. Lines are weighted linear fits (H0: slope = 0, p < 0.01 in both cases). a.u., Arbitrary units.
Evoked-saccade deviations tended to be positively correlated with the strength and, to a greater extent, duration of the motion stimulus on a trial-by-trial basis in individual sessions (Fig. 5A,C) (the Spearman's rank correlation coefficient between the trial-by-trial magnitude of deviation and motion coherence per session had a median value of 0.03, Mann–Whitney for H0: median = 0, p < 0.01, for At and 0.02, p < 0.01, for Av; the Spearman's rank correlation coefficient between the trial-by-trial magnitude of deviation and motion viewing time per session had a median value of 0.16, p < 0.01, for At and 0.07, p < 0.01, for Av). Together, these dependencies were reflected in positive correlations between the magnitude of deviation and the expected value of the coherence- and time-dependent decision variable inferred from behavior (Fig. 5B,D) (the Spearman's rank correlation coefficient between the trial-by-trial magnitude of deviation and the expected value of the decision variable described in Eq. 2 for correct trials had a median value of 0.08, Mann–Whitney p < 0.01, and was >0 for 111 sessions and <0 for 34 sessions for At; median = 0.06, p < 0.01, >0 for 149 sessions and <0 for 53 sessions for Av).
Figure 5.

The coherence and time dependence of evoked-saccade deviations. A, C, Scatter plots of Spearman's rank correlation coefficients (ρ) between the trial-by-trial magnitude of deviation and the coherence (abscissa) or viewing time (ordinate) of the motion stimulus. Points indicate values of ρ computed from individual sessions for monkeys At (A) and Av (C) for correct trials. Arrows are medians. B, D, Histograms of ρ between the trial-by-trial magnitude of deviation and the coherence- and time-dependent decision variable inferred from behavior on correct trials computed for individual sessions for At (B) and Av (D). Arrows indicate median values. Gray bars indicate counts corresponding to H0: ρ = 0, p < 0.05. Positive values in A–D imply that the deviations tended to be larger on trials with more easily discriminable stimuli. E–H, Average deviations (z-scored per choice per session) from blocks of sessions for both monkeys combined (using the same sessions described for Fig. 4A–D), computed as the mean value in 100-ms-wide bins of viewing time offset in steps of 25 ms for each coherence (see inset in E). These plots include only data from correct trials and sessions in which ρ > 0 (from B and D). I–L, Same conventions as in E–H, but using only data from sessions in which ρ < 0. M, N, Best-fitting values of γ1 (and SEMs) from Equation 6b, which quantifies the relationship between deviation magnitude and the strength and duration of the motion stimulus on the given trial, plotted as a function of session number. Lines are linear fits (H0: slope = 0, p < 0.05 in both cases).
The growth of deviation magnitude as a function of both motion strength and viewing time is illustrated in Figure 5E–H. Each panel shows the average magnitude of deviation as a function of viewing time for different coherences at different points of training from both monkeys, using only sessions with positive correlations between deviation magnitude and the expected value of the inferred decision variable. To combine data across sessions that could differ in magnitude and variability (Fig. 3), we first took z-scores of deviation magnitude per choice and per session (note that the average deviation magnitude, before computing z-scores, across sessions was positive for each panel, implying a tendency to deviate in the direction of the subsequently selected target: mean ± SEM deviation magnitude = 1.17 ± 0.03° for the data in Fig. 5E, 0.51 ± 0.01° for F, 0.29 ± 0.01° for G, and 0.25 ± 0.01° for H). Thus, the ordinate in Figure 5E–H is in units of z-score, with positive values implying deviations that were larger than the mean value for the given choice and session and negative values implying deviations that were smaller than the mean value for the given choice and session. The z-scored deviations tended to increase with increasing motion coherence and viewing time (weighted linear regression using Eq. 6a; H0: β1, β2 = 0, p < 0.01 in all four panels). Moreover, there was a steady progression on the dependence of deviation magnitude on the multiplicative interaction between motion strength and viewing time, consistent with the progression of the expected value of the coherence- and time-dependent decision variable inferred from behavior [weighted linear regression using Eq. 6b; Fig. 5E: γ1 (95% CI) = 0.36 (0.25, 0.48) z(deviation)/coh/s; F: 0.29 (0.12, 0.46); G: 0.67 (0.54, 0.80); H: 0.97 (0.62, 1.31)].
Despite this overall tendency of deviations to increase with increasing motion strength and viewing times, there were also sites throughout training that showed the opposite effect, with deviations that tended to decrease with increasing motion strength and viewing time (Fig. 5I–L). These “negative” effects, like the “positive” effects, corresponded to evoked-evoked saccade trajectories that tended to deviate in the direction of the chosen target (mean ± SEM magnitude of deviation = 0.91 ± 0.04° for the data in Fig. 5I, 0.54 ± 0.02° for J, 0.30 ± 0.01° for K, and 0.34 ± 0.02° for L). The negative effects also reflected increasing sensitivity to the motion stimulus with training. Deviation magnitude depended negatively on motion coherence and either positively (Fig. 5I,J) or negatively (Fig. 5K,L) on viewing time (weighted linear regression using Eq. 6a; H0: β1, β2 = 0, p < 0.05). There was also a general progression of the dependence of deviation magnitude on the multiplicative interaction between motion strength and viewing time [weighted linear regression using Eq. 6b; Fig. 5I: γ1 (95% CI) = −0.13 (−0.27, 0.00) z(deviation)/coh/s; J: −0.42 (−0.52, −0.33); K: −0.26 (−0.34, −0.18); L: −0.83 (−1.19, −0.47)].
We do not know what gave rise to a positive or negative effect for a given site. Both effects occurred throughout training for both monkeys, with no systematic change in their relative frequency of occurrence [the fraction of positive effects in a sliding 21-session window had a median (IQR) value of 0.57 (0.26) for At, 0.60 (0.10) for Av and did not vary as a function of training session, linear regression H0: slope = 0, p > 0.05]. Likewise, the presence of a positive versus negative effect did not appear to be related to the mean vector length of the evoked saccade, mean distance of the endpoint of the evoked saccade to the nearest choice target, mean latency of the voluntary saccade, or amplitude of the microstimulation current (Mann–Whitney test for H0: equal medians of the distributions of each parameter computed for each positive or negative case, p > 0.08 for all parameters and both monkeys). Therefore, the oculomotor system appeared to have access to dual representations of the process of evidence accumulation, one that tended to increase in magnitude for easier stimuli, the other that tended to decrease in magnitude for easier stimuli.
The dependence of deviation magnitude on the motion information used to form the decision throughout training for each monkey is summarized in Figure 5, M and N. For both monkeys, this dependence was near zero at the beginning of training and then progressed, on average, to more positive values (for both monkeys, a weighted linear regression of the best-fitting value of γ1 from Eq. 6b vs session number had a positive slope, p < 0.05). Consistent with the positive and negative effects described above, these fits also showed positive and negative effects throughout training: γ1 > 0 implies increasing deviation magnitude for increasing motion strength and viewing time, whereas γ1 < 0 implies decreasing deviation magnitude for increasing motion strength and viewing time. Considering these effects separately, there was also a steady progression with training of the magnitude of γ1 (weighted linear regressions of γ1 vs session for all γ1 > 0: slope > 0 for both monkeys, p < 0.05; for all γ1 < 0: slope < 0 for both monkeys, p < 0.05). Thus, with training the evoked saccades tended to become increasingly sensitive to the motion information used to form the direction decision.
The above analyses suggest that the average value of the evoked-saccade deviations, like the expected value of the decision variable inferred from behavior, is an analog quantity that reflects an accumulation of motion information over time. An alternative possibility is that neither the decision variable nor the deviations reflect such an analog quantity but rather a mixture of binary states that depend on whether or not the decision has been made. For example, probability summation over time combined with a high threshold would imply that arriving motion signals either trigger a committed “decision” state or do not affect the uncommitted “no decision” state that leads to guesses (Green and Swets, 1966; Watson, 1979; Graham, 1989). Under such conditions, the deviations might be expected to reflect mixtures of the two states. For example, strong stimuli would be more likely to reach threshold and therefore might correspond to large deviations, weak stimuli would be more likely to result in guesses and therefore might correspond to small deviations, and intermediate stimuli would lead to mixtures of large and small deviations. Such a mixture model predicts that the widths of distributions of deviation magnitude are larger for trials with intermediate versus easy or difficult stimuli (Gold and Shadlen, 2003).
We found that this prediction was inconsistent with our data. The IQR of deviation magnitude was typically smaller than the IQR predicted by the mixture model (Fig. 6) (median ratio of actual/predicted IQR = 0.97 for At, 0.95 for Av; paired Wilcoxon signed-rank test for H0: mixture = actual IQR, p < 0.01 for both monkeys). In one monkey, the mixture model tended to be more predictive of the actual IQR early in training (Fig. 6C), possibly reflecting an early guessing strategy. However, the minimal dependence of deviation magnitude on motion information in those sessions makes this analysis difficult to interpret. For a more sensitive analysis, we also compared directly fits of a mixture and nonmixture model. The mixture model assumed that the deviation data resulted from a mixture of two independent generative processes, each of which generated Gaussian-distributed data with a unique mean and a common SD (i.e., three free parameters). The nonmixture model assumed that the deviation data resulted from a single generative process, which generated Gaussian-distributed data with a mean that varied with motion information according to Equation 6b and a fixed SD (i.e., three free parameters). These fits tended to favor slightly the nonmixture model, which did not change systematically with training in either monkey [the evidence ratio of the Akaike's information criterion of the mixture versus nonmixture model had a mean value of 1.09 for At and 1.73 for Av, implying that the nonmixture model was slightly more likely; H0: slope of a linear fit of the evidence ratio vs session = 0, p > 0.05 for both monkeys (Burnham and Anderson, 2004)].
Figure 6.

Mixture model. A, The interquartile range (IQR; i.e., width) of the distribution of deviation magnitude plotted as a function of the median of the distribution for an example session. Each point corresponds to trials binned by the expected value of the decision variable (DV). Increasing values of the DV and therefore easier trials correspond to increasing median magnitudes of deviation. Black symbols are data. Gray symbols are predictions from a mixture model in which the given distribution was generated by taking a mixture of values from the leftmost and rightmost distributions of real data. In all three intermediate cases (excluding the two extremes), the mixture distribution had a similar median value but larger IQR than the corresponding real distribution. B, C, Summary of the mixture-model analysis for monkeys At (B) and Av (C). The ratio of the IQR of a simulated mixture distribution (e.g., gray symbols in A) and the IQR of the real distribution with a similar median value as the mixture distribution (e.g., black symbols in A, excluding the two extremes used to generate the mixtures) is plotted as a function of session number. A value of <1 implies that the actual IQR was smaller than the predicted mixture IQR. Points are medians, and lines indicate extremes for data from individual sessions binned as in A. Robust linear fits of the median values versus session number had a significant, negative slope for Av (solid line in C, p < 0.05) but not At. deg, Degree.
Voluntary-saccade latencies tended to be negatively correlated with the strength of the motion stimulus on a trial-by-trial basis in individual sessions (Fig. 7A,C) (the Spearman's rank correlation coefficient between the trial-by-trial latency and motion coherence per session had a median value of −0.09, Mann–Whitney for H0: median = 0, p < 0.01, for At and −0.15, p < 0.01, for Av) but not consistently correlated with viewing time (the Spearman's rank correlation coefficient between the trial-by-trial latency and motion viewing time per session had a median value of 0.04, p = 0.04, for At and −0.05, p < 0.01, for Av). Together, these dependencies were reflected in positive correlations between latency and the expected value of the coherence- and time-dependent decision variable inferred from behavior (Fig. 7B,D) (the Spearman's rank correlation coefficient between the trial-by-trial latency and the expected value of the decision variable described in Eq. 2 for correct trials had a median value of −0.09, Mann–Whitney p < 0.01, and was >0 for 41 sessions and <0 for 109 sessions for At; median = −0.17, p < 0.01, >0 for 6 sessions and <0 for 206 sessions for Av).
Figure 7.

The coherence and time dependence of voluntary-saccade latencies. A, C, Scatter plots of Spearman's rank correlation coefficients (ρ) between the trial-by-trial latency and the coherence (abscissa) or viewing time (ordinate) of the motion stimulus. Points indicate values of ρ computed from individual sessions for monkeys At (A) and Av (C) for correct trials. Arrows are medians. B, D, Histograms of ρ between the trial-by-trial latency and the decision variable inferred from behavior on correct, nonmicrostimulation trials computed for individual sessions for At (B) and Av (D). Arrows indicate median values. Gray bars indicate counts corresponding to H0: ρ = 0, p < 0.05. Negative values in A–D imply that latencies tended to be shorter (responses were faster) on trials with more easily discriminable stimuli. E–H, Average latencies (z-scored per choice per session) from correct trials in blocks of sessions for both monkeys combined (using the same sessions described for Fig. 4A–D), computed as the mean value in 100-ms-wide bins of viewing time offset in steps of 25 ms for each coherence (see inset in E). The arrow in each panel indicates the mean viewing time used in the given sessions. I, J, Best-fitting values of γ1 (and SEMs) from Equation 6b, which quantifies the relationship between latency and the strength and duration of the motion stimulus on the given trial, plotted as a function of session number. Lines are linear fits (H0: slope = 0, p < 0.05 in both cases).
The change in latency as a function of both motion strength and viewing time is illustrated in Figure 7E–H. Each panel shows the average latency from both monkeys as a function of viewing time for different coherences at different points of training. In each case, latency tended to decrease (i.e., responses were faster) with increasing motion coherence (weighted linear regression using Eq. 6a; H0: β1 = 0, p < 0.01 in all four panels). The dependence on viewing time was less monotonic than the dependence on coherence, with minima that tended to occur at progressively early viewing times with training. The times at which these minima occurred were strongly correlated with the average viewing time in a given session [correlation coefficient computed across sessions between the time of the minimum value of latency vs viewing time, smoothed using a 101-point-wide boxcar filter, and the mean (95% CI) viewing time from the given session was 0.65 (0.53, 0.72) for At and 0.22 (0.09, 0.35) for Av], suggesting that the latencies at least partially reflected the anticipated end of the motion viewing period (an effect that we attempted to minimize by choosing viewing times that were consistent with an approximately flat hazard function). Nevertheless, like the deviations, the latencies also appeared to reflect the coherence × time-dependent decision process that became stronger with training [weighted linear regression using Eq. 6b; Fig. 7E: γ1 (95% CI) = −0.73 (−0.88, −0.58) z(latency)/coh/s; F: −0.98 (−1.06, −0.89); G: −1.11 (−1.23, −0.99); H: −1.53 (−1.76, −1.30)].
The dependence of voluntary-saccade latency on the motion information used to form the decision throughout training for each monkey is summarized in Figure 7, I and J. We fit data from individual sessions to Equation 6b, using only trials with viewing times less than the mean viewing time used in the given session. For both monkeys, the best-fitting value of γ1 was negative for most sessions and progressed steadily to increasingly negative values as training progressed (for both monkeys, a weighted linear regression of the best-fitting value of γ1 from Eq. 6b vs session number had a negative slope, p < 0.05). Thus, with training the latency between dots offset and saccade initiation tended to become increasingly sensitive to the motion information used to form the direction decision.
Voluntary-saccade targeting errors were, on average, positively correlated with motion strength, viewing time, and their multiplicative interaction for monkey At (Fig. 8A,B) (Spearman's rank correlation coefficients between the trial-by-trial mistargeting magnitude and coherence, time, and the expected value of the coherence- and time-dependent decision variable inferred from behavior had median values of 0.05, 0.06, and 0.07, respectively, Mann–Whitney p < 0.01 for all three cases) but not Av (Fig. 8C,D) (median values of 0.02, −0.01, and 0.01, respectively, p > 0.01). Because there were both positive and negative correlations in both monkeys, like for the deviation data we separated the mistargeting data to visualize these effects individually (sessions in which mistargeting tended to increase with increasing motion coherence and viewing time are shown in Fig. 8E–H, sessions with opposite effects are shown in I–L). For sessions with positive correlations, mistargeting tended to increase as a function of coherence and, to a lesser extent, viewing time (weighted linear regression using Eq. 6a; H0: β1 = 0, p < 0.05 in Fig. 8E–H, H0: β2 = 0, p < 0.05 in F–H). For sessions with negative correlations, mistargeting tended to decrease as a function of coherence but not viewing time (weighted linear regression using Eq. 6a; H0: β1 = 0, p < 0.05 in Fig. 8I–L, H0: β2 = 0, p > 0.05 in I–L). In both cases, there was a rough progression in the dependence on coherence × time [weighted linear regression using Eq. 6b; Fig. 8E: γ1 (95% CI) = 0.35 (0.31, 0.39) z(mistargeting)/coh/s; F: 0.57 (0.50, 0.65); G: 0.47 (0.41, 0.53); H: 0.84 (0.71, 0.97); I: −0.07 (−0.15, 0.00); J: −0.35 (−0.41, −0.29); K: −0.38 (−0.43, −0.33); L: −0.74 (−0.85, −0.63)].
Figure 8.

The coherence and time dependence of voluntary-saccade targeting errors. A, C, Scatter plots of Spearman's rank correlation coefficients (ρ) between the trial-by-trial targeting error and the coherence (abscissa) or viewing time (ordinate) of the motion stimulus. Points indicate values of ρ computed from individual sessions for monkeys At (A) and Av (C) for correct trials. Arrows are medians. B, D, Histograms of ρ between the trial-by-trial targeting error and the decision variable inferred from behavior on correct, nonmicrostimulation trials computed for individual sessions for At (B) and Av (D). Arrows indicate median values. Gray bars indicate counts corresponding to H0: ρ = 0, p < 0.05. Positive values in A–D imply that the saccade endpoints were further from the chosen target on trials with more easily discriminable stimuli. E–H, Average mistargeting magnitude (z-scored per choice per session) from blocks of sessions for both monkeys combined (using the same sessions described for Fig. 4A–D), computed as the mean value in 100-ms-wide bins of viewing time offset in steps of 25 ms for each coherence (see inset in E). These plots include only data from correct trials and sessions in which ρ > 0 (from B and D). I–L, Same conventions as in E–H, but using only data from sessions in which ρ < 0. M, N, Best-fitting values of γ1 (and SEMs) from Equation 6b, which quantifies the relationship between mistargeting magnitude and the strength and duration of the motion stimulus on the given trial, plotted as a function of session number. In both cases, the slope of a weighted linear regression was not significantly different from zero (p > 0.05).
The dependence of voluntary-saccade mistargeting on the motion information used to form the decision throughout training is summarized in Figure 8, M and N. For both monkeys, the best-fitting value of γ1 from Equation 6b did not change as a function of session number when considering all sessions together (weighted linear regression, H0: slope = 0, p > 0.05) or only sessions in which γ1 < 0 (p > 0.05), although there was a positive slope for sessions in which γ1 > 0 (p < 0.05). Thus, there appeared some dependence of mistargeting on the motion information used to select the appropriate eye-movement response, like for the deviation and latency data. However, the mistargeting data appeared to be less sensitive to the improvements in perceptual sensitivity that occurred with training. These results suggest that the perceptual information reflected in the deviation and latency data was consistent, at least in part, with a role in the selection but not necessarily execution of the oculomotor response.
Comparing oculomotor and behavioral sensitivity to weak motion
There was a session-by-session correspondence between perceptual and oculomotor sensitivity to the motion stimulus (Fig. 9). We compared the absolute values of the coherence × time interaction terms from the fits to behavior (a in Eq. 2) and the deviation, latency, and mistargeting data (γ1 in Eq. 6b). Both terms describe how the measured quantity changed as a function of coherence × time, a measure of sensitivity to the motion stimulus. We use the absolute value of each term to measure sensitivity regardless of whether the change in stimulus parameters resulted in an increase (i.e., for behavior and “positive” deviation and mistargeting effects) or decrease (i.e., for latency and “negative” deviation and mistargeting effects) in the magnitude of the measured quantity. Thus, a large value for each term implies that a given change in motion coherence and/or viewing time resulted in a large change in the average, absolute value of the measured quantity and therefore high sensitivity to those stimulus parameters.
There was a significant, positive correlation between the behavioral fits and the fits to deviation (Spearman's rank correlation coefficient ρ = 0.37, p < 0.01 for H0: ρ = 0 for At, 0.33, p < 0.01 for Av), latency (0.41, p < 0.01 for At, 0.39, p < 0.01 for Av), and mistargeting data for Av (0.23, p < 0.01) but not At (0.06, p = 0.43). These correlations did not simply reflect the fact that the behavioral and oculomotor parameters depended on the same stimulus variables (motion coherence and time) that were adjusted from session to session, because simulated data sets generated using average values of a and γ1 across sessions but the specific set of coherences and times per session (see Materials and Methods) were not correlated (behavior vs deviation, ρ = −0.37, p = 0.51 for H0: ρ = 0 for Av, ρ = 0.01, p = 0.90 for At; behavior vs latency, ρ = 0.04, p = 0.65 for Av, ρ = 0.04, p = 0.58 for At; behavior vs mistargeting, ρ = 0.03, p = 0.70 for Av, ρ = −0.04, p = 0.53 for At). Moreover, the time course of change for perceptual sensitivity and the motion dependence of deviation and latency (and mistargeting for Av but less so for At) was similar, in all cases declining steadily over the course of training (Fig. 9D,H). Thus, the sensitivity of performance, developing oculomotor commands, and saccadic latencies to weak motion signals increased similarly with training, implying that all three shared a common representation of sensory information that was modified by experience.
Discussion
We trained monkeys to make a difficult perceptual decision about the direction of visual motion and respond with an eye movement. We examined the relationship between formation of the direction decision from the sensory evidence and preparation of the eye-movement response. We found that the two processes were closely linked throughout training, with a continuous flow of sensory evidence apparent in developing oculomotor commands while the monkey was viewing the visual stimulus and forming its decision. This oculomotor representation, like task performance, became increasingly sensitive to weak motion input as training progressed. The results suggest that the brain can learn to treat perceptual decisions as problems of motor selection and then gradually shape how well this process uses sensory input to select the appropriate behavioral response.
Our results relied largely on a microstimulation technique used to infer developing oculomotor commands. The logic of the technique is as follows. FEF microstimulation evokes a saccadic eye movement with a stereotyped trajectory (Robinson and Fuchs, 1969; Bruce et al., 1985). However, when microstimulation is applied after an instruction to make a voluntary eye movement but before it is executed, the resulting evoked saccade deviates in the direction of the impending, planned movement [e.g., an evoked saccade with an upward trajectory will, when evoked during the preparation of a rightward eye movement, follow a trajectory up and to the right (Schiller and Sandell, 1983)]. Accordingly, we interrupted motion viewing with FEF microstimulation and analyzed the trajectories of evoked saccades to infer planned eye movements during the time of decision formation (Gold and Shadlen, 2000, 2003).
We analyzed the evoked-saccade trajectories in terms of both the subsequent voluntary saccadic response and the sensory information used to select that response. We showed that these trajectories reflected the direction of the voluntary saccade and not simply the direction of motion, because both correct and erroneous decisions about motion direction corresponded to evoked-saccade trajectories that tended to deviate in the direction of the subsequent saccadic response. The inferred plan thus appears to reflect activity that builds up in the brain before a voluntary eye movement (Schall, 1991). However, we also showed that this purely oculomotor view is incomplete, by relating the evoked-saccade trajectories to the strength and duration of the motion evidence used to select the response. We previously showed that the oculomotor plan can also reflect patterns of choices made on previous trials, which is particularly evident early in training and when the sensory evidence is weak (Gold et al., 2008). Thus, like in trained monkeys, during training this plan appears to be related to not just the preparation and execution of the saccadic response but also its selection, hence its relationship to decision making (Gold and Shadlen, 2000, 2003).
The microstimulation technique likely reflects complex patterns of neural activity distributed across the FEF, SC, LIP, and other structures involved in the selection and preparation of saccades (Schall, 1991). Our results therefore give a broad view of oculomotor activity but require complementary techniques to understand how that activity is represented in the underlying neural circuitry. For example, single-unit recordings might help elucidate the positive and negative effects we measured in the deviation data. The positive effects are consistent with the dynamics of certain neurons in this network whose activity tends to ramp up during motion viewing in a coherence-dependent manner and ultimately encodes the direction of the saccadic response. Likewise, the negative effects are similar to certain neurons whose activity tends to ramp down during motion viewing in a coherence-dependent manner (Horwitz and Newsome, 1999; Kim and Shadlen, 1999; Roitman and Shadlen, 2002). However, those neurons tend to encode the direction opposite to the saccadic response on the given trial, which is difficult to reconcile with the evoked-saccade deviations that tended to reflect the direction of the saccadic response for both positive and negative cases. We suspect that our results reflect complex interactions of numerous subsets of oculomotor neurons including those that encode both saccade choices, the release of fixation, and the direction of the evoked saccade. More work is needed to measure the activity of those neurons during the conditions examined in this study.
A key conclusion from previous studies using both evoked saccades and single-unit recordings to study decision making in fully trained monkeys is that the relationship between perceptual decision making and saccade planning depends on the task design. In monkeys trained to indicate their direction decision with an eye movement to a target at a known location, like in this study, the perceptual decision appears to instruct directly the choice of eye-movement response and thus engages the oculomotor system, even when a delay is introduced between decision formation and response onset (Horwitz and Newsome, 1999; Kim and Shadlen, 1999; Shadlen and Newsome, 2001; Roitman and Shadlen, 2002). In contrast, in monkeys trained to indicate their decision with an eye movement to a target of a particular color but uncertain location, the monkeys cannot explicitly form the decision as a saccade plan and the oculomotor system is not similarly engaged (Gold and Shadlen, 2003). The parts of the brain engaged during decision formation thus appear to depend critically on behavioral context.
The present work extends those results in two key ways. The first is that extensive training is not necessary to engage action-oriented circuits during decision making, which occurs even as the visuomotor association is being learned. This result is important because it implies that the decision-action link is not simply a manifestation of excessive familiarity with the task, which was one possible interpretation of the previous results using well trained monkeys. Instead, once an association is established between a perceptual decision and an action, circuits that prepare the action appear to be able to have consistent access to the computations that interpret incoming sensory information to form the decision. Thus, rather than being indicative of a possible separate system for “habitual” or “intuitive” decisions used only under certain repetitive circumstances (Dayan and Balleine, 2002; Kahneman, 2002), the results suggest that action-oriented circuits might play a more general role in deliberative, goal-directed decision making associated with those actions (Shadlen et al., 2008).
The second novel result from our study is that the oculomotor commands reflect perceptual sensitivity to the stimulus. This result implies that “vision for action” and “vision for perception” might not be dissociated under these conditions. This idea is perhaps not so surprising: those terms typically refer to a dissociation between visual processing in the dorsal and ventral streams (Ungerleider and Mishkin, 1982; Goodale and Milner, 1992), whereas the motion and oculomotor processing required of this task are both thought to reside primarily in the dorsal stream (Newsome and Paré, 1988; Salzman et al., 1990; Britten et al., 1992, 1996; Shadlen and Newsome, 2001; Roitman and Shadlen, 2002). Nevertheless, our result strengthens the idea that within the dorsal stream, the information from vision used to select and guide actions is not processed separately from the information that governs perceptual sensitivity.
Our present results do not indicate where along this processing stream the changes responsible for improved motion sensitivity occur. However, a previous study implicated changes at the level of forming the direction decision from the motion evidence (Law and Gold, 2008). The middle temporal area (MT) contains direction-selective neurons thought to play a critical role in representing motion information used to perform the direction-discrimination task (Newsome and Paré, 1988; Salzman et al., 1990; Britten et al., 1992, 1996). Area LIP is part of an oculomotor network that encodes the conversion of motion information into a categorical direction judgment (Horwitz and Newsome, 1999; Kim and Shadlen, 1999; Shadlen and Newsome, 2001; Roitman and Shadlen, 2002; Hanks et al., 2006). Training-induced changes in perceptual sensitivity correspond to changes in motion-driven responses in LIP but not MT (Law and Gold, 2008). That is, perceptual sensitivity appears to be governed not by changes in how direction-tuned neurons respond to visual motion but rather how their output is interpreted to form the direction decision. Our results suggest that when decisions are associated with specific actions, improvements in perceptual sensitivity involve changes in how information from vision is used to select and guide those actions.
Such a mechanism would be a form of “embodiment” that places high-order functions like perception and learning in the context of behavioral control (Clark, 1997; O'Regan and Noë, 2001; Cisek, 2006). It contrasts dramatically with the proposal that many forms of perceptual learning involve changes in early sensory areas, like primary visual cortex, that have little direct relationship to behavioral planning (Gilbert et al., 2001). However, this idea is consistent with forms of perceptual learning thought to involve changes related to higher-order processes like decision making and associative learning (Hall, 1991; Dosher and Lu, 1999; Seitz and Watanabe, 2003). Our results suggest that neural circuits involved in action selection might represent a confluence of these processes, as learned associations with sensory input lead to the establishment and then refinement of action-oriented mechanisms that interpret the sensory input to form decisions that guide motor output.
Footnotes
This work was supported by National Eye Institute Grants EY015260 and P30 EY001583, the McKnight Foundation, the Burroughs Wellcome Fund, and the Sloan Foundation. We thank Long Ding, Ben Heasly, Jeff Schall, and Ching-Ling Teng for helpful comments and Jean Zweigle, Eric Pierce, Fred Letterio, Mike Supplick, and Andy Callahan for technical assistance.
References
- Audley RJ, Pike AR. Some alternative stochastic models of choice. Br J Math Stat Psychol. 1965;18:207–225. [Google Scholar]
- Ball K, Sekuler R. A specific and enduring improvement in visual motion discrimination. Science. 1982;218:697–698. doi: 10.1126/science.7134968. [DOI] [PubMed] [Google Scholar]
- Ball K, Sekuler R. Direction-specific improvement in motion discrimination. Vision Res. 1987;27:953–965. doi: 10.1016/0042-6989(87)90011-3. [DOI] [PubMed] [Google Scholar]
- Bogacz R, Brown E, Moehlis J, Holmes P, Cohen JD. The physics of optimal decision making: a formal analysis of models of performance in two-alternative forced choice tasks. Psychol Rev. 2006;113:700–765. doi: 10.1037/0033-295X.113.4.700. [DOI] [PubMed] [Google Scholar]
- Brainard DH. The psychophysics toolbox. Spat Vis. 1997;10:433–436. [PubMed] [Google Scholar]
- Britten KH, Shadlen MN, Newsome WT, Movshon JA. The analysis of visual motion: a comparison of neuronal and psychophysical performance. J Neurosci. 1992;12:4745–4765. doi: 10.1523/JNEUROSCI.12-12-04745.1992. [DOI] [PMC free article] [PubMed] [Google Scholar]
- Britten KH, Newsome WT, Shadlen MN, Celebrini S, Movshon JA. A relationship between behavioral choice and the visual responses of neurons in macaque MT. Vis Neurosci. 1996;13:87–100. doi: 10.1017/s095252380000715x. [DOI] [PubMed] [Google Scholar]
- Bruce CJ, Goldberg ME, Bushnell MC, Stanton GB. Primate frontal eye fields. II. Physiological and anatomical correlates of electrically evoked eye movements. J Neurophysiol. 1985;54:714–734. doi: 10.1152/jn.1985.54.3.714. [DOI] [PubMed] [Google Scholar]
- Burnham KP, Anderson DR. Model selection and multi-model inference. New York: Springer; 2004. [Google Scholar]
- Carpenter RH, Williams ML. Neural computation of log likelihood in control of saccadic eye movements. Nature. 1995;377:59–62. doi: 10.1038/377059a0. [DOI] [PubMed] [Google Scholar]
- Cisek P. Integrated neural processes for defining potential actions and deciding between them: a computational model. J Neurosci. 2006;26:9761–9770. doi: 10.1523/JNEUROSCI.5605-05.2006. [DOI] [PMC free article] [PubMed] [Google Scholar]
- Clark A. Being there: putting brain, body, and world together again. Cambridge, MA: MIT; 1997. [Google Scholar]
- Cox RW. AFNI: software for analysis and visualization of functional magnetic resonance neuroimages. Comput Biomed Res. 1996;29:162–173. doi: 10.1006/cbmr.1996.0014. [DOI] [PubMed] [Google Scholar]
- Dayan P, Balleine BW. Reward, motivation, and reinforcement learning. Neuron. 2002;36:285–298. doi: 10.1016/s0896-6273(02)00963-7. [DOI] [PubMed] [Google Scholar]
- Ditterich J. Stochastic models of decisions about motion direction: behavior and physiology. Neural Netw. 2006;19:981–1012. doi: 10.1016/j.neunet.2006.05.042. [DOI] [PubMed] [Google Scholar]
- Dosher BA, Lu ZL. Perceptual learning reflects external noise filtering and internal noise reduction through channel reweighting. Proc Natl Acad Sci U S A. 1998;95:13988–13993. doi: 10.1073/pnas.95.23.13988. [DOI] [PMC free article] [PubMed] [Google Scholar]
- Dosher BA, Lu ZL. Mechanisms of perceptual learning. Vision Res. 1999;39:3197–3221. doi: 10.1016/s0042-6989(99)00059-0. [DOI] [PubMed] [Google Scholar]
- Eckhoff P, Holmes P, Law C-T, Connolly PM, Gold JI. On diffusion processes with variable drift rates as models for decision making during learning. New J Physics. 2008;10 doi: 10.1088/1367-2630/10/1/015006. nihpa49499. [DOI] [PMC free article] [PubMed] [Google Scholar]
- Fahle M, Edelman S. Long-term learning in vernier acuity: effects of stimulus orientation, range and of feedback. Vision Res. 1993;33:397–412. doi: 10.1016/0042-6989(93)90094-d. [DOI] [PubMed] [Google Scholar]
- Felleman DJ, Van Essen DC. Distributed hierarchical processing in the primate cerebral cortex. Cereb Cortex. 1991;1:1–47. doi: 10.1093/cercor/1.1.1-a. [DOI] [PubMed] [Google Scholar]
- Gilbert CD. Early perceptual learning. Proc Natl Acad Sci U S A. 1994;91:1195–1197. doi: 10.1073/pnas.91.4.1195. [DOI] [PMC free article] [PubMed] [Google Scholar]
- Gilbert CD, Sigman M, Crist RE. The neural basis of perceptual learning. Neuron. 2001;31:681–697. doi: 10.1016/s0896-6273(01)00424-x. [DOI] [PubMed] [Google Scholar]
- Gold JI, Shadlen MN. Representation of a perceptual decision in developing oculomotor commands. Nature. 2000;404:390–394. doi: 10.1038/35006062. [DOI] [PubMed] [Google Scholar]
- Gold JI, Shadlen MN. Banburismus and the brain: decoding the relationship between sensory stimuli, decisions, and reward. Neuron. 2002;36:299–308. doi: 10.1016/s0896-6273(02)00971-6. [DOI] [PubMed] [Google Scholar]
- Gold JI, Shadlen MN. The influence of behavioral context on the representation of a perceptual decision in developing oculomotor commands. J Neurosci. 2003;23:632–651. doi: 10.1523/JNEUROSCI.23-02-00632.2003. [DOI] [PMC free article] [PubMed] [Google Scholar]
- Gold JI, Shadlen MN. The neural basis of decision making. Annu Rev Neurosci. 2007;30:535–574. doi: 10.1146/annurev.neuro.29.051605.113038. [DOI] [PubMed] [Google Scholar]
- Gold JI, Law CT, Connolly P, Bennur S. The relative influences of priors and sensory evidence on an oculomotor decision variable during perceptual learning. J Neurophysiol. 2008;100:2653–2668. doi: 10.1152/jn.90629.2008. [DOI] [PMC free article] [PubMed] [Google Scholar]
- Goldstone RL. Perceptual learning. Annu Rev Psychol. 1998;49:585–612. doi: 10.1146/annurev.psych.49.1.585. [DOI] [PubMed] [Google Scholar]
- Goodale MA, Milner AD. Separate visual pathways for perception and action. Trends Neurosci. 1992;15:20–25. doi: 10.1016/0166-2236(92)90344-8. [DOI] [PubMed] [Google Scholar]
- Graham NVS. Visual pattern analyzers. Oxford: Oxford UP; 1989. [Google Scholar]
- Green DM, Swets JA. Signal detection theory and psychophysics. New York: Wiley; 1966. [Google Scholar]
- Grossberg S, Pilly PK. Temporal dynamics of decision-making during motion perception in the visual cortex. Vision Res. 2008;48:1345–1373. doi: 10.1016/j.visres.2008.02.019. [DOI] [PubMed] [Google Scholar]
- Hall G. Perceptual and associative learning. Oxford: Oxford UP; 1991. [Google Scholar]
- Hanks TD, Ditterich J, Shadlen MN. Microstimulation of macaque area LIP affects decision-making in a motion discrimination task. Nat Neurosci. 2006;9:682–689. doi: 10.1038/nn1683. [DOI] [PMC free article] [PubMed] [Google Scholar]
- Hays AV, Richmond BJ, Optican LM. Unix-based multiple-process system for real-time data acquisition and control. WESCON Conf Proc. 1982;2:1–10. [Google Scholar]
- Horwitz GD, Newsome WT. Separate signals for target selection and movement specification in the superior colliculus. Science. 1999;284:1158–1161. doi: 10.1126/science.284.5417.1158. [DOI] [PubMed] [Google Scholar]
- Judge SJ, Richmond BJ, Chu FC. Implantation of magnetic search coils for measurement of eye position: an improved method. Vision Res. 1980;20:535–538. doi: 10.1016/0042-6989(80)90128-5. [DOI] [PubMed] [Google Scholar]
- Kahneman D. Maps of bounded rationality. In: Frangsmyr T, editor. Les Prix Nobel. Stockholm: Nobel Foundation; 2002. [Google Scholar]
- Kalwani RM, Bloy L, Elliott MA, Gold JI. A method for localizing microelectrode trajectories in the macaque brain using MRI. J Neurosci Methods. 2009;176:104–111. doi: 10.1016/j.jneumeth.2008.08.034. [DOI] [PMC free article] [PubMed] [Google Scholar]
- Karni A, Sagi D. Where practice makes perfect in texture discrimination: evidence for primary visual cortex plasticity. Proc Natl Acad Sci U S A. 1991;88:4966–4970. doi: 10.1073/pnas.88.11.4966. [DOI] [PMC free article] [PubMed] [Google Scholar]
- Kim JN, Shadlen MN. Neural correlates of a decision in the dorsolateral prefrontal cortex of the macaque. Nat Neurosci. 1999;2:176–185. doi: 10.1038/5739. [DOI] [PubMed] [Google Scholar]
- Kustov AA, Robinson DL. Shared neural control of attentional shifts and eye movements. Nature. 1996;384:74–77. doi: 10.1038/384074a0. [DOI] [PubMed] [Google Scholar]
- LaBerge DA. A recruitment theory of simple behavior. Psychometrika. 1962;27:375–396. [Google Scholar]
- Laming DRJ. Information theory of choice reaction time. New York: Wiley; 1968. [Google Scholar]
- Law CT, Gold JI. Neural correlates of perceptual learning in a sensory-motor, but not a sensory, cortical area. Nat Neurosci. 2008;11:505–513. doi: 10.1038/nn2070. [DOI] [PMC free article] [PubMed] [Google Scholar]
- Link SW. The wave theory of difference and similarity. Hillsdale, NJ: Erlbaum; 1992. [Google Scholar]
- Liu Z, Weinshall D. Mechanisms of generalization in perceptual learning. Vision Res. 2000;40:97–109. doi: 10.1016/s0042-6989(99)00140-6. [DOI] [PubMed] [Google Scholar]
- Luce RD. Response times: their role in inferring elementary mental organization. New York: Oxford UP; 1986. [Google Scholar]
- Martínez-Trujillo J, Treue S. Attentional modulation strength in cortical area MT depends on stimulus contrast. Neuron. 2002;35:365–370. doi: 10.1016/s0896-6273(02)00778-x. [DOI] [PubMed] [Google Scholar]
- Newsome WT, Paré EB. A selective impairment of motion perception following lesions of the middle temporal visual area (MT) J Neurosci. 1988;8:2201–2211. doi: 10.1523/JNEUROSCI.08-06-02201.1988. [DOI] [PMC free article] [PubMed] [Google Scholar]
- O'Regan JK, Noë A. A sensorimotor account of vision and visual consciousness. Behav Brain Sci. 2001;24:939–973. doi: 10.1017/s0140525x01000115. discussion 973–1031. [DOI] [PubMed] [Google Scholar]
- Pelli DG. The VideoToolbox software for visual psychophysics: transforming numbers into movies. Spat Vis. 1997;10:437–442. [PubMed] [Google Scholar]
- Poggio T, Fahle M, Edelman S. Fast perceptual learning in visual hyperacuity. Science. 1992;256:1018–1021. doi: 10.1126/science.1589770. [DOI] [PubMed] [Google Scholar]
- Ratcliff R, Rouder JN. Modeling response times for two-choice decisions. Psychol Sci. 1998;9:347–356. [Google Scholar]
- Ratcliff R, Smith PL. A comparison of sequential sampling models for two-choice reaction time. Psychol Rev. 2004;111:333–367. doi: 10.1037/0033-295X.111.2.333. [DOI] [PMC free article] [PubMed] [Google Scholar]
- Robinson DA. A method of measuring eye movement using a scleral search coil in a magnetic field. IEEE Trans Biomed Eng. 1963;10:137–145. doi: 10.1109/tbmel.1963.4322822. [DOI] [PubMed] [Google Scholar]
- Robinson DA, Fuchs AF. Eye movements evoked by stimulation of frontal eye fields. J Neurophysiol. 1969;32:637–648. doi: 10.1152/jn.1969.32.5.637. [DOI] [PubMed] [Google Scholar]
- Roitman JD, Shadlen MN. Response of neurons in the lateral intraparietal area during a combined visual discrimination reaction time task. J Neurosci. 2002;22:9475–9489. doi: 10.1523/JNEUROSCI.22-21-09475.2002. [DOI] [PMC free article] [PubMed] [Google Scholar]
- Salzman CD, Britten KH, Newsome WT. Cortical microstimulation influences perceptual judgements of motion direction. Nature. 1990;346:174–177. doi: 10.1038/346174a0. [DOI] [PubMed] [Google Scholar]
- Schall JD. Neural basis of saccadic eye movements in primates. In: Leventhal AG, editor. The neural basis of visual function. London: Macmillan; 1991. pp. 388–442. [Google Scholar]
- Schiller PH, Sandell JH. Interactions between visually and electrically elicited saccades before and after superior colliculus and frontal eye field ablations in the rhesus monkey. Exp Brain Res. 1983;49:381–392. doi: 10.1007/BF00238780. [DOI] [PubMed] [Google Scholar]
- Schlag J, Schlag-Rey M, Dassonville P. Interactions between natural and electrically evoked saccades. II. At what time is eye position sampled as a reference for the localization of a target? Exp Brain Res. 1989;76:548–558. doi: 10.1007/BF00248911. [DOI] [PubMed] [Google Scholar]
- Seitz AR, Watanabe T. Psychophysics: is subliminal learning really passive? Nature. 2003;422:36. doi: 10.1038/422036a. [DOI] [PubMed] [Google Scholar]
- Shadlen MN, Newsome WT. Neural basis of a perceptual decision in the parietal cortex (area LIP) of the rhesus monkey. J Neurophysiol. 2001;86:1916–1936. doi: 10.1152/jn.2001.86.4.1916. [DOI] [PubMed] [Google Scholar]
- Shadlen MN, Hanks TD, Churchland A, Kiani R, Yang T. The speed and accuracy of a simple perceptual decision: a mathematical primer. In: Doya K, Ishii S, Rao R, Pouget A, editors. Bayesian brain: probabilistic approaches to neural coding. Cambridge, MA: MIT; 2006. pp. 207–236. [Google Scholar]
- Shadlen MN, Kiani R, Hanks TD, Churchland A. Neurobiology of decision making. An intentional framework. In: Engel C, Singer W, editors. Strungmann forum report: better than conscious? Implications for performance and institutional analysis. Cambridge, MA: MIT; 2008. pp. 71–101. [Google Scholar]
- Sparks DL, Mays LE. Spatial localization of saccade targets. I. Compensation for stimulation-induced perturbations in eye position. J Neurophysiol. 1983;49:45–63. doi: 10.1152/jn.1983.49.1.45. [DOI] [PubMed] [Google Scholar]
- Tehovnik EJ, Slocum WM. Behavioural state affects saccades elicited electrically from neocortex. Neurosci Biobehav Rev. 2004;28:13–25. doi: 10.1016/j.neubiorev.2003.10.001. [DOI] [PubMed] [Google Scholar]
- Tehovnik EJ, Slocum WM, Schiller PH. Behavioural conditions affecting saccadic eye movements elicited electrically from the frontal lobes of primates. Eur J Neurosci. 1999;11:2431–2443. doi: 10.1046/j.1460-9568.1999.00665.x. [DOI] [PubMed] [Google Scholar]
- Ungerleider LG, Mishkin M. Two cortical visual systems. In: Ingle DJ, Goodale MA, Mansfield RJW, editors. Analysis of visual behavior. Cambridge, MA: MIT; 1982. pp. 549–586. [Google Scholar]
- Van Essen DC, Drury HA, Dickson J, Harwell J, Hanlon D, Anderson CH. An integrated software suite for surface-based analyses of cerebral cortex. J Am Med Inform Assoc. 2001;8:443–459. doi: 10.1136/jamia.2001.0080443. [DOI] [PMC free article] [PubMed] [Google Scholar]
- Wang XJ. Probabilistic decision making by slow reverberation in cortical circuits. Neuron. 2002;36:955–968. doi: 10.1016/s0896-6273(02)01092-9. [DOI] [PubMed] [Google Scholar]
- Watson AB. Probability summation over time. Vision Res. 1979;19:515–522. doi: 10.1016/0042-6989(79)90136-6. [DOI] [PubMed] [Google Scholar]
- Wichmann FA, Hill NJ. The psychometric function: I. Fitting, sampling, and goodness of fit. Percept Psychophys. 2001;63:1293–1313. doi: 10.3758/bf03194544. [DOI] [PubMed] [Google Scholar]