

Abstract
Purpose
We believe it is important to uncover tinnitus subgroups to identify subsets of patients most likely to benefit from different treatments. We review strategies for subgrouping based on etiology, subjective reports, the audiogram, psychoacoustics, imaging, and cluster analysis.
Method
Preliminary results of a 2-step cluster analysis based on 246 participants from whom we had 26 categorical and 25 continuous variables were determined.
Results
A 4-cluster solution suggested the following subgroups: (a) constant distressing tinnitus, (b) varying tinnitus that is worse in noise, (c) tinnitus patients who are copers and whose tinnitus is not influenced by touch (somatic modulation), and (d) tinnitus patients who are copers but whose tinnitus is worse in quiet environments.
Conclusions
Subgroups of tinnitus patients can be identified by using statistical approaches. The subgroups we identify here represent a preliminary attempt at identifying such patients. One next step would be to explore clinical trials of tinnitus treatments based on subgroup analyses or on using subgroups in the selection criteria.
Keywords: tinnitus, subgroups, cluster analysis
Tinnitus is a symptom but likely has many causes. It may be the case that any single treatment will not be effective for treating all tinnitus patients but that different treatments will be needed for different subgroups. There is a long-standing interest in the identification of these subgroups. For example, Tyler and Baker (1983) observed that some tinnitus sufferers avoided noisy situations, whereas others avoided quiet situations. They postulated that ”these contrasts may suggest two subcategories of tinnitus [patients]” (Tyler & Baker, 1983, p. 152). Tyler (1984) observed that ”psychophysical masking studies suggests there are different types of tinnitus” (p. 43).
In this article, we briefly review some possible strategies for determining tinnitus subgroups and then focus on some preliminary data from questionnaires and psychoacoustic measures using a cluster analysis.
Strategies for Subgrouping
Etiology
Many of the causes and mechanisms involved in hearing loss are likely involved in tinnitus. Some of the more common and widely accepted causes are noise, aging, medications, head injury, and Ménière's disease. Unfortunately, many of the causes of tinnitus are unknown. Stouffer and Tyler (1990) found that 23% of their male participants reported that noise exposure had likely caused their tinnitus, but 46% of the 528 tinnitus patients had no idea what might have caused their tinnitus. It may also be that the cause of tinnitus varies within these categories. For example, impulsive noise might create a different kind of tinnitus compared with tinnitus caused by continuous noise. In addition, the aging process might affect people differently. Different medications are likely to have different effects on individuals with different metabolisms, and the category of tinnitus caused by head injuries might depend on where in the brain the injury occurs.
Subjective Reports
Because tinnitus is a subjective phenomenon, the patients’ own descriptions of their problem provide valuable insights. Stouffer and Tyler (1990), for example, noted that 38% of their tinnitus patients reported hearing a ringing sound and 11% heard a buzzing sound.
We have recently (Tao et al., 2008) grouped these descriptions into the following:
tonal (including hissing, musical note, ringing, steam whistle, whistling)
noise (including buzzing, humming, roaring, rushing, whooshing)
crickets (including clicking, cricket-like)
pulsing
other
One can imagine that noise-like tinnitus might activate a large array of fibers, or that a tonal or cricket-like tinnitus might be represented by periodic activity. But patients’ descriptions of their tinnitus are likely influenced by their personal experiences, and some are not very articulate.
Audiogram
Tinnitus is closely linked to hearing loss, and some of the proposed models of tinnitus are linked to hearing loss (e.g., Salvi, Lockwood, & Burkard, 2000; Salvi, Wang, & Powers, 1996) and audiogram shape (Norena, Micheyl, Chery-Croze, & Collet, 2002). We have been exploring different audiogram shapes in tinnitus patients (Tao et al., 2008) and have identified the following shapes:
flat loss
low-frequency hearing loss
normal hearing
notch
others (shape not typical)
gradual slope loss
steep slope loss
inverted U shape
However, similar audiograms might be produced by different causes. Furthermore, it may be that hearing thresholds at octaves are insufficient to provide an adequate characterization of the details of hair cell and nerve fiber survival. It could even be the case that hearing thresholds below 125 Hz and above 8000 Hz are helpful.
Psychoacoustics
We have suggested for some time that detailed psychoacoustic studies should provide an important basis for identifying subgroups (e.g., Tyler, Babin, & Niebuhr, 1984; Tyler, 2000).
Some potential leads for psychoacoustic-based subgroups are (a) tonal masking patterns (Feldmann, 1971; Formby & Gjerdingen, 1980; Tyler & Conrad-Armes, 1984); (b) ipsilateral and contralateral masking (Henry, Fausti, Flick, Helt, & Ellingson, 2000; Tyler, Kuk, & Mims, 1987); (c) postmasking effects of level and duration (Feldmann, 1971; Tyler Babin, & Niebuhr, 1984; Vernon & Meikle, 1988); (d) contralateral postmasking (Tyler, Conrad-Armes, & Smith, 1984); and (e) adaptation of masking (Penner & Bilger, 1995; Penner, Brauth, & Hood, 1981).
Imaging
Obtaining ”images” of the auditory area and related systems might also help to understand different subgroups of tinnitus patients. Researchers have used magnetoencephalography (e.g., Weisz, Moratti, Meinzer, Dohrnann, & Elbert, 2005), event-related potentials (Jacobson et al., 1991; Muhlnickel, Elbert, Taub, & Flor, 1998; Weisz, Voss, Berg, & Elbert, 2004), magnetic resonance imaging (De Ridder, De Mulder, Menovsky, Sunaert, & Kovacs, 2007; Melcher, Sigalovsly, Guinan, & Levine, 2000; Muhlau et al., 2006), and positron emission tomography (Arnold, Bartenstein, Oestreicher, Romer, & Schwaiger, 1996; Lockwood, Salvi, & Burkard, 2001; Lockwood et al., 1998; Reyes et al., 2002). Unfortunately, only a few of these studies have used hearing impaired controls. It is unclear whether differences between the images from tinnitus and control groups are attributable to tinnitus or to hearing loss. It is important that any approach to modify the tinnitus (to create a tinnitus and nontinnitus condition within the same patient) does not also change the image itself.
Cluster Analysis
Yet another approach to finding subgroups involves many measurements and a statistical analysis called cluster analysis. Cluster analysis is an approach to identify homogeneous subgroups from a set of common variables without making presumptions about what variables are important. Generally, measurements are made from a large number of participants, and the analysis attempts to group those participants that perform similarly.
Preliminary Results of Cluster Analysis
We have performed a cluster analysis on patients enrolled in some clinical trials at the University of Iowa. Some of the variables that were included were (a) the Tinnitus Handicap Questionnaire (Kuk, Tyler, Russell, & Jordan, 1990); (b) the Tinnitus Activities Questionnaire (Tyler, Gehringer, et al., 2006); (c) portions of the Tinnitus Intake Questionnaire (Stouffer & Tyler, 1990); (d) biographical variables; and (e) psychoacoustic tinnitus measurements (pitch and loudness matching).
We have found that the Tinnitus Handicap Questionnaire and the Tinnitus Activities Questionnaire are particularly helpful because they are scored on a 0−100 ordinal scale (Tyler, Oleson, Noble, Coelho, & Ji, 2007). They therefore have advantages over questionnaires that use only a 3-point scale, such as the Tinnitus Handicap Inventory (Newman, Jacobson, & Spitzer, 1996). Because we use the Tinnitus Handicap and Tinnitus Activities Questionnaire, we include in our analysis some responses to individual questions. Other behavioral tests, such as measuring postmasking effects and tonal masking patterns, might be additionally helpful. We did not have data on a sufficient number of patients, and therefore they could not be utilized in the cluster analysis.
Prliminary Cluster Analysis
Data were reviewed from 246 participants, from whom we had 26 categorical and 25 continuous variables. The analysis was conducted using a two-step cluster method (SPSS Version 15.0) because it accepts continuous and categorical variables. We prespecified four, five, and six clusters, and show results here for a four-subgroup solution as it resulted in about equal numbers in each subgroup (n 44, 37, 40, and 32, respectively). We had to exclude 93 participants due to missing data, resulting in an analysis performed on 153 patients.
We highlight some of the results from the categorical variables and show ”clusterwise importance” and responses within clusters. Thirteen of 26 categorical variables and 19 of 25 continuous variables were significant.
Table 1 shows the output from the cluster analysis for the continuous variables. Each row shows a continuous variable and the average scores for this variable in each of the four clusters. For example, the average loudness rating for the four subgroups was 83%, 67%, 66%, and 68%, respectively. Therefore, those patients who were assigned to Cluster 1 reported a higher tinnitus loudness measure.
Table 1.
Variable scores (means and standard deviations) for each of the four profiles and for the total group (n = 246).
| Cluster |
||||||
|---|---|---|---|---|---|---|
| 1 | 2 | 3 | 4 | Combined | ||
| Age (years) | M | 54.2 | 55.6 | 58.7 | 54.9 | 55.9 |
| SD | 10.8 | 10.6 | 10.3 | 9.4 | 10.4 | |
| Many everyday sounds are unbearably loud to me. | M | 60.6 | 49.5 | 15.9 | 14.1 | 36.5 |
| SD | 36.5 | 35.0 | 22.8 | 22.8 | 36.5 | |
| Sounds that others believe are moderately loud are too loud to me. | M | 63.2 | 56.8 | 19.3 | 18.6 | 40.8 |
| SD | 35.8 | 31.8 | 25.2 | 25.1 | 36.4 | |
| I hear very soft sounds that others with normal hearing do not hear. | M | 21.9 | 15.5 | 7.4 | 15.3 | 15.2 |
| SD | 32.7 | 30.8 | 21.4 | 26.1 | 28.5 | |
| Describe the most prominent PITCH of your tinnitus by using a scale from 1 to 10. | M | 8.6 | 7.9 | 7.6 | 8.1 | 8.1 |
| SD | 1.7 | 1.9 | 2.3 | 1.1 | 1.9 | |
| Describe the LOUDNESS of your tinnitus by using a scale from 1 to 100. | M | 83.2 | 66.6 | 65.6 | 68.0 | 71.4 |
| SD | 18.3 | 19.2 | 25.4 | 15.7 | 21.3 | |
| During the time you are awake, what percentage of the time is your tinnitus present? | M | 96.7 | 91.2 | 91.8 | 91.7 | 92.8 |
| SD | 9.3 | 20.2 | 17.3 | 18.8 | 16.6 | |
| On the average, how many days per month are you bothered by tinnitus? | M | 29.3 | 25.5 | 28.5 | 25.3 | 27.3 |
| SD | 3.4 | 8.9 | 4.5 | 8.7 | 6.8 | |
| How many months have you had tinnitus? | M | 114.2 | 141.2 | 141.4 | 127.2 | 130.5 |
| SD | 121.3 | 193.12 | 156.2 | 170.8 | 159.2 | |
| Pitch average (Hz) | M | 4957.4 | 4774.8 | 4962.5 | 4834.7 | 4888.9 |
| SD | 2845.9 | 2949.2 | 2968.5 | 2602.1 | 2828.4 | |
| Loudness match (dB HL) | M | 56.1 | 47.4 | 52.3 | 40.4 | 49.7 |
| SD | 16.2 | 17.8 | 14.3 | 11.2 | 16.2 | |
| Sensation level of loudness match (loudness match – threshold) | M | 31.2 | 25.0 | 30.7 | 21.2 | 27.5 |
| SD | 16.4 | 15.3 | 15.7 | 8.3 | 15.0 | |
| Iowa Tinnitus Handicap Questionnaire | M | 67.1 | 50.7 | 34.3 | 36.5 | 48.1 |
| SD | 11.3 | 15.5 | 15.4 | 12.8 | 19.3 | |
| Iowa Tinnitus Handicap Questionnaire (THQ) Factor 1 | M | 68.8 | 46.3 | 28.2 | 33.8 | 45.4 |
| SD | 15.1 | 21.0 | 19.8 | 17.2 | 24.3 | |
| Iowa Tinnitus Handicap Questionnaire (THQ) Factor 2 | M | 64.4 | 54.6 | 35.2 | 31.7 | 47.6 |
| SD | 22.7 | 20.6 | 23.0 | 18.1 | 25.2 | |
| Trait Anxiety Questionnaire (20−80) | M | 49.6 | 42.9 | 33.8 | 35.3 | 40.8 |
| SD | 11.3 | 9.7 | 8.2 | 7.3 | 11.4 | |
| Iowa Tinnitus Activities Questionnaire (Concentration subscale) | M | 80.2 | 46.8 | 33.6 | 42.3 | 52.0 |
| SD | 13.4 | 24.0 | 25.9 | 20.7 | 28.2 | |
| Iowa Tinnitus Activities Questionnaire (Emotional subscale) | M | 81.1 | 65.0 | 44.7 | 56.8 | 62.6 |
| SD | 18.5 | 22.6 | 21.9 | 20.8 | 24.9 | |
| Iowa Tinnitus Activities Questionnaire (Hearing subscale) | M | 74.5 | 58.5 | 44.6 | 49.1 | 57.5 |
| SD | 22.2 | 23.9 | 23.8 | 27.8 | 26.8 | |
| Iowa Tinnitus Activities Questionnaire (Sleep subscale) | M | 72.5 | 36.4 | 31.4 | 31.6 | 44.5 |
| SD | 26.7 | 33.0 | 30.2 | 32.7 | 35.2 | |
| Iowa Tinnitus Activities Questionnaire (overall score) | M | 77.1 | 51.7 | 38.6 | 44.9 | 54.1 |
| SD | 11.9 | 19.6 | 17.6 | 15.5 | 22.2 | |
| Beck Depression Inventory Questionnaire (0−59) | M | 15.6 | 8.4 | 5.2 | 4.8 | 8.9 |
| SD | 8.3 | 6.1 | 4.3 | 3.2 | 7.4 | |
| Recent Life Change Questionnaire (0−3,545) | M | 279.5 | 218.1 | 112.3 | 196.5 | 203.6 |
| SD | 227.9 | 171.6 | 111.9 | 156.4 | 183.8 | |
| Somatic Perception (0−39) | M | 10.0 | 5.5 | 3.6 | 3.0 | 5.8 |
| SD | 6.9 | 4.5 | 3.8 | 2.6 | 5.6 | |
Note. Unless otherwise noted, the scales go from 0 to 100.
We next show examples of detailed responses for each of the clusters.
Cluster 1
Figure 1 shows results from the request to ”Rate the loudness of your tinnitus on a scale from I to 100.” The bottom indicates the average loudness rating for each of the four clusters. It can be seen that Cluster 1 patients have higher loudness ratings. The overall mean of 71% averaged across all participants is also shown. The top panel indicates the statistical significance (using Student's t test with a significance level of .05). Overall, the loudness assigned by tinnitus patients varies across a wide continuum. In this preliminary study, only those in Cluster 1 showed a loudness score that was highly significant.
Figure 1.
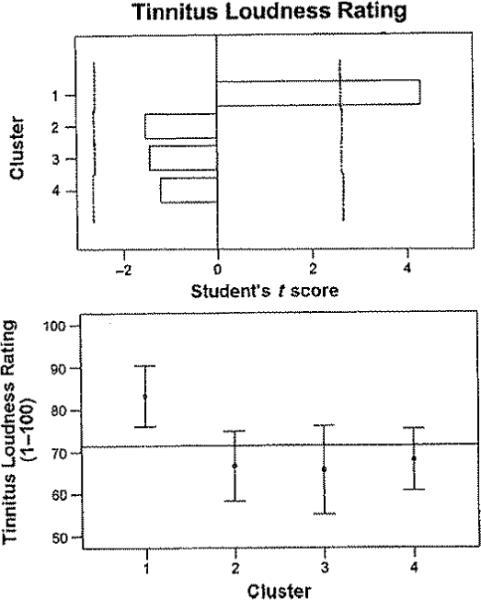
Cluster results for the question regarding tinnitus loudness (1%-100%). The bottom panel shows the mean scores and standard deviations for each of the clusters. The horizontal line depicts the mean for all participants. The top panel plots the Student t scores for each of the clusters. The significance levels (p < .05; Bonferroni adjustment applied) are shown with vertical dashed lines.
Figure 2 shows results from the Emotional subscale of the Tinnitus Activities Questionnaire (Tyler, Gehringer, et al., 2006). In the bottom panel, the average score for Cluster 1 patients was over 80%, which was statistically significant (see top panel). Those participants in Cluster 3 had a significantly lower score than the other participants (about 45%).
Figure 2.

Cluster results for the Emotional subscale of the Tinnitus Activities Questionnaire (see Figure 1 for details of graphing clusters based on continuous variables).
Patients assigned by the analysis to Clusters 3 and 4 had very similar scores on the Tinnitus Handicap and Tinnitus Activities Questionnaire. Their scores were significantly lower than those patients assigned to the other clusters and are therefore referred to as ”copers” (see below). Cluster 1 patients had higher scores than those in Cluster 2, and we therefore included ”distressed” as a label for Cluster 1.
Figure 3 shows results from the Sleep subscale of the Tinnitus Activities Questionnaire. In the bottom panel, the average score of about 77% for Cluster 1 patients was significantly higher than for the other clusters (see top panel).
Figure 3.

Cluster results for the Sleep subscale of the Tinnitus Activities Questionnaire (see Figure 1 for details of graphing clusters based on continuous variables).
Figure 4 shows results from the Concentration subscale of the Tinnitus Activities Questionnaire. In the bottom panel, Cluster 1 patients report concentration difficulties of about 80%, which is significantly higher than for the other clusters (see top panel).
Figure 4.

Cluster results for the Concentration subscale of the Tinnitus Activities Questionnaire (see Figure 1 for details of graphing clusters based on continuous variables).
Combining the results from these figures and from Table 1, we suggest that Cluster 1 patients have (a) loud tinnitus; (b) loudness hyperacusis; (c) a tinnitus that is present all day, everyday; (d) the highest Tinnitus Handicap and Tinnitus Activities Questionnaire scores; (e) the highest anxiety and depression scores; and (f) the highest emotional, sleep, hearing, and concentration scores on the Tinnitus Activities Questionnaire. Thus, it appears that Cluster 1 represents patients who have loud, persistent, and distressing tinnitus, and who suffer from loudness hyperacusis.
Cluster 2
Figure 5 shows results from the question to patients regarding whether the pitch of their tinnitus varied. In the bottom panel, Cluster 2 patients were the only ones who were more likely to report yes to this question, and their responses were statistically signficantly different from scores represented in any of the other clusters (using a chi-square test to see how much the distribution within each cluster differs from what would be expected). The dashed lines in the top panel represent tie significant differences. Combining the results from this figure and from Table 1, we suggest that for Cluster 2 patients (a) pitch and loudness vary, (b) noise makes it worse, and (c) relaxation helps somewhat. Thus, it appears that Cluster 2 represents patients whose tinnitus varies in pitch and loudness, and whose tinnitus is worse in noise.
Figure 5.

Cluster results for the question to patients regarding whether their tinnitus pitch varied from day to day; yes or no (categorical variable). The bottom panel shows the percentage of participants who responded yes or no for each of the clusters and in all patients combined. The top panel plots the chi-square scores for each of the clusters. The significance levels (p < .05; Bonferroni adjustment applied) are shown with vertical dashed lines.
Cluster 3
Figure 6 shows results from the question to patients regarding whether touch or movement in the head or neck region or their hands or arms influenced their tinnits. Over 90% of patients assigned to Cluster 3 responded no to this question, and none responded positively. A tentative observation is that Cluster 2 patients had the highest proportion of patients who responded yes, that touch or movement did affect their tinnitus (over 60%). However, most of the patients in Cluster 2 did not have their tinnitus modulated by touch or movement. Note that over 80% of the entire sample indicated that touching or movement did not change their tinnitus. Combining the results from this figure and from Table 1, we suggest that Cluster 3 patients (a) have the lowest scores on the Tinmitus Handicap and Tinnitus Activities Questionnaires; (b) have no loudniess hyperacusis; (c) have had no recent life changes; (d) do not have too much stress; and (e) do not have their tinnitus changed by touching or movement. Thus, it appears that Cluster 3 represents patients who are not too distressed by their tinnitus. They do not have loudness hyperacusis, and their tinnitus is not influenced by touch.
Figure 6.
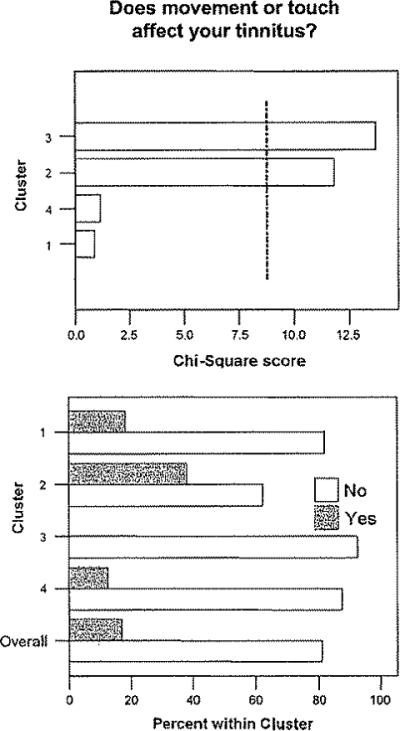
Cluster results for the question regarding whether touch or movement in the head or neck region or hands or arms influenced tinnitus (see Figure 5 for details of graphing clusters based on categorical variables).
Cluster 4
Figure 7 shows results from the question to patients regarding whether being in a quiet place made their tinnitus worse. In the bottom panel, almost 100% of patients in Cluster 4 responded yes. Most patients assigned to Clusters 2 and 3 responded no to this question. These observations were all statistically significant.
Figure 7.

Cluster results for the question regarding whether being in a quiet place made the tinnitus worse (see Figure 5 for details of graphing clusters based on categorical variables).
Figure 8 shows results from the question regarding whether being in a noisy place reduced their tinnitus. In the bottom panel, about 80% of patients in Cluster 4 said yes. In contrast, for patients who fell into Cluster 2, 100% said no. Note that when all the responses of all the patients in the study are combined (ignoring the clusters), about 80% of patients said no to this question. Noteworthy for Cluster 4 is (a) being in a quiet environment makes their tinnitus worse; (b) noise reduces their tinnitus; (c) they do not have loudness hyperacusis; (d) they experience low anxiety; (e) many things make their tinnitus better; and (f) they report a soft tinnitus loudness. Thus, it appears that Cluster 4 represents patients whose tinnitus is worse in quiet and better in noise. They report a soft tinnitus loudness and are not too distressed by their tinnitus.
Figure 8.

Cluster results for the question regarding whether being in a noisy place reduced the tinnitus (see Figure 5 for details of graphing clusters based on categorical variables).
Contrasting Clusters
The Appendix provides an overall summary of some of the main features of the clusters. It does appear that this initial cluster analysis produced four distinct groups. Some of the main factors that seem to distinguish groups include the loudness of the tinnitus, whether it varies, how it is influenced by background noise or quiet, and the amount of distress experienced by patients.
Possible Applications of Cluster Analysis
There are several possible applications of this cluster analysis and of approaches to tinnitus subgrouping. These include the following:
Designing clinical trials for a single subgroup instead of all tinnitus patients
Analyzing a large amount of data of heterogeneous tinnitus patients based on subgroups
Using subgroups to search for clues for the mechanism; for example, there might be a common modifier gene for a depression subgroup (Tyler, Coelho, & Noble, 2006)
Identifying subgroups (e.g., those most distressed) who might require more specific collaborative counseling and sound therapy, such as Tinnitus Activities Treatment (Tyler, Gehringer, et al., 2006)
Understanding specific effects of treatment by monitoring changes in clusters following a treatment
Summary
We continue to believe that identifying subgroups is necessary to find appropriate treatments (Tyler, 1992). We have reviewed several approaches to define and discover subgroups. We also present a preliminary cluster analysis approach intended to identify possible subgroups Our intent was not to propose these as the subgroups but only to demonstrate the potential importance of the technique. As a preliminary step, our analysis suggests the following four subgroups of tinnitus patients:
Constant distressing tinnitus
Varying tinnitus that is worse in noise
Tinnitus patients who are copers and whose tinnitus is not influenced by touch
Tinnitus patients who are copers and whose tinnitus is worse in quiet environments
It is possible, perhaps likely, that a patient falling within a particular subgroup might change over time. For example, it might be that the tinnitus magnitude (as measured by its loudness) does not change over time, but the reactions to the tinnitus do. Tyler and Baker (1983) observed that the number of problems identified by tinnitus patients decreased since the time of tinnitus onset. It might also be that the central neurophysiological representation of tinnitus changes with time. When imaging studies are included in such an analysis, the brain regions activated might change over time.
One intriguing and dramatic distinction among tinnitus patients is the difference reported on the effect of background noise. Noise makes tinnitus worse for some patients but reduces tinnitus for others (see Stouffer & Tyler, 1990; Tyler & Baker, 1983). This might represent a fundamental difference in the neural mechanisms underlying tinnitus and an opportunity for different treatment approaches.
Acknowledgments
This research was supported in part by National Institutes on Deafness and Other Communication Disorders Grant R01 DC005972-01A1.
Appendix
Descriptions of Four Subgroups Based on Preliminary Cluster Analysis
| Cluster 1 | Cluster 2 | Cluster 3 | Cluster 4 |
|---|---|---|---|
| Constant distressing tinnitus •Loud tinnitus •Loudness hyperacusis •Present all day, everyday •The highest Tinnitus Handicap and Tinnitus Activities Questionnaire •The highest anxiety and depression scores •Highest emotional, sleep, hearing, and concentration difficulty on Tinnitus Activities Questionnaire |
Varying tinnitus that is worse in noise •Pitch and loudness varies •Noise makes it worse •Relaxation helps somewhat |
Tinnitus patients who are copers and whose tinnitus is not influenced by touch •The lowest scores on Tinnitus Handicap and Tinnitus Activities Questionnaire •No loudness hyperacusis •No recent life changes •Stress not so bad •Touching or movement does not change their tinnitus |
Tinnitus patients who are copers and whose tinnitus is worse in quiet •Being in quiet makes their tinnitus worse •Noise reduces their tinnitus •They do not have loudness hyperacusis •They experience low anxiety •Many things make their tinnitus better •They report a soft tinnitus loudness |
Footnotes
Disclosure Statement
The first author is a consultant for Neuromonics, Inc.
References
- Arnold W, Bartenstein P, Oestreicher E, Romer W, Schwaiger M. Focal metabolic activation in the predominant left auditory cortex in patients suffering from tinnitus: A PET study with [18F]deoxyglucose. ORL; Journal for Oto-Rhino-Laryngology and Its Related Specialties. 1996;58(4):195–199. doi: 10.1159/000276835. [DOI] [PubMed] [Google Scholar]
- De Ridder D, De Mulder G, Menovsky T, Sunaert S, Kovacs S. Electrical stimulation of auditory and somatosensory cortices for treatment of tinnitus and pain. In: Langguth B, Hajak G, Kleinjung T, Cacace A, Moller AR, editors. Progress in brain research: Tinnitus: Pathophysiology and treatment. Elsevier; Amsterdam: 2007. pp. 377–388. [DOI] [PubMed] [Google Scholar]
- Feldmann H. Homolateral and contmralateral masking of tinnitus by noise-bands and by pure tones. Audiology. 1971;10(3):138–144. doi: 10.3109/00206097109072551. [DOI] [PubMed] [Google Scholar]
- Formby C, Gjerdingen DB. Pure-tone masking of tinnitus. Audiology. 1980;19:519–535. doi: 10.3109/00206098009070083. [DOI] [PubMed] [Google Scholar]
- Henry JA, Fausti SA, Flick CL, Helt WJ, Ellingson RM. Computer-automated clinical technique for tinnitus quantification. American Journal of Audiology. 2000;9:36–49. doi: 10.1044/1059-0889(2000/002). [DOI] [PubMed] [Google Scholar]
- Jacobson GP, Abmad BK, Moran J, Newman CW, Tepley N, Wharton J. Auditory evoked cortical magnetic field (M1OO-M200) measurements in tinnitus and normal groups. Hearing Research. 1991;56(1−2):44–52. doi: 10.1016/0378-5955(91)90152-y. [DOI] [PubMed] [Google Scholar]
- Kuk FK, Tyler RS, Russell D, Jordan H. The psychometric properties of a tinnitus handicap questionnaire. Ear and Hearing. 1990;11:434–445. doi: 10.1097/00003446-199012000-00005. [DOI] [PubMed] [Google Scholar]
- Lockwood AH, Salvi RJ, Burkard RF. Tinnitus and the performer. Medical Problems of Performing Artists. 2001;16(4):133–135. [Google Scholar]
- Lockwood AH, Salvi RJ, Coad ML, Towsley ML, Wack DS, Murphy BW. The functional neuroanatomy of tinnitus: Evidence for limbic system links and neural plasticity. Neurology. 1998;50(1):114–120. doi: 10.1212/wnl.50.1.114. [DOI] [PubMed] [Google Scholar]
- Melcher JR, Sigalovsky IS, Guinan JJ, Jr., Levine RA. Lateralized tinnitus studied with functional magnetic resonance imaging: Abnormal inferior colliculus activation. Journal of Neurophysiology. 2000;83:1058–1072. doi: 10.1152/jn.2000.83.2.1058. [DOI] [PubMed] [Google Scholar]
- Muhlau M, Rauschecker JP, Oestreicher E, Gaser C, Rottinger M, Wobhschlager AM, et al. Structural brain changes in tinnitus. Cerebral Cortex. 2006;16:1283–1288. doi: 10.1093/cercor/bhj070. [DOI] [PubMed] [Google Scholar]
- Muhlnickel W, Elbert T, Taub E, Flor H. Reorganization of auditory cortex in tinnitus. Proceedings of the National Academy of Sciences, USA. 1998;95:10340–10343. doi: 10.1073/pnas.95.17.10340. [DOI] [PMC free article] [PubMed] [Google Scholar]
- Newman CW, Jacobson GP, Spitzer JB. Development of the Tinnitus Handicap Inventory. Archives of Otolaiyngology—Head & Neck Surgery. 1996;122:143–148. doi: 10.1001/archotol.1996.01890140029007. [DOI] [PubMed] [Google Scholar]
- Norena A, Micheyl C, Chery-Croze S, Collet L. Psychoacoustic characterization of the tinnitus spectrum: Implications for the underlyig mechanisms of tinnitus. Audiology & Neurootology. 2002;7:358–369. doi: 10.1159/000066156. [DOI] [PubMed] [Google Scholar]
- Penner MJ, Bilger RC. Psychophysical observations and the origin of tinnitus. In: Vernon JA, Moller AR, editors. Mechanisms of tinnitus. Allyn & Bacon; Needham Heights, MA: 1995. pp. 219–230. [Google Scholar]
- Penner MJ, Brauth S, Hood L. The temporal course of the masking of tinnitus as a basis for inferring its origin. Journal of Speech and Hearing Research. 1981;24:257–261. doi: 10.1044/jshr.2402.257. [DOI] [PubMed] [Google Scholar]
- Reyes SA, Salvi RJ, Burkard RF, Coad ML, Wack DS, Galantowicz PJ, et al. Brain imaging of the effects of lidocaine on tinnitus. Hearing Research. 2002;171(1−2):43–50. doi: 10.1016/s0378-5955(02)00346-5. [DOI] [PubMed] [Google Scholar]
- Salvi RJ, Lockwood A, Burkard R. Neural plasticity and tinnitus. In: Tyler RS, editor. Tinnitus handbook. Singular; San Diego, CA: 2000. pp. 123–148. [Google Scholar]
- Salvi RJ, Wang J, Powers NL. Plasticity and reorganization in the auditory brainstem: Implications for tinnitus.. In: Reich GE, Vernon JA, editors. Proceedings of the Fifth International Tinnitus Seminar; Portland, OR: American Tinnitus Association; 1996. pp. 457–466. [Google Scholar]
- Stouffer JL, Tyler RS. Characterization of tinnitus by tinnitus patients. Journal of Speech and Hearing Disorders. 1990;55:439–453. doi: 10.1044/jshd.5503.439. [DOI] [PubMed] [Google Scholar]
- Tao P, Tyler RS, Haihong J, Coelho C, Gehringer AK, Gogel SA. The relationship between tinnitus pitch and audiogramin. 2008 doi: 10.1080/14992020802581974. Manuscript submitted for publication. [DOI] [PubMed] [Google Scholar]
- Tyler RS. Does tinnitus originate from hyperactive nerve fibers in the cochlea? In Tinnitus: Proceedings of the II International Tinnitus Seminar. The Journal of Laryngology and Otology Supplement. 1984;9:38–44. [Google Scholar]
- Tyler RS. Evaluation of tinnitus treatments.. In: Aran JM, Dauman R, editors. Tinnitus 91: Proceedings of the Fourth International Tinnitus Seminar; Bordeaux, France. August 27−30, 1991; Amsterdam: Kugler; 1992. pp. 551–554. [Google Scholar]
- Tyler RS. The psychoacoustical measurement of tinnitus. In: Tyler RS, editor. Tinnitus handbook. Singular; San Diego, CA: 2000. pp. 149–179. [Google Scholar]
- Tyler RS, Babin RW, Niebuhr D. Some observations on the masking and post-masking effects of tinnitus. The Journal of Laryngology and Otology Supplement. 1984;9:150–156. [Google Scholar]
- Tyler RS, Baker LJ. Difficulties experienced by tinnitus sufferers. Journal of Speech and Hearing Disorders. 1983;48:150–154. doi: 10.1044/jshd.4802.150. [DOI] [PubMed] [Google Scholar]
- Tyler RS, Coelho C, Noble W. Tinnitus: Standard of care, personality differences, genetic factors. ORL; Journal for Oto-Rhino-Laryngology and Its Related Specialties. 2006;68(1):14–19. doi: 10.1159/000090486. discussion 20−22. [DOI] [PubMed] [Google Scholar]
- Tyler RS, Conrad-Armes D. Masking of tinnitus compared to masking of pure tones. Journal of Speech and Hearing Research. 1984;27:106–111. doi: 10.1044/jshr.2701.106. [DOI] [PubMed] [Google Scholar]
- Tyler RS, Conrad-Armes D, Smith PA. Postmasking effects of sensorineural tinnitus: A preliminary investigation. Journal of Speech and Hearing Research. 1984;27:466–474. doi: 10.1044/jshr.2703.466. [DOI] [PubMed] [Google Scholar]
- Tyler RS, Gehringer AK, Noble W, Dunn CC, Witt SA, Bardia A. Tinnitus activities treatment. In: Tyler RS, editor. Tinnitus treatment: Clinical protocols. Thieme; New York: 2006. pp. 116–131. [Google Scholar]
- Tyler RS, Kuk FK, Mims LA. Ipsilateral and contralateral postmasking recovery of tinnitus.. In: Feldmann H, editor. Proceedings of the Third International Tinnitus Seminar; Münster, West Germany. June 11−13, 1987; Karlsruhe, West Germany: Harsch Verlag; 1987. pp. 275–279. [Google Scholar]
- Tyler RS, Oleson J, Noble W, Coelho C, Ji H. Clinical trials for tinnitus: Study populations, designs, measurement variables, and data analysis. Progress in Brain Research. 2007;166:499–509. doi: 10.1016/S0079-6123(07)66048-8. [DOI] [PubMed] [Google Scholar]
- Vernon JA, Meikle MB. Measurement of tinnitus: An update. In: Kitahara M, editor. Tinnitus: Pathophysiology and management. Igaku-Shoin; Tokyo: 1988. pp. 36–52. [Google Scholar]
- Weisz N, Moratti S, Meinzer M, Dohrmann K, Elbert T. Tinnitus perception and distress is related to abnormal spontaneous brain activity as measured by magnetoencephalography. PLoS Medicine. 2005;2(6):e153. doi: 10.1371/journal.pmed.0020153. [DOI] [PMC free article] [PubMed] [Google Scholar]
- Weisz N, Voss S, Berg P, Elbert T. Abnormal auditory mismatch response in tinnitus sufferers with high-frequency hearing loss is associated with spbjective distress level. BMC Neurosciece. 2004;5:8. doi: 10.1186/1471-2202-5-8. [DOI] [PMC free article] [PubMed] [Google Scholar]