Abstract
Digital autoradiography (DAR) is a powerful method to determine quantitatively the “small-scale” (i.e., submillimeter) distribution of a radiotracer within a tissue section. However, the limited spatial resolution of the DAR image, due to blurring by the point spread function (PSF), can result in a poor correlation with tissue histology and immunohistochemistry. The authors attempt to overcome this limitation by recovering the radiotracer distribution by image deconvolution using the Richardson-Lucy algorithm and a measured PSF obtained from a small radioactive source on hydrophobic microscope slide. Simulation studies have shown that the deconvolution algorithm reliably recovers the pixel values corresponding to the radioactivity distributions. As an example, the proposed image restoration approach has been tested with DAR images of different radiolabeled markers on tumor sections obtained from clinical and preclinical animal model studies. Digital autoradiograms following deconvolution show improved sharpness and contrast relative to the unprocessed autoradiograms.
Keywords: digital autoradiography, image deconvolution, imaging plate, point spread function, Richardson-Lucy algorithm
I. INTRODUCTION
Phosphor imaging plate-based1,2 digital autoradiography (DAR) is increasingly replacing traditional film-based methods of autoradiography. The main reasons for this tendency are: (1) the linear dose response of imaging plates versus the “Hurter and Driffield” response of film; (2) a greater dynamic range—5 versus 2.5 orders of magnitude—than film, reducing the likelihood of image saturation; (3) greater sensitivity and therefore shorter sample exposure lengths; and (4) electronic, instead of hardcopy, images. However, the phosphor plate media have a notable disadvantage of poor spatial resolution, resulting from the broad point spread function (PSF) of the imaging plate and the laser readout scanner.
Image blurring exists in all DAR images, a potentially substantial limitation in studying the microscopic details of radiotracer distributions in tissue specimens and it was ap-preciated shortly after the initial applications of imaging plates. Hillen et al. studied the modulation transfer function of a phosphor storage system for digital projection autoradiography.3 Marshall and Pickering established analytic formulas of image spread from extended radiation sources and developed an algorithm for image deconvolution using Fourier transforms; however, their work was limited to a simulated autoradiographic image of a disk source.4 Goyette et al. measured the PSF of commercial 51Cr micro-spheres on x-ray film and restored charge-coupled device (CCD) images of the film using a Bayesian restoration approach.5 Wells et al. described a method to image radioactivity distribution across tissue sections using a CCD sensor at close distance and also developed a technique to measure the PSF using isotope-coated thin fibers.6 Despite these pilot works and increasing demands of quantitative autoradiographic image analysis, it is perhaps surprising that image restoration (i.e., resolution recovery) has not been pursued further and applied more widely among users of DAR. This might be partly due to the complexity and tedium of measuring the isotope-dependent PSF. In this article, we present a method of calculating the PSF from small radioactive sources and explore the potential of image deconvolution techniques to improve the spatial resolution of the phosphor plate digital image.
I.A. Digital phosphor plates
Digital autoradiography is based on the phosphor imaging plate, a two-dimensional (2D) radiation detection and recording medium. Similar to x-ray film, the imaging plate is thin and pliable, but its active component is a thin layer of photostimulable phosphor powder deposited on a polyester support layer and coated by an inert protective layer. The phosphor used for the imaging plate is usually a BaFX:Eu2+ compound, where X is chlorine, bromine, or iodine.1 When radiation energy is deposited in the phosphor crystals, it is transferred to a number of Eu2+ sites. The Eu2+ cation is then oxidized to Eu3+ and a photoelectron is excited into the conduction band of the crystal. The photoelectron is trapped in a lattice defect produced by the absence of a halogen counter ion; these vacancies are created during imaging plate manufacture and are termed “F centers.”7 The electrons trapped by the F centers are in metastable states and collectively constitute the acquired image. The image thus recorded is, however, not directly visible and is a “latent image.” The latent image is readout by an image reader that scans the imaging plate with small focal-spot red laser. The photostimulated light from the imaging plate is collected by a photomultiplier tube and is then converted to a digital image. The DAR image intensity is measured as a dimensionless quantity, photostimulated luminescence (PSL). Studies have shown that the PSL is linearly proportional to radiation dose and the dynamic range of such an imaging plate spans at least five orders of magnitude.7,8
I.B. DAR image blurring
During a DAR exposure, the phosphor at each location X is irradiated resulting in a DAR image I(X), which is a twodimensional map of radiation energy deposition resulting from the activity distribution A(X’) within the specimen. In this article, X and X’ are used to denote the 2D coordinates of the phosphor layer and the autoradiographic samples, respectively; in ordinary DAR settings the phosphor layer and the specimens are typically tens of microns apart. Similar to many other imaging systems, the point spread function has a strong influence on the visual appearance of DAR images. An imaging plate differs from other optical systems in that the solid angle subtended at the samples by the imaging plate is almost 2π; therefore, the PSF of the imaging plate is the result of the isotropic radiation emissions of the radionuclide in close proximity to the detector screen. The PSF for digital autoradiography results from a combination of the dispersion of the energy deposited in the phosphor plate and the finite dimensions of focal spot of the readout laser. Because the radiation emissions vary from isotope to isotope, the PSF is in general isotope specific and must be measured individually for the isotopes of interest.
The PSF degrades the contrast and overall quality of the images of radiotracer distributions. Almost any radionuclide with a reasonably long half-life may be used for autoradiography, e.g., 3H, 14C, 125I, 18F, and 124I. The higher resolution autoradiograms are obtained with radioisotopes such as 3H and 14C that emit lower-energy and therefore short-range beta rays. Radionuclides used in the current DAR applications emit low- to medium-energy electrons and photons and it is the combination of these emissions that result in the PSF response of the imaging plate. The energies and abundance of these emissions are found in Ref. 9.
I.C. Image deconvolution
In mathematical terms, a blurred DAR image I(X) is the convolution of the radioactivity distribution A(X’) and the point spread function. If the measurement uncertainty (“noise”) array N(X) is also considered, the resulting image may be represented by the following equation:10,11
| (1) |
where the symbol * represents a convolution. Equation (1) is the general analytic form of images generated by many imaging systems and is the compact form of a system of linear equations whose unknowns are the source array A(X’) and whose dimension is the total pixel number of the image. In general, Eq. (1) is an ill-posed system, meaning that small perturbations such as fluctuations in background and readout during the measurement will be prohibitively magnified in the solution if it is solved directly as a linear equation system.12 Solving the radioactivity A(X’) from Eq. (1) usually involves certain iterative deconvolution steps.
Image deconvolution is frequently found in astronomy, radio astronomy and other scientific fields and there are various deconvolution-based approaches to resolution recovery.13 In this work, we selected the Richardson-Lucy (R-L) algorithm14-16 for image deconvolution, which maximizes the log-likelihood of Poisson-distributed data.17 Another popular image deconvolution algorithm, maximum entropy method (MEM), involves maximizing the “entropy” of the image, one form of the image entropy being S=-Σipi ln pi, where pi is the detection probability of pixel i or the ratio of the pixel value to the overall image intensity.18 We compared the MEM and R-L algorithms and found that they had almost identical performance except for the rate of convergence. A practical reason for selecting the R-L algorithm for the current work was the availability of the R-L deconvolution function deconvlucy in the matlab® 7.1 (The MathWorks, Inc.) image toolbox; this function features rapid convergence through the use of fast Fourier transforms with a non-negative constraint during iteration.
I.D. Richardson-Lucy algorithm
The Richardson-Lucy algorithm was developed independently in the early 1970s by Richardson14 and by Lucy15 (Richardson provided the discrete form and Lucy the continuous form) on the basis of fundamental statistical theorems, Bayes’ theorem, and total probability theorem. Bayes’ theorem relates the conditional and marginal probabilities of stochastic events S and S’ as follows:
| (2) |
In the expression P(|S’|S) is the likelihood of S’ given S for a fixed value. The total probability theorem states that
| (3) |
Combining the theorems given by Eqs. (2) and (3) allows Bayes’ theorem to be converted to the iterative form shown in Eq. (4),
| (4) |
If S represents the image intensity array and S’ the activity distribution, then P(S’) on the left-hand and right-hand sides of the equation is the posterior and prior estimation, respectively, of the unknown function, e.g., the activity distribution A(X’), and P(|S|S’) represents the PSF. Equation (4) leads to the iteration equation for the R-L algorithm,19 in which index r stands for iteration number
| (5) |
The matrix operations in the above equation are element-to-element multiplication and division. Equation (5) does not take into account the image background; in an improved algorithm, Snyder et al. considered the nonuniform flat-field, background, and readout noise of a CCD camera and attempted to include the estimation of these errors in image recovery iteration equations.17 In practice, the background levels and statistical fluctuations in DAR images have been found to be relatively small and Eq. (5) therefore works sufficiently well for DAR image deconvolution in most cases.
The R-L algorithm conserves the overall image intensity, an advantage for quantitative autoradiography. In certain circumstances, this algorithm can completely recover noise-free images. When performing deconvolution on real images, the R-L algorithm is responsive to low-spatial frequency errors in the estimated solution but unresponsive to those of high frequencies.15 This ensures that the large-scale structures are accurately recovered without notably amplifying noise. However, it may be inadequate for DAR images where certain small-scale features of interest might be obscured.
II. METHODS
II.A. Specimen type and tissue section preparation
In the current study, tumor specimens from ongoing clinical and preclinical protocols at Memorial Sloan-Kettering Cancer Center (MSKCC) were used for testing the deconvolution algorithm. The clinical sample was from a patient undergoing a radioimmunodetection procedure prior to surgery and for which digital autoradiograms from biopsy samples were available for analysis. This clinical trial was performed under the auspices of the MSKCC Internal Review Board (IRB No. 03-124) and was designed to evaluate the sensitivity of PET radioimmunodiagnosis in colon carcinoma using highly specific antibody A33 (Ref. 20) labeled with the longlived (4.2-day half-life) positron-emitting isotope, iodine-124. One week after antibody injection, the tumor and adjacent normal-tissue samples were obtained through surgery for autoradiographic and immunohistochemical analysis. These images visually demonstrated successful targeting of the radiolabeled antibody to the antigen-positive regions of the tumor.
Tissue sections from ongoing studies of tumor xenografts were also used. This material was obtained under the auspices of an Institutional Animal Care and Use Committee-approved protocol for evaluating PET tracers of tumor hypoxia. Specifically, nude rats bearing HT29 human colorectal carcinoma xenografts were injected with iodine-124 labeled iodo-azomycin galactopyranoside (124I-IAZGP), a 5-nitroimidazole shown to localize in regions of hypoxia.21,22
The tissue from both of these studies was processed as follows. Freshly excised tumor tissue was embedded in Tissue-Tek® optimal cutting temperature compound (Ted Pella, Inc., Redding, CA) and snap frozen with dry ice. The frozen tumor was cryosectioned on a Microm HM500 cryostat microtome (Microm International GmbH, Walldorf, Germany) into 8-μm thick sections and mounted on glass microscope slides. The slides were air dried for 20 min, arranged on a cardboard back, and covered by a layer of 10-μm plastic film to prevent radioactive contamination. This specimen assembly was placed in an imaging plate cassette in contact with a phosphor plate. Closing the light-tight cassette forced the specimens into tight contact with the imaging plate. The cassette was left in this state for the desired exposure duration. The imaging plate was 23 cm×25 cm Fujifilm BAS-MS2325 (Fuji Photo Film, Japan). The image readout device was a Fujifilm BAS-1800II bio-imaging analyzer that generates digital images with pixel dimensions as small as 50 μm×50 μm.
II.B. Source construction
Calculation of a PSF requires a radioactive source of known activity distribution. In principle, either a line source23 or a point source is suitable for PSF measurement. In this work, we developed a method for fabricating small circular sources for PSF measurement. The PSF was then calculated using the R-L algorithm from the images of these sources.
The test sources were fabricated on glass microscope slides in order to simulate the conditions of actual DAR imaging, including the backscatter conditions. Shandon Single Cytoslides® (Thermo Electron Corporation) microscope slides were selected for source construction because they were precoated to create a hydrophobic surface. Due to the surface tension of water, this surface resulted in any aqueous drop maintaining its shape as a flat semisphere. Under an optical microscope, the process could be observed in which, as the water vaporized, the surface tension drew the circum-ference of the droplet inward. Once evaporation was almost complete, the activity concentration was extremely high and the dehydrated remnant formed a small disk source. A series of test sources were made in this way for four iodine radio-isotopes, 123I, 124I, 125I, and 131I, using conveniently available radioiodinated compounds; the 123I sources were made from 123I-MIBG (methyliodobenzyguanidine) while the sources of the other three isotopes were made from an aqueous NaI solution. The final diameter of the source was found to be dependent on the concentration of the solute and was typically in the range of 100-200 μm.
II.C. PSF calculation
The shape and size of these test sources were determined by microscopy using an Olympus BX60 microscope (Olympus America, Inc.) equipped with a Sony DKC-5000 digital photo camera (Sony Medical Systems) and Image-Pro® Plus (Media Cybernetics, Inc.) image processing software; this software allows calibration of digital images for each objective lens used. The activity distribution within each source was assumed to be uniform across the source area. This assumption was consistent with the observation that at the final stage of solvent evaporation the water vanished and tiny crystals appeared throughout the droplet area at almost the same instant. The area of each source was symmetrically partitioned by 50 μm×50 μm grids, each square corresponding to one pixel of the DAR image. The fraction of each square covered by the source was assigned to the value of a matrix element, for instance, the matrix of a 136-μm diameter source was
As seen in Eq. (5), the activity distribution A(X’) and the PSF are commutable in the deconvolution iteration formula. Therefore, as long as A(X’), in the form of a matrix as shown above, is determined for the source, the PSF can be calculated from the source image with this equation.
II.D. Evaluation of the deconvolution algorithm
The proposed image deconvolution schema has been tested on histological tissue sections. Since digital autoradiographic data cannot provide “gold standard” information of the radionuclide distribution at higher resolution than the imaging plate itself, we attempted to use a model system that would allow us to test the deconvolution algorithm. This was done using an image of the hypoxia distribution based on a fluorescent immunohistochemical stain of tumor section. The image was captured on the Olympus BX60 fluorescence microscope at a pixel resolution of 1.5 μm×1.5 μm. This image was based on antibody binding to carbonic anhydrase IX (CAIX), a protein upregulated under hypoxic conditions. Details on the staining of the endogenous hypoxia marker CAIX were given by Wykoff.24 The distributions of radiotracers of tumor hypoxia and of endogenous hypoxia-upregulated markers cannot necessarily be considered identical, however. A separate study is therefore underway to determine the spatial similarities between CAIX and different radioactive hypoxia tracers. For the purposes of the current analysis, the CAIX images captured directly from the fluorescence microscope were rescaled so that each pixel corresponded to a 50 μm×50 μm pixel size to match that of a digital autoradiogram. Each matrix element consisted of a floating point number interpolated from the intensities of the CAIX image.
A test image was blurred through convolution with the PSF of the isotope of interest, so as to generate a pseudoautoradiographic image. Since the source image, from which this pseudoautoradiographic image was derived, is known, it allows an evaluation of the effectiveness of the deconvolution algorithm as a function of iteration number. In this simulation study, random background noise was added to each pixel of the blurred image. Consistent with previous measurements, the statistical fluctuation in the PSL of 50-μm pixel is no larger than 0.08, much smaller than that of Gaussian distribution. The maximum pixel value of the blurred image was ∼26, compared with the maximum possible PSL of 79.04 from the Fuji BAS-1800II image reader. The added uniform background ranged from 0.01 (the typical background of a 1-day exposure) to 5.0, simulating sample specific activities ranging from high to low radiotracer retention.
By studying the operation of deconvolution on the foregoing synthetic autoradiograms, for which the known source image serves as the gold standard, the rate of iteration convergence and the accuracy of the resulting image can be objectively determined.
III. RESULTS AND DISCUSSIONS
III.A. Point spread functions
A DAR image was made for each test source and the pixel values readout was converted to a floating number matrix. The iterative PSF calculation performed using the matlab® deconvlucy function utilized the source image as an a priori estimate, with iterations stopped if the full width at half maximum (FWHM) of the resulting PSF did not decrease between two consecutive iterations. Because of the complicated patterns of radiation energy deposition within the phosphor medium, it is unlikely that a general analytic PSF model could be obtained. Thus, we proposed using a combination of surface peak functions to express the shape of the PSF, so that a symmetric and smooth matrix was derived for each isotope by surface fitting. Through some trials, the function used for surface fitting was empirically selected as the sum of three Gaussian peaks centered at the same location
| (6) |
where D is the distance between any pixel and the central pixel of the PSF and the coefficients ai, bi (i=1,2,3) were determined from the test source representing the median of 5 or more test sources per isotope. The surface fitting was performed with Mathematica 5.2 (Wolfram Research, Inc.) and Prism 5.0 for Windows (GraphPad Software, San Diego, CA) using a least-squares algorithm. The fitted parameters and associated errors are listed in Table I, with each PSF normalized to its peak. These parameters are specific to the imaging plates used in the current study, and may not apply to plates of a different composition. Figure 1 compares the image profile of a 125I source and the PSF plotted with the fitted equation. The PSF thus measured is highly reproducible among test sources. For instance, the profiles of the PSF calculated from a series of five 124I sources are nearly indistinguishable, with a maximum difference of less than 5% between the FWHM (Fig. 2).
Table I.
Fitted parameters for the PSF equation of selected isotopes
| Source | a1 | b1mm-2 | a2 | b2mm-2 | a3 | b3mm-2 |
|---|---|---|---|---|---|---|
| 123I | 0.505±0.079 | 76.9±8.4 | 0.457±0.075 | 26.6±3.1 | 0.038±0.010 | 3.84±0.86 |
| 124I | 0.449±0.049 | 121.5±16.1 | 0.459±0.045 | 27.9±3.1 | 0.092±0.014 | 4.17±0.54 |
| 125I | 0.462±0.058 | 103.9±13.3 | 0.446±0.053 | 27.4±3.3 | 0.092±0.015 | 4.38±0.55 |
| 131I | 0.488±0.050 | 174.8±21.5 | 0.440±0.048 | 42.0±4.4 | 0.072±0.010 | 5.76±0.67 |
Fig. 1.

Calculation of the point spread function from the DAR image of a small disk source. Left—image intensity profile of a 125I disk source. Right—the PSF of 125I derived with the R-L algorithm and surface fitting.
Fig. 2.
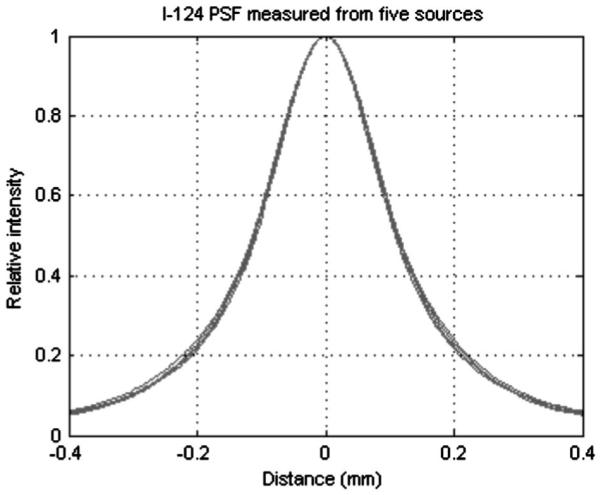
Reproducibility of the point spread function calculation. Five 124I PSF curves calculated from different disk sources are overlaid, showing high stability of the PSF measurement method.
The measured PSF is an approximation of the real (but unknown) PSF. In our opinion, the major sources of errors in PSF measurement include: (a) nonuniform source activity (such defective sources can usually be excluded through visual inspection of the image intensity profile); (b) random noise in the measurement; and (c) the arbitrarily selected iteration end point.
III.B. Validation of measured PSF
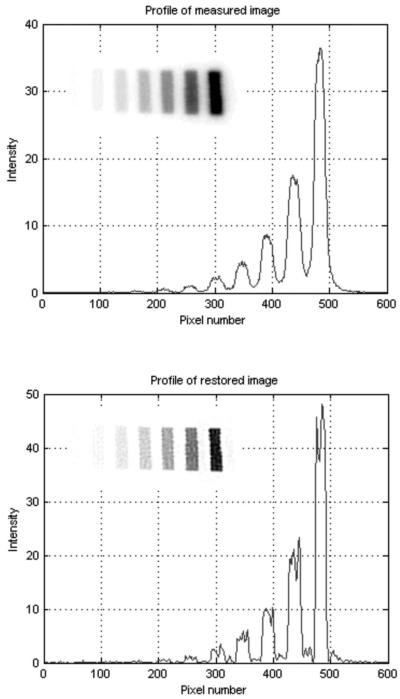
To test and to validate the accuracy of the measured PSF, the deconvolution methodology was applied to a known source distribution in the form of a 125I microscale (Amersham Biosciences UK Limited) consisting of ten thin blocks of radioactive polymers; the activity concentration of the blocks increases in twofold from the lowest-to the highest-activity block. Each block is 1 mm wide with a 1 mm gap between adjacent polymers. The DAR image intensity profile of the 125I microscale (Fig. 3, top) clearly shows how the PSF degrades image contrast. This DAR image is suboptimal for quantitative analysis, but proper application of the deconvolution function results in a notable improvement in image contrast (Fig. 3, bottom). In the restored image there are low-level false signals near the 125I bands, which probably result from two sources: first, the R-L algorithm produces artifacts around high-contrast objects, a phenomenon referred to as the “ring effect”; 25,26 second, the microscale is thicker than the 8-μm thickness most commonly used for histological sections. Nonetheless, Fig. 3 shows that the high contrast between the 125I blocks and intervening nonradioactive regions is almost completely recovered and that the accuracy of the quantitative relationship between image intensity and activity concentration is maintained. The relative intensities of each radioactive block in the raw and deconvolution-restored DAR images are compared in Table II.
Fig. 3.
Example of image deconvolution result for a 125I microscale. Top—PSL intensity profile of a 125I microscale DAR image (insertion). Bottom—PSL intensity profile of the recovered image (insertion) for the same pixels, after 24 iterations of matlab® function deconvlucy.
Table II.
Comparison of normalized intensities of 125I bands of the microscale in the raw DAR and deconvolved images. The strongest eight bands are listed
| 125I band | Nominal | DAR image | Recovered image |
|---|---|---|---|
| 1 | 0.503 | 0.388 | 0.459 |
| 2 | 0.251 | 0.196 | 0.233 |
| 3 | 0.123 | 0.0966 | 0.114 |
| 4 | 0.0623 | 0.0512 | 0.0602 |
| 5 | 0.0316 | 0.0270 | 0.0315 |
| 6 | 0.0145 | 0.0114 | 0.0133 |
| 7 | 0.0078 | 0.0066 | 0.0077 |
| 8 | 0.0037 | 0.0034 | 0.0039 |
III.C. Performance of deconvolution algorithm
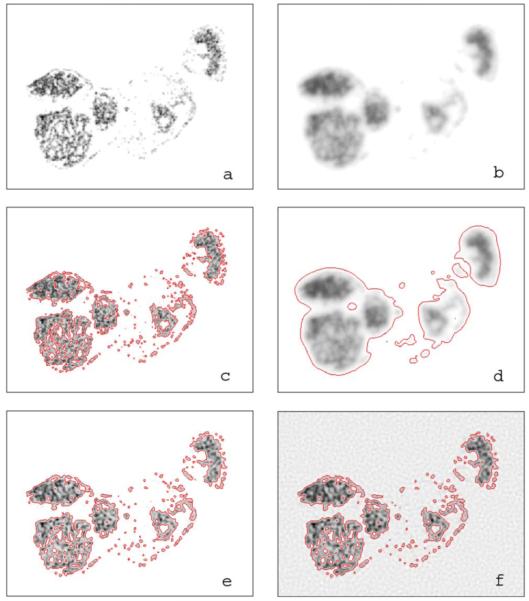
Figure 4(a) shows the synthetic test image converted from the high-resolution immunofluorescent image of CAIX expression after removal of the background, that is, with regions of negligibly low CAIX expression set to zero. The performance of deconvolution on DAR images was evaluated with this test image blurred by the PSF of 125I [Fig. 4(b)], plus the addition of background noise equivalent to that observed in typical digital autoradiograms. It is potentially important for DAR images to be used for quantitative fractional area assessment of a chosen property, thus a threshold should be selected in the image after deconvolution for segmentation and the number of pixels exceeding the threshold would be the measure of the property under study. For illustration purposes we arbitrarily determine the threshold in such a way that in each DAR image, the sum of pixel values above the threshold equals to 95% of the overall image intensity minus background. In the unblurred and noisefree image Fig. 4(a), this threshold is equivalent to 9% of the maximum pixel value. The threshold contour lines of the original and the blurred images thus defined are plotted in Figs. 4(c) and 4(d), respectively. In the blurred image the contour encloses 20 245 pixels compared with 10 014 pixels in the original image; the PSF thus overestimated the number of tracer-positive pixels by more than a factor of 2.
Fig. 4.
The effect of image blurring by the point spread function of 125I and the effect of noise in image recovery using the R-L deconvolution algorithm. Image size is 320 pixel×240 pixel. (a) The original pseudo image of radiotracer distribution. (b) The pseudoautoradiographic image blurred with the PSF of 125I. (c) The pseudoimage with contours of arbitrary marker-positive threshold enclosing 95% of overall intensity. (d) The blurred image with contours of 95% total intensity threshold. (e) and (f) Blurred images generated from the pseudoimage in panel (a) by adding a background of 0.01 and 5.0 plus arbitrary noise restored through 67 and 45 deconvlucy iterations, respectively. Contours set at the 95% total intensity threshold have been plotted in each of the restored images.
Like many iterative algorithms, one must select the stopping point for the R-L deconvolution iterations. Excessive iterations may degrade the solution from the desired result, particularly if the algorithm is not regularized. The stopping criterion for the simulation study was that the correlation coefficient reached maximum between the pixel values of the recovered image and the corresponding “radioactivity” in the synthetic autoradiogram. The quality of the image after deconvolution was evaluated by the comparison between the restored image and the synthetic image Fig. 4(a). Four types of pixels were distinguished in the restored image: true-positive, true-negative, false-positive and false-negative, in which “true” and “false” refer to the synthetic image, for instance, the true-positive pixels were above the threshold in both the synthetic image and the restored image and the false-positive pixels were below the threshold in the synthetic image but above the threshold in the restored image. In Fig. 5, we show stepwise the convergence properties of the R-L algorithm for the simulated autoradiographic data. There are four curves shown in Fig. 5: the numbers of true-positive pixels, false-positive pixels, total positive pixels, and false-negative pixels in the restored image as function of iteration number. The solid horizontal line indicates the target—the real marker-positive pixels. At low background levels, the best results of deconvolution with matlab® function deconvlucy are achieved between 60 and 70 iterations; within this range the solutions vary only slowly with iteration number. Table III shows the results of the simulation study; the parameters listed are the values obtained at the time the iteration stopping criterion is reached. The correlation coefficient between the test image prior to convolution with the PSF and the recovered image intensity is calculated for each case and the results are listed in the bottom row of Table III. The table also shows that (second row) when image intensity-to-background ratio decreases, fewer iterations are required to achieve the optimal solution.
Fig. 5.
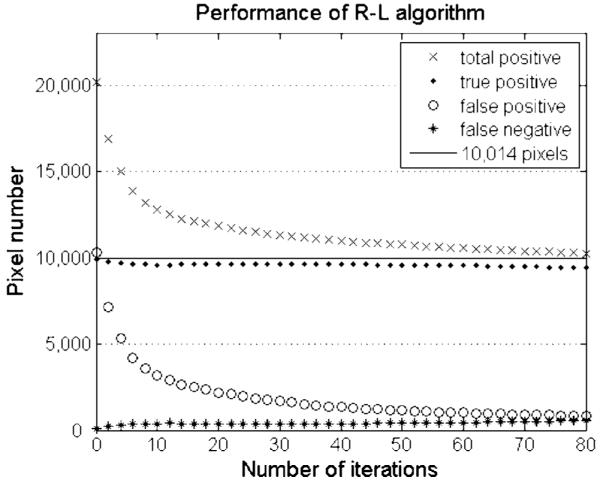
Numbers of pixels of each type as a function of iterations in the image restored with deconvlucy function from a test image, which is generated from Fig. 4(b) by adding a background of 0.01 and arbitrary noise. The solid line shows the number of marker-positive pixels or 10,014 in the original pseudoimage Fig. 4(a). The data are plotted for every second iteration number.
Table III.
Results of deconvolution simulations on blurred images when stopping criterion is reached. Images with five different background levels are studied
| Background level | 0.01 | 0.05 | 0.2 | 1.0 | 5.0 |
|---|---|---|---|---|---|
| Iteration number | 67 | 65 | 65 | 60 | 45 |
| Total positive pixels | 10 468 | 10 533 | 10 608 | 10 651 | 10 789 |
| True positive pixels | 9532 | 9551 | 9547 | 9531 | 9495 |
| False positive pixels | 936 | 982 | 1061 | 1120 | 1294 |
| False negative pixels | 482 | 463 | 467 | 483 | 519 |
| Correlation coefficient | 0.9704 | 0.9702 | 0.9695 | 0.9668 | 0.9585 |
The performance of the image deconvolution method discussed in the above paragraph is illustrated in Figs. 4(e) and 4(f). Within a broad range (three magnitudes) of peak intensity-to-background ratio, the radioactivity distribution can be closely restored. If the activity of the specimen is low, with regions less than 2:1 compared to background radiation, the restored image becomes grainy as seen in Fig. 4(f), and false positive regions could show up in background.
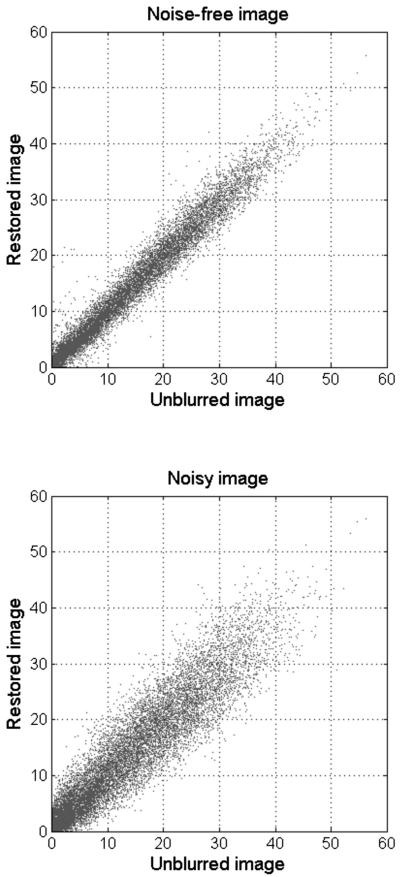
While increasing image contrast, the R-L algorithm tends to amplify noise meaning that the quantitative relationship between pixel values will not be precisely restored. Figure 6 shows the scattergram of the image intensity of marker-positive pixels in recovered image Fig. 4(e) against that of the corresponding pixels in the synthetic image Fig. 4(a), as opposed to the scattergram for the noise-free image Fig. 4(b) processed with a large number of deconvolution iterations. Though deconvolution increases statistical uncertainty in image intensity, the data sets remain linearly correlated with each other, a requirement of any quantitative analysis.
Fig. 6.
That noise degrades the restored image is illustrated by the deterioration of correlation between corresponding pixel values of the pseudoauto-radiographic image Fig. 4(a) and restored image in the presence of image noise. The correlation coefficient drops from 0.9919 for the noise-free image restored through 50 000 deconvlucy iterations (top) to 0.9704 for a noisy image with background of 0.01 and arbitrary noise restored through 67 deconvlucy iterations (bottom).
III.D. Examples of image restoration
Examples of the application of deconvolution techniques to the typical digital autoradiograms obtained in our studies are shown in Figs. 7 and 8. Figure 7 shows the application of deconvolution to an autoradiogram of the distribution of 124I-labeled A33 antibody in a biopsy sample of human colon. Figure 7(a) shows the unprocessed digital autoradiogram and Fig. 7(b) shows the image after deconvolution; Figs. 7(c) and 7(d) show the images of the hematoxylin and eosin (H&E)-stained tissue section without and with the deconvolved autoradiogram overlay, respectively. This once again demonstrates the ability of deconvolution to reduce the blurring effect of the PSF.
Fig. 7.
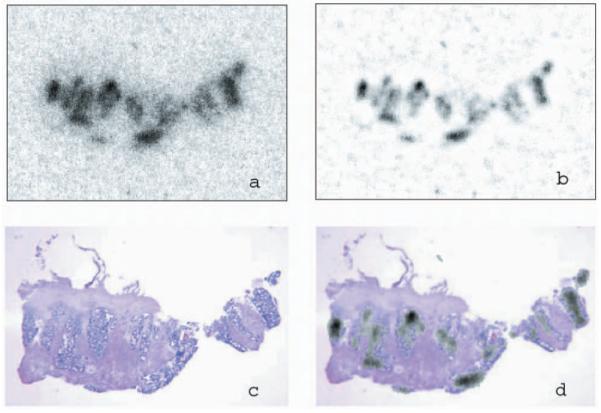
Deconvolution of patient tumor section DAR image from radioim-munodiagnosis in colon carcinoma using highly specific antibody A33 labeled with 124I. (a) DAR image of tumor section before processing. (b) DAR image after deconvolution. (c) H&E stain of the section. (d) The recovered image and H&E staining image manually fused. The DAR image size is 256 pixel×180 pixel.
Fig. 8.
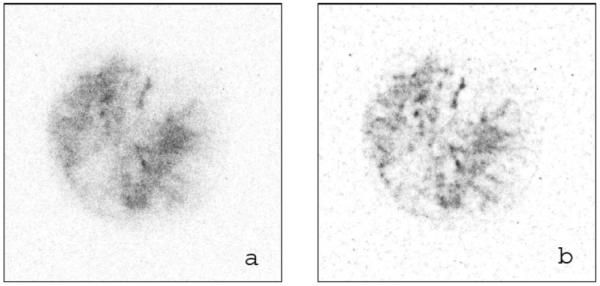
Deconvolution for tumor section image of HT29 human xenograft on nude rat containing hypoxia tracer 124I-IAZGP. (a) Original DAR image of the tumor section. (b) Restored image using the R-L algorithm. The DAR image size is 350 pixel×350 pixel.
In Fig. 8, deconvolution is applied to an autoradiogram of the hypoxia marker 124I-IAZGP distribution within a section of HT29 tumor xenograft on nude rat. Figure 8(a) is the unprocessed digital autoradiogram that features low radioactivity in the tumor section. The restored image Fig. 8(b) shows considerable improvement in both contrast and sharpness of detail after the application of deconvolution.
IV. CONCLUSION
Deconvolution improves image contrast and overall image quality but amplifies noise. Its utility lies in the removal of false-positive pixels and more accurate mapping of the activity distribution within a tissue section, allowing for quantitative analysis of marker distribution at the microscopic level. The accuracy of deconvolution depends upon the ability to measure the isotope-specific PSF. In this article, we describe a method to generate small disk sources with which to unambiguously measure the PSF for the digital autoradiography system. This method does not require sophisticated instruments, and can be conveniently conducted in a laboratory equipped with a conventional DAR system and standard microscopy devices.
ACKNOWLEDGMENTS
The assistance of Dr. Ming-Lan Lu, Dr. Jian Hu, Bryan Quinn, and the Nuclear Medicine staff at MSKCC in providing the materials for fabricating test sources is gratefully acknowledged. This project is supported by the NCI program project Grant No. P01 CA115675-01 (P.I. Dr. C. Clifton Ling). We especially thank Dr. Larson and Dr. Divgi from the Nuclear Medicine Service, MSKCC and the Ludwig Institute for Cancer Research for the use of the digital autoradiograph from the clinical A33 radioimmunodiagnosis study, which was acquired under the NIH program Project No. P01 CA033049-23 (P.I. Dr. Alan Houghton).
References
- 1.Sonoda M, Takano M, Miyahara J, Kato H. Computed radiography utilizing scanning laser stimulated luminescence. Radiology. 1983;148:833–838. doi: 10.1148/radiology.148.3.6878707. [DOI] [PubMed] [Google Scholar]
- 2.Miyahara J, Takahashi K, Amemiya Y, Kamiya N, Satow Y. A new type of x-ray area detector utilizing laser stimulated luminescence. Nucl. Instrum. Methods Phys. Res. A. 1986;246:572–578. [Google Scholar]
- 3.Hillen W, Schiebel U, Zaengel T. Imaging performance of a digital storage phosphor system. Med. Phys. 1987;14:744–751. doi: 10.1118/1.596127. [DOI] [PubMed] [Google Scholar]
- 4.Marshall EA, Pickering WM. The computational restoration of radiographic images. Comput. Biol. Med. 1994;24:1–9. doi: 10.1016/0010-4825(94)90032-9. [DOI] [PubMed] [Google Scholar]
- 5.Goyette JA, Kang MG, Katsaggelos AK, Lapin GD. A spatially adaptive image restoration for autoradiography. Proc. SPIE. 1995;2622:811–822. [Google Scholar]
- 6.Wells K, Kokkinou E, Petrou M, Ranicar A, Spinks T, Ott RJ. Developments in CCD-based beta/x-ray imaging. Proc. SPIE. 2001;4508:99–110. [Google Scholar]
- 7.Amemiya Y, Miyahara J. Imaging plate illuminates many fields. Nature (London) 1988;336:89–90. doi: 10.1038/336089a0. [DOI] [PubMed] [Google Scholar]
- 8.Zuo JM. Electron detection characteristics of a slow-scan CCD camera, imaging plates and film, and electron image restoration. Microsc. Res. Tech. 2000;49:245–268. doi: 10.1002/(SICI)1097-0029(20000501)49:3<245::AID-JEMT4>3.0.CO;2-O. [DOI] [PubMed] [Google Scholar]
- 9.Weber DA, Eckerman KF, Dillman LT, Ryman JC. MIRD: Radionuclide Data and Decay Schemes. Society of Nuclear Medicine; New York: 1989. [Google Scholar]
- 10.Puetter RC, Gosnell TR, Yahil A. Digital image reconstruction: Deblurring and denoising. Annu. Rev. Astron. Astrophys. 2005;43:139–194. [Google Scholar]
- 11.Lane RG. Methods for maximum-likelihood deconvolution. J. Opt. Soc. Am. A. 1996;13:1992–1998. [Google Scholar]
- 12.Rushforth CK. In: Image Recovery: Theory and Application. Stark H, editor. Academic; Orlando: 1987. pp. 1–27. [Google Scholar]
- 13.Stark H, editor. Image Recovery: Theory and Application. Academic; Orlando: 1987. [Google Scholar]
- 14.Richardson WH. Bayesian-based iterative method of image restoration. J. Opt. Soc. Am. 1972;62:55–59. [Google Scholar]
- 15.Lucy LB. An iterative technique for the rectification of observed distributions. Astron. J. 1974;79:745–754. [Google Scholar]
- 16.Shepp LA, Vardi Y. Maximum likelihood reconstruction for emission tomography. IEEE Trans. Med. Imaging. 1982;MI-1:113–122. doi: 10.1109/TMI.1982.4307558. [DOI] [PubMed] [Google Scholar]
- 17.Snyder DL, Hammoud AM, White RL. Image recovery from data acquired with a charge-coupled-device camera. J. Opt. Soc. Am. A. 1993;10:1014–1023. doi: 10.1364/josaa.10.001014. [DOI] [PubMed] [Google Scholar]
- 18.Narayan R, Nityananda R. Maximum entropy image restoration in astronomy. Annu. Rev. Astron. Astrophys. 1986;24:127–170. [Google Scholar]
- 19.Pruksch M, Fleischmann F. Positive iterative deconvolution in comparison to Richardson-Lucy like algorithms. ASP Conf. Ser. 1998;145:496–499. [Google Scholar]
- 20.Ruan S, O’Donoghue JA, Larson SM, Finn RD, Jungbluth A, Welt S, Humm JL. Optimizing the sequence of combination therapy with radiolabeled antibodies and fractionated external beam. J. Nucl. Med. 2000;41:1905–1912. [PubMed] [Google Scholar]
- 21.Schneider RF, Engelhardt EL, Stobbe CC, Fenning MC, Chapman JD. The synthesis and radiolabeling of novel markers of tissue hypoxia of the iodinated azomycin nucleoside class. J. Labelled Comp. Radiopharm. 1997;XXXIX:541–557. [Google Scholar]
- 22.Zanzonico P, O’Donoghue J, Chapman JD, Schneider R, Cai S, Larson S, Wen B, Chen Y, Finn R, Ruan S, Gerweck L, Humm J, Ling C. Iodine-124-labeled iodo-azomycin-galactoside imaging of tumor hypoxia in mice with serial microPET scanning. Eur. J. Nucl. Med. Mol. Imaging. 2004;31:117–128. doi: 10.1007/s00259-003-1322-y. [DOI] [PubMed] [Google Scholar]
- 23.Dallas WJ, Barrett HH, Wagner RE, Roehrig H, West CN. Finite-length line-spread function. J. Opt. Soc. Am. A. 1987;4:2039–2044. doi: 10.1364/josaa.4.002039. [DOI] [PubMed] [Google Scholar]
- 24.Wykoff CC, Beasley NJ, Watson PH, Turner KJ, Pastorek J, Sibtain A, Wilson GD, Turley H, Talks KL, Maxwell PH, Pugh CW, Ratcliffe PJ, Harris AL. Hypoxia-inducible expression of tumor-associated carbonic anhydrases. Cancer Res. 2000;60:7075–7083. [PubMed] [Google Scholar]
- 25.van Kempen GMP, van Vliet LJ, Verveer PJ, van der Voort HTM. A quantitative comparison of image restoration methods for confocal microscopy. J. Microsc. 1997;185:354–365. [Google Scholar]
- 26.Zhang JD, Zhou TJ, Cheung CK, Beling CD, Fung S, Ng MK. Deconvolution of 2D coincident Doppler broadening spectroscopy using the Richardson-Lucy algorithm. Nucl. Instrum. Methods Phys. Res. A. 2006;560:552–557. [Google Scholar]


