

Abstract
The effects of concentration and molecular weight of neutral dextrans on the adhesion of human red blood cells (RBC) to albumin-coated glass have been investigated using a parallel-plate flow chamber. Results indicate that the adhesion is markedly increased in the presence of 70 kDa and 500 kDa dextran, with this increase reflected by both the number of cells adhering and the strength of the adhesion. This increased adhesiveness is attributed to reduced surface concentrations of the large polymers and hence attractive forces due to depletion interaction. Depletion interaction brings the adjacent surfaces closer, leading to an increased number of binding sites available to the cell and thus more efficient and stronger adhesion of single cells. Our results suggest that depletion might play a role in other specific cell-cell or cell-surface interactions via initiating close contacts to allow specific binding.
Keywords: adhesion, depletion interaction, dextran, red blood cell
Introduction
During the past few decades, the adhesion of red blood cells (RBC) to other cells and to surfaces has been studied quite extensively due to at least two reasons: 1) Abnormal adhesiveness to other RBC and to endothelial cells has been linked to several diseases such as sickle cell anemia or diabetes mellitus [1, 2]; 2) Red blood cells are relatively simple, easily obtainable cells thus making them logical choices to study the fundamentals of cell interactions in the circulation or with biomaterials. It is clear that various non-specific forces (e.g., electrostatic) and specific forces (e.g., cell adhesion molecules) govern RBC and other cell adhesion to cells or surfaces. While prior studies have described several aspects of RBC adhesion in normal and pathologic states, none appears to have considered depletion interaction as a non-specific force for cell-surface adhesion. Conversely, depletion mediated interactions are commonly considered in the general field of colloid chemistry, and several previous reports have dealt with the experimental and theoretical aspects of depletion aggregation, often termed depletion flocculation [3-7]. More recently, depletion interaction as an attractive force in polymer-induced RBC aggregation has been considered, with results indicating that polymer depletion plays a major role in reversible aggregation of RBC [8, 9]. Such findings are of basic science and clinical interest, in that reversible RBC aggregation is an important determinant of the in vitro rheological behavior of blood as well as of in vivo blood flow dynamics and flow resistance [10, 11].
A depletion layer develops near a surface in contact with a polymer solution if the loss of configurational entropy of the polymer is not balanced by adsorption energy. Within this layer the polymer concentration is lower than in the bulk phase. Thus, as two particles approach, the difference of solvent chemical potential (i.e., the osmotic pressure difference) between the intercellular polymer-poor depletion zone and the bulk phase results in solvent displacement into the bulk phase and hence depletion interaction [5]. Due to this interaction, an attractive force develops that tends to minimize the polymer-reduced space between the cells, thus resulting in flocculation or aggregation. The existence of depletion layers at the RBC surface has been confirmed via electrophoresis studies of cells in various polymer solutions [8, 12, 13], and the energetics of RBC interaction in neutral polymer solutions and the effects of the “soft or hairy” RBC membrane glycocalyx have been reported [9].
While it is known that plasma proteins can modify cell binding to various surfaces, systematic studies exploring the impact of solvent composition, including larger molecules (e.g., plasma proteins), seem lacking. Thus, although depletion-mediated interaction for RBC appears to be a viable mechanism for aggregation in neutral polymer solutions, the role of depletion interaction in RBC adhesion to surfaces remains essentially unexamined. The present study was therefore designed to test the hypothesis that cell adhesion to a rigid protein-coated surface would be enhanced in neutral polymer solutions and that the effects of polymer size and concentration would be consistent with those predicted by a generalized depletion approach. A model system of human RBC, suspended in isotonic dextran solutions, interacting with a flat, albumin-coated glass surface was used; cell adhesion was quantified as a function of contact time, polymer concentration and applied fluid shear stress.
Material and Methods
RBC preparation
Blood was obtained by sterile venipuncture from the antecubital vein of healthy adult donors into EDTA (1.5 mg/mL) and used within four hours; all donors provided verbal informed consent and the study was approved by the University of Southern California Institutional Review Board. RBC were separated from whole blood by gentle centrifugation (2,000 × g, 10 minutes), then washed three times in isotonic phosphate buffered saline (PBS, 10 mM phosphate, 285 mOsm/kg, pH=7.4). RBC were then resuspended at 0.2% hematocrit in either dextran-free PBS or in dextran-PBS solutions: dextran 10.5 kDa, dextran 72.5 kDa and dextran 500 kDa (Sigma Aldrich, St Louis, MO) were dissolved in phosphate buffered saline at the desired final concentrations.
Flow chambers and flow system
Rectangular borosilicate glass chambers, 0.3 mm high by 3 mm wide by 50 mm long (Microslides, Vitro Dynamics, Inc., Rockaway, NJ), were acid-washed and coated with 3-aminopropyl-triethoxy-silane (APES, Sigma Aldrich) as described elsewhere [14]. Briefly, the chambers were soaked in concentrated nitric acid overnight, washed thoroughly with double-distilled water, dried at 50 °C for 24 hours, and washed twice in anhydrous acetone. The chambers were then soaked in a 4% solution of APES in anhydrous acetone for four minutes, rinsed with acetone followed by water, then dried at 50 °C. These aminated (i.e., APES-coated) chambers were stored in a dust-free environment until use. To coat the aminated chambers with protein, 2% bovine serum albumin (Sigma Aldrich) or 0.5% bovine fibrinogen (Sigma Aldrich) in PBS were introduced into the chambers and incubated at room temperature for 120 min to allow binding to the APES; the coated chambers were then briefly rinsed, filled with PBS, and remained fluid-filled thereafter.
The flow system consisted of the rectangular glass chamber glued to a 25 by 75 mm glass microscope slide and mounted on the stage of an inverted microscope fitted with a video camera. One end of the chamber was connected by silicone tubing to a miniature low displacement electronic valve that allowed switching between reservoirs containing either RBC suspensions or PBS; the low displacement of the valve assured minimal disturbance of the chamber contents when changing between fluids. The opposite end of the chamber was connected to a variable speed withdrawal syringe pump (model 935, Harvard Apparatus Co., Millis, MA) that drew either a RBC suspension or PBS through the microslides at a selected volumetric flow rate. The microscope, valve, inflow tubing and the reservoirs for the two fluids (i.e., PBS or RBC suspension) were maintained at 37°C via a thermostated enclosure.
Experimental protocol
The chamber was initially filled with a 0.2% hematocrit RBC suspension prepared using dextran-free PBS or dextran-PBS solutions and the RBC allowed to settle, without flow, to the bottom of the chamber for time periods of 1 to 24 minutes. The settled RBC were observed at the bottom center of the flow chamber (i.e., 1.5 mm from each sidewall, 25 mm from entrance); the number of settled cells within the observed video image was usually between 200 and 300 but decreased somewhat for short settling times (e.g., approximately 100 cells for one minute of settling). The chamber was then rinsed for 30 seconds with dextran-free PBS at a very low flow rate of 0.29 mL/min corresponding to a wall shear stress of 0.07 Pa; this low flow cleared the observed field in the center of the flow chamber of non-attached cells. Cells withstanding this low flow rate were defined as attached cells (see Results for more details). The volumetric flow rate of dextran-free PBS was then increased to 1.2, 1.9, or 2.9 mL/min, corresponding to wall shear stresses of 0.30 Pa, 0.49 Pa or 0.75 Pa, and the field of observation video recorded for up to 100 seconds. Wall shear rate and wall shear stress were calculated based upon the geometry of the rectangular glass chambers, the volumetric flow rate and the viscosity of dextran-free PBS [15].
Data analysis
Video images were digitized and analyzed following the experimental procedure using the software program ImageJ 1.29 (National Institutes of Health, Bethesda, MD). The number of cells appearing in a defined area of the chamber was counted at the following time points: 1) at the end of the settling period (i.e., immediately prior to the 30 second low flow PBS rinse); 2) at the end of the 30 second low flow (i.e., 0.07 Pa) PBS rinse period; 3) at 5, 10, 50 and 100 seconds of flow at a given shear stress. Percent RBC attachment was then calculated as the ratio of the cell count at a given time divided by the cell count at the end of settling (i.e., just prior to the beginning of the low flow PBS rinse). Note that this approach allows determining percent attachment at the end of the low shear stress PBS rinse and thus at zero time exposure to the higher shear stresses. Unless otherwise, stated all results reflect mean values for four donors, with the specific measurement for each donor repeated three times.
Miscellaneous techniques
The effects of various dextran 500 concentrations on the interface between settled RBC and a flat surface at stasis were achieved via two approaches: 1) Interference Reflection Microscopy (IRM) using an inverted confocal laser scanning microscope (Nikon PCM system). In this method, darker areas of the image indicate decreasing distances between the cell and the flat surface [16]; 2) Differential Interference Contrast (DIC) microscopy (model BX-50, Olympus Co., Culver City, CA) followed by line scans across the optical shear axis to provide the gradient of the optical path length. In both approaches dilute RBC suspensions were introduced into circular chambers (CoverWell chambers, Molecular Probes, Carlsbad, CA) mounted on albumin-coated glass slides as described above and allowed to settle for three minutes without flow; video images of this no-flow condition were then recorded and analyzed. RBC suspension hematocrits were determined by an automated hematology analyzer (Micros, ABX Diagnostics, Irvine, CA), solution osmolality by a freezing-point osmometer (model 5004, Precision Systems, Natick, PA), and pH by an Orion model 410A system (Orion Research, Boston, MA).
Results
Surface effects without dextran
The current study employed APES (3-aminopropyl-triethoxy-silane) treated surfaces subsequently coated with protein. APES coating of surfaces is often used to immobilize proteins or cells since the aminated surface reacts quiet readily with the anionic groups of proteins or cell surface layers. Consequently, APES coated surfaces can be coated quite easily with plasma proteins. On the other hand, one way of preventing RBC binding to surfaces is to coat the substratum with plasma proteins (e.g., fibrinogen, serum albumin). Initial efforts were directed toward examining RBC adhesion to APES- or albumin- or fibrinogen-coated glass in the absence of dextran. In these studies, RBC were allowed to settle for three minutes then bound cells were counted before (0 sec) and after (100 sec) application of a 0.75 Pa constant stress.
As shown in Table 1 (upper portion), cell adhesion to APES-coated glass is always 100% and a shear stress of 0.75 Pa is not sufficient to detach any cells within the 100 sec period of observation. In contrast, almost no cells adhered to the fibrinogen-coated surface, and those that did were quickly detached after applying the 0.75 Pa shear stress. RBC adherence to albumin-coated glass was of intermediate intensity in that 14% of the cells were initially adhered, with all cells removed after applying 0.75 Pa for 100 seconds. These results are consistent with past reports indicating much less RBC adhesion to fibrinogen versus albumin coated glass surfaces [17]. This effect can be visualized by assuming that the proteins form a “barrier” between the settled RBC and the surface, and may also occupy some binding sites. For fibrinogen this effect is, as expected, much more pronounced due to the roughly 4-fold greater hydrated size of this protein, thus putting the surface groups and the cells even further apart.
Table 1.
Percentage of cells adherent after applying shear stress of 0.75 Pa*
| APES | Fibrinogen | Albumin | ||||
|---|---|---|---|---|---|---|
| Observation time | 0 sec | 100 sec | 0 sec | 100 sec | 0 sec | 100 sec |
| Dextran-free PBS | 100 | 100 | 0.1 ± 0.2 | 0.0 | 14.2 ± 6.3 | 0.0 |
| Dextran 500 (0.5 g/dL) | 100 | 100 | 0.4 ± 0.7 | 0.0 | 93.9 ± 2.6 | 16.6 ± 10.6 |
RBC were allowed to settle for three minutes prior to initiation of each experiment.
Data are mean ± SD, n=4.
Surface effects with dextran
Table 1 also present results for the same three surfaces for RBC suspended in a 0.5 g/dL solution of 500 kDa dextran. The effects of this polymer in the suspending phase are essentially absent for APES and fibrinogen: 100% of cells still adhere to APES at 0 and 100 sec, only 0.4% adhesion to fibrinogen at 0 sec, and 0% at 100 sec. Conversely, there are marked effects of the 500 kDa dextran on adhesion to albumin, with almost 94% of the cells adhering at 0 sec and about 17% at 100 sec. Thus the presence of 500 kDa dextran results in a dramatic, 7-fold increase of adhesion to the albumin surface at 0 sec and a substantial number of cells retained at 100 sec.
Optical studies
In order to more closely examine the 500 kDa dextran phenomena presented in Table 1, interference reflection microscopy (IRM) was employed to study the interface between RBC and the albumin-coated surface (Figure 1). In these studies RBC were suspended in various dextran 500 solutions and allowed to settle for three minutes, then rapidly examined by IRM; a darker appearance of the contact area between the cell and the glass slide indicates closer proximity [16]. In dextran-free PBS (Figure 1A) the area of close contact is rather small, with most settled cells appearing as rings due to close contact only at the peripheral rim of the biconcave RBC. The appearance of the cells changes with the addition of dextran 500, such that at 0.5 g/dL (Figure 1b) cells begin to flatten with increased contact area. Further increases of dextran concentration (Figures 1c and 1d) yielded a noticeable reduction of bright or gray spots resulting in much darker cell images, thus indicating closer contact over essentially the entire cell surface.
Figure 1.

Interference Reflection Microscopy (IRM) images of RBC settled onto albumin coated glass surfaces. RBC were suspended in dextran-free buffer (a) or in solutions containing 0.5 g/dL (b), 1.0 g/dL (c) or 2.0 g/dL (d) 500 kDa dextran, allowed to settle for three minutes, then promptly examined by IRM. Darker areas of the cell-surface images indicate less separation between the two surfaces (see text).
Differential interference contrast (DIC) images of cells settled onto albumin-coated glass also indicated that the shape of the settled cell changes in the presence of dextran. Figure 2 presents DIC images of the cell-glass surface interface for RBC suspended in either dextran-free PBS or in 1 g/dL dextran 500 and allowed to settle for three minutes; light intensity versus optical shear axis traces are also shown. Both the images and the traces clearly indicate that the normal biconcave morphology seen in PBS (Figure 2a) is replaced by a flattened shape in the dextran solution (Figure 2b). Thus, both Figures 1 and 2 provide qualitative evidence indicating enhanced contact for RBC suspended in dextran 500 solutions.
Figure 2.

Differential Interference Contrast images and line scans of RBC settled onto an albumin coated glass surface for cells suspended in dextran-free buffer (a) or in a solution containing 1.0 g/dL 500 kDa dextran 500 kDa (b).
Settling time-shear stress relations
Figure 3A and 3B present adhesion-time results at two levels of shear stress for cells in polymer-free PBS or in PBS plus 0.5 g/dL dextran 500. At time zero about 90% of all settled cells adhere in the presence of dextran compared to only 14% in the polymer-free solution. This difference in cell adhesion becomes even more evident when examining the time dependence of the cells retained at constant shear stress: 1) At 0.30 Pa (Figure 3A), only about 10% of the cells in the dextran solution are removed after 100 sec, whereas in polymer-free PBS about one-third of the cells are removed; 2) At 0.75 Pa only one percent of cells in polymer-free PBS remain after 10 seconds and no cells are retained after 100 seconds, whereas at 100 sec about 20% of the cells settled in dextran remain attached.
Figure 3.

Percentage of RBC remaining attached to albumin-coated glass under various experimental conditions, calculated as cells/area at specific situation divided by cell/area at the end of settling and prior to an applied stress greater than 0.07 Pa (see Methods). A,B: Cell attachment versus flow time at 0.30 Pa (A) or 0.75 Pa (B) for cells suspended in dextran-free buffer or 0.5 g/dL 500 kDa dextran and allowed to settle for three minutes. C,D: Cell attachment versus settling time for cells suspended in dextran-free buffer or 0.5 g/dL immediately prior to 0.75 Pa (C) or for 0.75 Pa applied for 100 sec (D). E,F: Cell attachment versus concentration for 10, 70 and 500 kDa dextran immediately prior to 0.75 Pa (E) or for 0.75 Pa applied for 100 sec. The horizontal dotted line in 3E indicates the percentage for cells in dextran-free buffer.
Figure 3C and 3D compare the impact of settling time on adhesion efficiency and adhesion strength in polymer-free PBS or in PBS containing 0.5 g/dL dextran 500. In these studies, cells were allowed to settle for various times, rinsed, exposed to a constant wall shear stress of 0.75 Pa, and the percentage of remaining RBC determined at fixed times. At zero time (Figure 3C), a one minute settling time in dextran left about 60% of the cells adherent, and all cells resisted detachment after a settling time of ≥6 minutes and thus every settled cell remained at the end of the rinsing period. In contrast, at zero time a one minute settling time in polymer-free PBS left only 3% of settled cells adherent and even after 24 minutes only 80 % of the settled cells remained. At 100 sec exposure to 0.75 Pa (Figure 3D) the effects of settling time became more evident, especially at longer times: for a 24 minute settling period most of cells in dextran-free PBS were washed away with only about 3% remained adherent, whereas if the cells settled in the presence of dextran 500 kDa approximately 70% of the cells were still attached.
Molecular weight and concentration effects
The effects of polymer molecular weight and polymer concentration on RBC adhesion are shown in Figure 3E and 3F. In this set of experiments the settling time was three minutes and the percentage of cells retained shown after applying 0.75 Pa for 0 and 100 sec. As shown in these figures, 10 kDa dextran had no meaningful impact on RBC adhesion for concentrations up to 5 g/dL, although a slight decrease in adhesion was noted for 5 g/dL at zero time (Figure 3E); no remaining cells were observed at 100 seconds (Figure 3F). In contrast, RBC adhesion in solutions containing either 70 kDa or 500 kDa dextran exhibited a strong dependence on concentration, with both the number of cells adhering and adhesion strength increasing with polymer concentration. Polymer molecular weight also affected adhesion, with about a 4-fold greater concentration of 70 kDa dextran required to achieve the same adhesion as 500 kDa dextran.
Discussion
The results presented above clearly illustrate the impact of 70 kDa and 500 kDa dextran on RBC-surface interactions. An alternative approach for presenting these results and for quantifying adhesion strength under different conditions is to evaluate dissociation rates or inverse lifetimes. We chose to model the adhesion process with first order kinetics: dN = −koffNdt, with N the number of adherent cells and koff the dissociation rate, where koff reflects adhesion strength. Experimental results presented in Figure 3 were fitted to the solution of this simple differential equation to obtain koff, with the results shown in Figure 4.
Figure 4.

Calculated koff values for cells suspended in dextran-free buffer or in dextran solutions. A: Effect of wall shear stress (log scale) for cells allowed to settle (st) for three minutes. B: Effect of settling time (st) prior to exposing cells to 0.75 Pa. C: Effect of dextran concentration for cells allowed to settle (st) for three minutes then exposed to 0.75 Pa. The horizontal dotted line in 4C indicates the percentage for cells in dextran-free buffer.
Figure 4A shows the dissociation rate as function of shear rate for RBC in either 0.5% dextran 500 kDa or polymer-free PBS and a settling time of three minutes. As expected, koff increases with increasing shear. In addition, there is a marked difference between the polymer-free and polymer-containing media: koff is one to two orders of magnitude higher for the dextran-free medium. The dissociation rate is also markedly affected by settling time (Figure 4B), with koff decreasing with increasing time. Again, however, the results for the two suspending media are different: the dissociation rate for cells in PBS is much higher and relatively insensitive to time, whereas koff for cells in dextran decreases rapidly with time. Lastly, Figure 4C illustrates the effects of dextran concentration and molecular weight on koff for cells allowed to settle for three minutes: 1) concentration effects are non-existent for 10 kDa, with its koff equal to that for dextran-free PBS; 2) koff values for both 70 kDa and 500 kDa dextran decrease, by one to two orders of magnitude, with increasing concentration; 3) at equal values of koff (i.e., 0.1 s-1), a 4-fold higher concentration of 70 kDa is required.
Given the association between dextran molecular weight and adhesion, one could speculate that our results arise due to dextran binding to the RBC surface and the coated slide, thereby “bridging” the gap and generating an attractive force if the hydrated size of the polymer is sufficiently large. However, it is possible minimize or eliminate this possibility. First, dextran is a neutral, uncharged polymer without the ability to develop attractive electrostatic interactions with the surfaces. Secondly, RBC lack specific binding “sites” for dextran and whatever adsorption occurs is weak and non-specific, with the magnitude of any adsorption questionable due to measurement difficulties [18]. In addition we and others have shown that dextran is depleted from the RBC surface [8, 12, 19]. Consequently, our findings suggest that the observed attractive forces have their origin in polymer depletion near the RBC and coated glass surfaces. The lower polymer concentrations at the surfaces compared to that of the suspending phase result in solvent displacement into the bulk phase and hence depletion interaction. Due to this interaction, an attractive force develops [9]. RBC allowed to settle in a polymer-free medium maintain the biconcave shape, with only a small area of contact between the cell and the surface (Figure 1). Conversely, addition of an appropriate size polymer results in a depletion layer at both surfaces and much greater contact between the two surfaces (Figure 1).
Finally, it is of interest to evaluate the magnitude of forces that can be expected due to depletion interaction. Depletion affinity (AD) can be written as [9]:
| (1) |
where Δ is the depletion layer thickness, Π the osmotic pressure and d the distance between the two surfaces. In case of so-called non-smooth, hairy surfaces such as the RBC with its glycocalyx, it is also necessary to consider the thickness δ of this attached layer and the penetration of the polymer into this layer. For low polymer concentrations Π increases linearly with concentration c, and the depletion layer thickness Δ can be assumed to be constant, approximately equal to the polymer’s hydrodynamic radius of gyration Rg [4]. Thus AD can be expressed as:
| (2) |
where R, T and M are the gas constant, absolute temperature and the molecular weight of the polymer. In Figure 5, Equation 2 was used to calculate the affinity between two surfaces suspended in either solutions of dextran 70 kDa (RG = 7.4 nm) or dextran 500 kDa (RG = 19.7 nm) for surface separations (i.e., d) of 0, 10 and 14 nm. Note that for 500 kDa dextran at 0.5 g/dL (10 μM), the depletion affinity is about 1 μJ/m2 and only slightly sensitive to surface separations. Because of the smaller depletion layer thickness the calculated values for 70 kDa dextran indicate greater sensitivity to separation. Based on our experimental data (Figures 3 and 4), 2g/dl of dextran 70kDa (290 μM) has about the same effect as 0.5g/dl of dextran 500kDa. Thus based on this model we can conclude that the distance between the adjacent surfaces should be around 10 to 14 nm and that the depletion affinities we are looking at are in the range of a few μJ/m2. Note that these calculated values are consistent with measured RBC affinity findings obtained via determining RBC deformation in various dextran solutions [20, 21].
Figure 5.
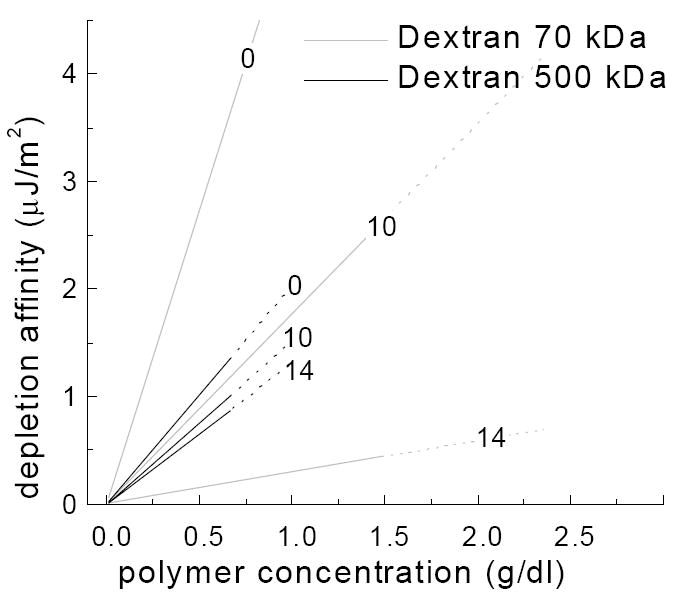
Calculated depletion affinity-polymer concentration relations for 70 or 500 kDa dextran at surface separations of 0, 10 and 14 nm (Equation 2, see text). Note the minimal effects of separation distance for 500 kDa versus the greater effects for 70 kDa.
In overview, we conclude that our results are in agreement with the hypothesis that RBC adhesion can be significantly enhanced by neutral polymer induced depletion interaction, with the extent of this effect determined, in part, by polymer molecular size. As shown in Figure 4, the smallest dextran employed (10 kDa, Rg = 2.8 nm) had no effect on cell adhesion: it is too small to establish a meaningful depletion layer, with the depletion layer of this small dextran buried within the cell’s glycocalyx. Thus, before this thin depletion layer could lead to any attractive interaction, glycocalyx factors (e.g., steric interaction and electrostatic repulsion) prevent adjacent surfaces from becoming sufficiently close. However, for larger dextrans, the depletion layer reaches beyond the glycocalyx, thus leading to the observed impact on cell adhesion.
Further, we suggest that our findings may have physiological and biomedical implications. For example, in pathological conditions large differences in RBC interaction have been observed and our recent understanding of red cell aggregation suggests that these differences are likely due to altered depletion forces between these cells [22, 23]. Age-separated human RBC also exhibit marked differences in affinity, with older, denser cells having 3-fold greater affinity than younger, less dense cells in both plasma and polymer solutions [9]. Thus it may be useful to utilize these altered depletion forces for biotechnological applications such as cell separation, and to consider them when looking at the biocompatibility of scaffolds or other biomaterials. While the experimental system used herein represents a rather simple in vitro model, our results also suggest possible in vivo significance of depletion forces cell on adhesion (e.g., RBC, white cell or platelet interactions with endothelial cells): depletion interaction may help promote cell contact, thereby allowing more-specific adhesive mechanisms to take place.
Acknowledgments
We thank the USC center for Liver Diseases (NIH 1 P30 DK48522) for providing the confocal scanning microscope. This work was supported by National Institute of Health Grants HL 15722 and HL 70595 and by the Ministry of Education, Singapore, and A*Star, Singapore.
Footnotes
Publisher's Disclaimer: This is a PDF file of an unedited manuscript that has been accepted for publication. As a service to our customers we are providing this early version of the manuscript. The manuscript will undergo copyediting, typesetting, and review of the resulting proof before it is published in its final citable form. Please note that during the production process errors may be discovered which could affect the content, and all legal disclaimers that apply to the journal pertain.
References
- 1.Setty BNY, Kulkarni S, Stuart MJ. Role of erythrocyte phosphatidylserine in sickle red cell-endothelial adhesion. Blood. 2002;99:1564–1571. doi: 10.1182/blood.v99.5.1564. [DOI] [PubMed] [Google Scholar]
- 2.Wautier JL, Wautier MP. Erythrocytes and platelet adhesion to endothelium are mediated by specialized molecules. Clinical Hemorheology and Microcirculation. 2004;30:181–184. [PubMed] [Google Scholar]
- 3.Jenkins P, Vincent B. Depletion flocculation of nonaqueous dispersions containing binary mixtures of nonadsorbing polymers. Evidence for Nonequilibrium effects. Langmuir. 1996;12:3107–3113. [Google Scholar]
- 4.Vincent B. The Calculation of Depletion Layer Thickness as a Function of Bulk Polymer Concentration. Colloids and Surfaces. 1990;50:241–249. [Google Scholar]
- 5.Vincent B, Edwards J, Emmett S, Jones A. Depletion flocculation in dispersions of sterically-stabilised particles (“soft spheres”) Colloids and Surfaces. 1986;18:261–281. [Google Scholar]
- 6.Feign RI, Napper DH. Depletion stabilization and depletion flocculation. J Colloid Interface Sci. 1980;75:525–541. [Google Scholar]
- 7.Asakura S, Oosawa F. On interaction bewteen two bodies immersed in a solution of macromolecules. J Chem Phys. 1954;22:1255–1256. [Google Scholar]
- 8.Bäumler H, Donath E, Krabi A, Knippel W, Budde A, Kiesewetter H. Electrophoresis of human red blood cells and platelets. Evidence for depletion of dextran. Biorheology. 1996;33:333–351. doi: 10.1016/0006-355x(96)00026-1. [DOI] [PubMed] [Google Scholar]
- 9.Neu B, Meiselman HJ. Depletion-mediated red blood cell aggregation in polymer solutions. Biophysical Journal. 2002;83:2482–2490. doi: 10.1016/S0006-3495(02)75259-4. [DOI] [PMC free article] [PubMed] [Google Scholar]
- 10.Cabel M, Meiselman HJ, Popel AS, Johnson PC. Contribution of red blood cell aggregation to venous vascular resistance in skeletal muscle. American Journal of Physiology-Heart and Circulatory Physiology. 1997;41:H1020–H1032. doi: 10.1152/ajpheart.1997.272.2.H1020. [DOI] [PubMed] [Google Scholar]
- 11.Lowe GDO. Clinical Blood Rheology. CRC Press; Boca Raton, Florida: 1988. [Google Scholar]
- 12.Neu B, Meiselman HJ. Sedimentation and electrophoretic mobility behavior of human red blood cells in various dextran solutions. Langmuir. 2001;17:7973–7975. [Google Scholar]
- 13.Neu B, Meiselman HJ, Bäumler H. Electrophoretic mobility of human erythrocytes in the presence of poly(styrene sulfonate) Electrophoresis. 2002;23:2363–2368. doi: 10.1002/1522-2683(200208)23:15<2363::AID-ELPS2363>3.0.CO;2-Y. [DOI] [PubMed] [Google Scholar]
- 14.Cooke BM, Usami S, Perry I, Nash GB. A simplified method for culture of endothelial cells and analysis of adhesion of blood cells under conditions of flow. Microvascular Research. 1993;45:33–45. doi: 10.1006/mvre.1993.1004. [DOI] [PubMed] [Google Scholar]
- 15.Bird RB, Stewart WE, Lightfoot EN. Transport Phenomena. John Wiley and Sons; New York: 1960. [Google Scholar]
- 16.Gingell D, Todd I. Interference reflection microscopy. A quantitative theory for image interpretation and its application to cell-substratum separation measurement. Biophysical Journal. 1979;26:507–526. doi: 10.1016/S0006-3495(79)85268-6. [DOI] [PMC free article] [PubMed] [Google Scholar]
- 17.Mohandas N, Hochmuth RM, Spaeth EE. Adhesion of red cells to foreign surfaces in the presence of flow. J Biomed Mater Res. 1974;8:119–136. doi: 10.1002/jbm.820080203. [DOI] [PubMed] [Google Scholar]
- 18.Janzen J, Brooks DE. In: Interfacial Phenomena in Biological Systems. Bender M, editor. Marcel Dekker; New York: 1991. pp. 193–250. [Google Scholar]
- 19.Armstrong JK, Wenby RB, Meiselman HJ, Fisher TC. The hydrodynamic radii of macromolecules and their effect on red blood cell aggregation. Biophys J. 2004;87:4259–4270. doi: 10.1529/biophysj.104.047746. [DOI] [PMC free article] [PubMed] [Google Scholar]
- 20.Buxbaum K, Evans E, Brooks DE. Quantitation of surface affinities of red blood cells in dextran solutions and plasma. Biochemistry. 1982;21:3235–3239. doi: 10.1021/bi00256a032. [DOI] [PubMed] [Google Scholar]
- 21.Evans EA, Parsegian VA. Energetics of membrane deformation and adhesion in cell and vesicle aggregation. Ann N Y Acad Sci. 1983;416:13–33. doi: 10.1111/j.1749-6632.1983.tb35176.x. [DOI] [PubMed] [Google Scholar]
- 22.Neu B, Sowemimo-Coker S, Meiselman H. Cell-Cell Affinity of Senescent Human Erythrocytes. Biophysical Journal. 2003;85:75–84. doi: 10.1016/S0006-3495(03)74456-7. [DOI] [PMC free article] [PubMed] [Google Scholar]
- 23.Rampling MW, Meiselman HJ, Neu B, Baskurt OK. Influence of cell-specific factors on red blood cell aggregation. Biorheology. 2004;41:91–112. [PubMed] [Google Scholar]