Abstract
Glucocerebrosidase (GC) catalyzes the hydrolysis of β-glucocerebroside to glucose and ceramide in lysosomes. Mutations in the glucocerebrosidase gene (GBA) result in Gaucher disease, an autosomal recessive lysosomal storage disorder. Many of the mutations encountered in patients with Gaucher disease are missense alterations that may cause misfolding, decreased stability and/or mistrafficking of this lysosomal protein. Some inhibitors of GC have been shown to act as chemical chaperones, stabilizing the conformation of mutant proteins and thus restoring their function. High-throughput screening (HTS) of small molecule libraries for such compounds with potential for chaperone therapy requires an accurate, reproducible and sensitive assay method. We have adapted and optimized two fluorogenic GC enzyme assays and miniaturized them into the 1536-well plate format for HTS. The two substrates, 4-methylumbelliferyl β-D-glucopyranoside and resorufin β-D-glucopyranoside, have Km values of 768 μM and 33 μM, respectively, and different emission spectra. Paired screening with the two assays helps to eliminate false inference of activity due to autofluorescence or fluorescence quenching by the screened compounds. Test screens with the LOPAC library indicated that both assays were robust for HTS, and gave comparable results for GC inhibitor activities. These two assays can be used to identify both GC activators and inhibitors with potential therapeutic value.
Keywords: glucocerebrosidase, beta-glucosidase, Gaucher disease, small molecule, assay optimization, assay miniaturization, HTS, quantitative high throughput screening, qHTS
Introduction
Glucocerebrosidase (GC, EC3.2.1.45) is a membrane-associated lysosomal hydrolase that cleaves the glucose moiety from the glycolipid glucocerebroside to produce ceramide and glucose. The deficiency of GC activity results in Gaucher disease, a recessively inherited lysosomal storage disorder caused by mutations in GBA, the gene encoding GC [1-4]. Gaucher disease, encountered world-wide, is the most common lysosomal storage disorder, and is among the most commonly inherited disorders in Ashkenazi Jews, where the carrier frequency is about 1 in 15. The clinical manifestations most frequently encountered in patients with Gaucher disease include organomegaly, anemia, thrombocytopenia and bone involvement. There are, however, a range of associated clinical features, including non-neurologic and neuronopathic forms of the disorder, and patients can present at any age. The current therapy for Gaucher disease, enzyme replacement therapy (ERT), while effectively reversing the systemic manifestations of the disease, is extremely expensive and does not treat the brain manifestations. Almost 300 mutations in GBA have been described, the majority of which are amino acid substitutions [5]. These can result in misfolding, instability and mistrafficking of the GC protein, and are believed to result in the degradation of the newly synthesized enzyme before it reaches its functional site, the lysosome [6, 7]. It has been reported that small molecule GC inhibitors can function as chemical chaperones to restore the mutated GC activity by correcting the folding/mistrafficking of the protein [8-10]. In this proposed mechanism, the inhibitor reversibly binds to the mutant protein, thus stabilizing the tertiary structure, preventing degradation and facilitating delivery to the lysosome, where the abundant substrate displaces the inhibitor. Inhibitors with a low IC50 are hypothesized to be better candidates for therapeutic applications, as lower doses would be needed to achieve the desired effect. The ability of some GC inhibitors to function as chemical chaperones has been established by treating mutant cell lines with the compounds and demonstrating increased enzymatic activity and lysosomal co-localization [11, 12]. Although a correlation between inhibitor activity and chaperone ability has not yet been established, these small molecule chaperones are potential new treatments for Gaucher disease.
While several GC inhibitors currently are being considered for chaperone therapy, most are iminosugar derivatives, which are limited in function, stability, permeability and selectivity. Conduritol β-epoxide (CBE), a weak inhibitor of GC, possesses an epoxide functionality known to be metabolically unstable [13], and it covalently binds to multiple enzymes. Active site-targeted compounds, such as deoxynojirimycin analogs, isofagomine and other iminosugars, have limited permeability due to their hydrophilic properties, can cross-react with other lysosomal hydrolases and are only effective for some mutant forms of GC [3, 14]. Activators of GC have not yet been identified. Thus, more global approaches for identifying new small molecule inhibitors or activators are needed both as research tools and as leads for the development of new chemical chaperones for Gaucher therapy. Such screens are dependent on assays that can be performed efficiently in the miniaturized format with small volumes [15].
In vitro enzyme activity assays were developed initially for the diagnosis of Gaucher disease. Several types of GC enzyme assays have been reported to measure the enzyme activity in vitro, including fluorescence [16, 17]and chromogenic assays [18, 19]. The fluorescence-based assay is simple and sensitive. Several different pro-fluorescent substrates have been used in the GC enzyme assay, including 4-methylumbelliferyl-β-D-glucopyranoside (4MU-β-Glc) [20], resorufin-β-D-glucopyranoside (Res-β-Glc) [21]and fluorescein di-β-D-glucopyranoside (Flu-β-Glc) [22]. These enzyme assays principally have been used in clinical laboratories for the diagnosis and classification of Gaucher disease. Only the GC enzyme assay using 4MU-β-Glc has been reported for use in compound screening, but in low-throughput format [8]. We report the optimization and miniaturization of two fluorogenic GC enzymatic assays for compound screening in a 1536-well plate format. These assays formed the basis for inhibitor screening done using a larger compound library [12], and also have potential for use in the identification of GC activators.
Methods
Chemicals
Resorufin β-D-glucopyranoside (Res-β-Glc), a red pro-fluorescent substrate, was purchased from Marker Gene Technology Inc. (Eugene, OR). 4-methylumbelliferyl β-D-glucopyranoside (4MU-β-Glc), a blue pro-fluorescent substrate, was purchased from Sigma-Aldrich (St. Louis, MO), as were citric acid, potassium phosphate trihydrate, Tween-20, glycine, and sodium hydroxide. Taurocholic acid sodium salt was from CalbioChem (a subsidiary of EMD Bioscience, San Diego, CA). Conduritol β-epoxide (CBE), a known inhibitor of GC, was obtained from Biomol (Plymouth Meeting, PA). N-(n-nonyl)deoxynojirimycin (nonyl-DNJ) was purchased from Toronto Research Chemicals (Toronto, Canada). The Library of Pharmacologically Active Compounds (LOPAC), a 1280-compound screening validation library, was purchased from Sigma-Aldrich.
Glucocerebrosidase (GC) was obtained from residual solution after clinical infusions of imiglucerase (Cerezyme®, Genzyme Co., Mr = 60,430), with a specific activity of 42.2 units/mg and 14 units/ml. Glycerol was added to the enzyme solution to 30%, yielding a final enzyme concentration of 3.82 μM, and small aliquots were stored at -80°C. GC enzyme activity was found to be stable in this stock solution after storage at -80°C for up to two years (data not shown).
Buffers
The assay buffer was 50 mM citric acid, 176 mM K2HPO4, pH 5.9, 0.01% Tween-20 and 10 mM sodium taurocholate. The assay buffer was stored at 4 °C for use up to 6 months. The stop solution consisted of 1M sodium hydroxide, 1M glycine, pH 10.
Instruments for liquid handling and plate detection
An FRD™ automated microvolume dispensing station (Aurora Discovery, San Diego, CA) was used to dispense reagents into 1536-well plates at volumes from 0.5-3 μl. Initially, the compounds were serially diluted in DMSO in 384-well plates using a CyBi®-Well dispensing station with a 384-well head (Cybio, Inc. Woburn, MA), and then reformatted into 1536-well plates at 7 μl/well. Nanoliter volumes of compounds dissolved in DMSO were transferred to the 1536-well assay plate using an automated pin-tool station (Kalypsys®, San Diego, CA). A ViewLux CCD-based imaging plate reader (PerkinElmer, Boston, MA) was used for fluorescence detection at the speed of 30 sec per plate. A Safire2™ 4-monochromator scanning fluorescence plate reader (Tecan, Männedorf, Switzerland) was used for determination of the fluorescence excitation and emission spectra.
Res-β-Glc (red) GC enzyme assay
2 μl/well of GC solution was added to a 1536-well black plate, followed by 23 nl of each compound in DMSO. The final DMSO concentration in the assay plates was under 0.5%. The negative controls received 2 μl/well of assay buffer instead of enzyme. After a 5 min incubation at room temperature (RT, ~21°C), the enzyme reaction was initiated by addition of 1 μl of substrate solution, followed by 20 min incubation at RT. The final concentrations of enzyme and substrate (Res-β-Glc) were 1.9 nM and 30 μM, respectively. Fluorescence was read at an excitation of 570 (±10) nm and an emission of 610 (±10) nm, which yielded the optimal signal-to-basal ratio.
4MU-β-Glc (blue) GC enzyme assay
The assay was performed using the same procedure as the red GC enzyme assay, except the reaction time was extended to 40 min. The final concentration of the enzyme and substrate were 1.9 nM and 800 μM, respectively. The reaction was terminated by addition of 3 μl stop solution, raising the pH to 10, which optimized fluorescence intensity output. Fluorescence was measured at an excitation of 365 (±10) nm and an emission of 440 (±10) nm.
For the pH effect study, the assay buffers were made by titration of the citric acid buffer with varying amounts of 1M dipotassium phosphate to yield buffers ranging from pH 4.5-7.4.
Enzyme kinetic assays
Both the “red” and “blue” GC enzyme kinetic assays were carried out in a 384-well plate format using 1.9 nM enzyme with varying concentrations of substrate. Initially, 20 μl/well of enzyme was added to a 384-well plate. The enzyme reaction was initiated by addition of 10 μl/well of substrate solution at varying concentrations. In the “blue” assay, the 1M 4MU-β-Glc stock solution was serially diluted 1:2 to give eight concentrations. The final concentrations of substrate in each assay were 3000, 1500, 750, 375, 188, 93.8, 46.9 and 23.4 μM. Six different plates were used in the “blue” assay to determine different time points. After incubation at RT for 2, 4, 6, 8, 10 and 12 min, 30 μl/well stop solution was added to terminate the reaction. A standard curve of the free fluorophore, 4-methylumbelliferone, in the same volume of assay buffer and stop solution was generated for the calculation of enzyme product. The plates were read in a ViewLux plate reader at 440 nm.
The “red” assay was performed as above, except that no stop solution was required. The 20 mM Res-β-Glc stock was diluted to give final concentrations of 100, 60, 40, 20, 10, 5 and 2.5 μM. Only one plate was used and fluorescence intensity at 610 nm was measured at 2 min intervals in the ViewLux reader. A standard curve was prepared with serial dilutions of the free fluorophore, resorufin, in the same volume of assay buffer.
qHTS of a control compound library
Quantitative high-throughput screening (qHTS) is a method for screening large compound libraries at multiple concentrations simultaneously [23]. The Library of Pharmacologically Active Compounds (LOPAC), a screening validation library containing 1280 compounds, was purchased as 10 mM stock solutions in DMSO. All compounds in the LOPAC Library were serially diluted in DMSO at a ratio of 1:2.236 to fifteen concentrations in 384-well plates. Four sets of the inter-plate dilution plates were subsequently reformatted into one set of 1536-well plates, with compound concentrations ranging from 0.29 μM to 10 mM. The final compound concentrations in a 3 μl assay volume ranged from 1.9 nM to 66.7 μM.
Data analysis
The primary screen data was first analyzed using customized software developed internally. The results were further analyzed by Genedata Screener®, a curve fitting program (GeneData, Basel, Switzerland). The results from confirmation experiments, enzyme kinetics and selectivity assays were analyzed with Prism®(GraphPad, San Diego, CA).
Results and Discussion
Optimal fluorescence excitation and emission
Hydrolysis of the pro-fluorescence substrates, 4MU-β-Glc and Res-β-Glc, by GC resulted in products with emissions at the blue and red regions of fluorescence spectrum, respectively. In order to determine the optimal excitation and emission wavelengths, a spectral scan of both products was carried out using a scanning fluorescence plate reader. For 4-methylumbelliferone, the “blue” assay fluorophore, excitation and emission peaks were 370 nm and 440 nm, respectively (Fig. 1a). For resorufin, the “red” GC enzyme assay fluorophore, an excitation peak at 573 nm and an emission peak at 590 nm were identified (Fig. 1b). Because the two peaks were so close to each other, the use of an emission filter at 590 nm dramatically reduced the signal-to-basal ratio of this assay. Using a pair of filters at Ex = 570 (±10) nm and Em = 610 (±10) nm yielded an optimal signal-to-noise ratio for this assay, although the total fluorescence intensity was reduced by half.
Fig. (1).
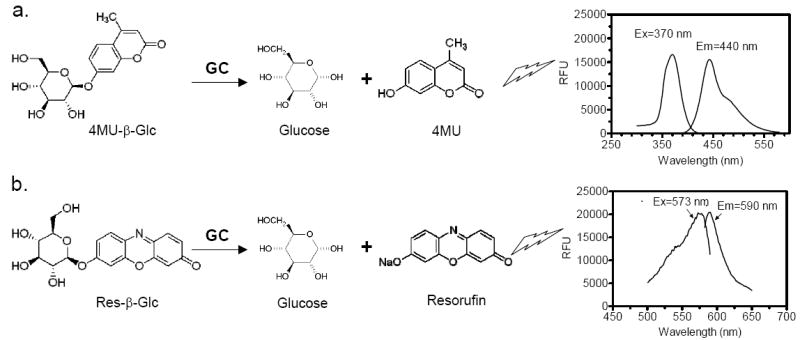
Chemical structures and fluorescence spectra of substrates for the GC assays. (a) The “blue” GC enzyme assay. The pro-fluorescence substrate 4MU-β-Glc is hydrolyzed to form two products, 4-methylumbelliferone, with an excitation peak of 370 nm and an emission peak of 440 nm, and glucose. (b) The “red” GC enzyme assay. The pro-fluorescence substrate Res-β-Glc is hydrolyzed to form two products, resorufin, with an excitation peak of 573 nm and an emission peak of 590 nm, and glucose.
4MU has a pKa of 7.8, and its fluorescence intensity at the acidic pH (5.9) of the GC assay is too low to be measured. The 4MU-β-Glc assay, therefore, requires the addition of a stop solution to raise the pH to increase 4MU fluorescence. Resorufin, on the other hand, has a lower pKa (6.0), and its fluorescence intensity is substantial at the assay pH. This allowed multiple readings over time for kinetic analysis using the Res-β-Glc assay.
Effects of pH and sodium taurocholate
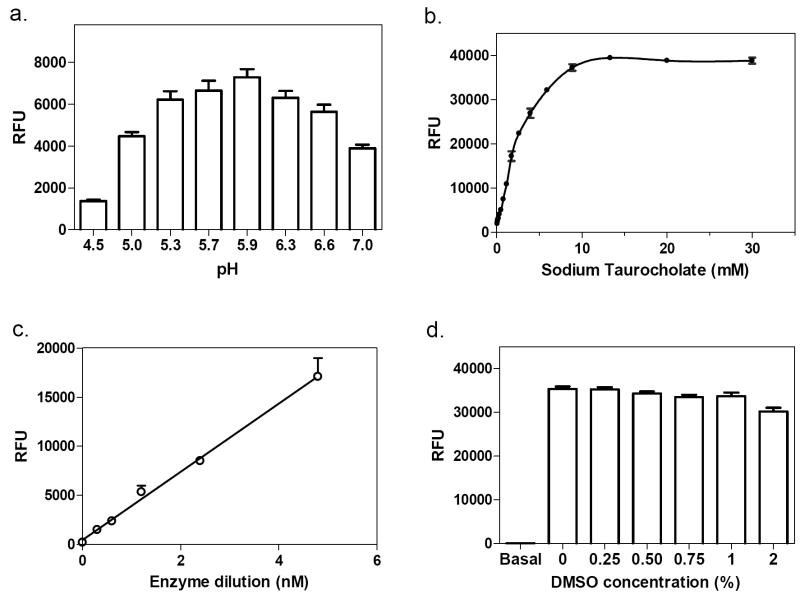
GC, a lysosomal enzyme, functions better at acidic pH. The pH of GC assay buffers tested in the literature ranged from pH 3-8 [16]. We examined the effect of pH on both assays using assay buffers ranging from pH 4.5 to 7.4. GC enzyme activity was reduced 47% at pH 7 compared with that at pH 5.9. The optimal pH for both GC enzyme assays was 5.9 (Fig. 2a).
Fig. (2).
Optimization of the “blue” GC assay. (a) GC activity at different pH. The optimal pH was 5.9. (b) Effect of sodium taurocholate. GC activity increased with increasing concentration of sodium taurocholate, reaching a plateau at 15 mM. (c) Enzyme concentration-response. The enzyme activity increased nearly linearly from 0.3 to 19.1 nM. (d) DMSO tolerance. DMSO concentrations up to 1% showed no effect on the enzyme reaction.
It was reported that sodium taurocholate, a bile salt, is required for determining enzyme activity of GC and other lysosomal enzymes in vitro [24-28]. In our assays, we confirmed that GC activity in vitro is dependent on sodium taurocholate. In the “blue” GC assay, activity increased with an increase in sodium taurocholate concentration (Fig. 2b). A similar result was found for the “red” GC enzyme assay (data not shown). 10 mM sodium taurocholate was selected for the assay buffer for both assays, as the enzyme activity reached a plateau at this concentration.
Enzyme concentration and DMSO effect
The enzyme concentration-response was measured by varying the enzyme concentration at a fixed substrate concentration. The enzyme activity increased linearly with an increase in GC enzyme concentrations from 0.3 to 19.1 nM (Fig. 2c). An enzyme concentration of 1.9 nM was selected for the assay because the fluorescence intensity was adequate, while the substrate consumption was 3.6%. An incubation of 40 min at RT was selected because the enzyme activity was linear during a 60 min incubation (data not shown). We also found that DMSO at concentrations up to 1% did not alter the enzyme activity (Fig. 2d). Similar optimal conditions were found for the “red” assay, although only a 20 min incubation at RT was required.
Enzyme kinetics
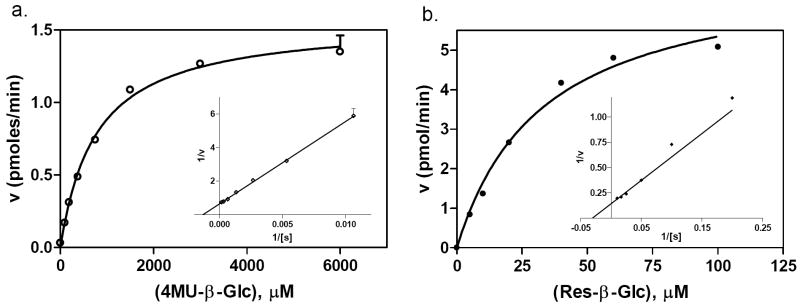
The enzyme kinetics for both GC assays were determined using 1.9 nM enzyme and varied substrate concentrations. The Km values were 768 and 33.0 μM for the “blue” assay and “red” assays, respectively (Fig. 3). Based on the Km values, 800 μM of 4MU-β-Glc was chosen for the “blue” assay and 30 μM of Res-β-Glc was selected for the “red” assay.
Fig. (3).
Enzyme kinetics. (a) The “blue” assay had a Km of 768 μM and a Vmax of 1.56 pmol/min. (b) The “red” assay had a Km of 33.0 μM and a Vmax of 7.11 pmol/min.
IC50 values of known GC inhibitors
Two known GC inhibitors, CBE and nonyl-DNJ, were tested in both enzyme assays (Fig. 4). The IC50 value of CBE in the “blue” GC assay was 15.4 μM and 13.0 μM in the “red” GC assay. We found that the solution of CBE in DMSO was unstable at RT, as the IC50 value of CBE shifted from 2- to 10-fold when the CBE solutions were left at RT for more than a few hours (data not shown). The IC50 values of nonyl-DNJ were 0.13 μM in the “blue” GC assay and 0.23 μM in the “red” GC assay. The similar potencies and concentration-response curves of two known GC inhibitors indicated the compatibility of these two assays for the compound screen.
Fig. (4).
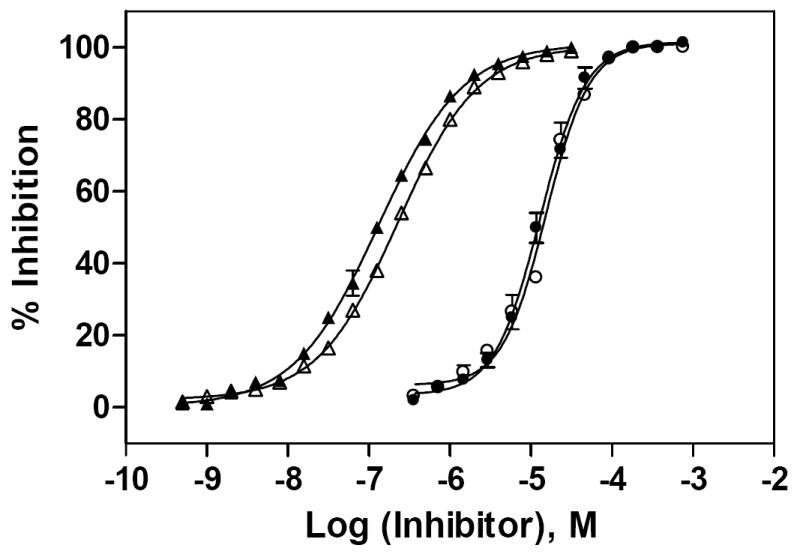
Concentration-responses of two known GC inhibitors. IC50 values for CBE and nonyl-DNJ were determined using the “blue” and “red” GC enzyme assays. The substrate concentrations were 800 μM 4MU-β-Glc and 30 μM Res-β-Glc, respectively, and the enzyme concentration was 1.9 nM in both assays. The IC50 value for CBE was 15.4 μM in the “blue” (○) and 13.0 μM in the “red” (●) assay. The IC50 value for nonyl-DNJ was 0.227 μM in the “blue” (□) and 0.132 μM in the “red” (■) assay. The concentration-response curves for each inhibitor were very similar in both assays.
Results of LOPAC library screen
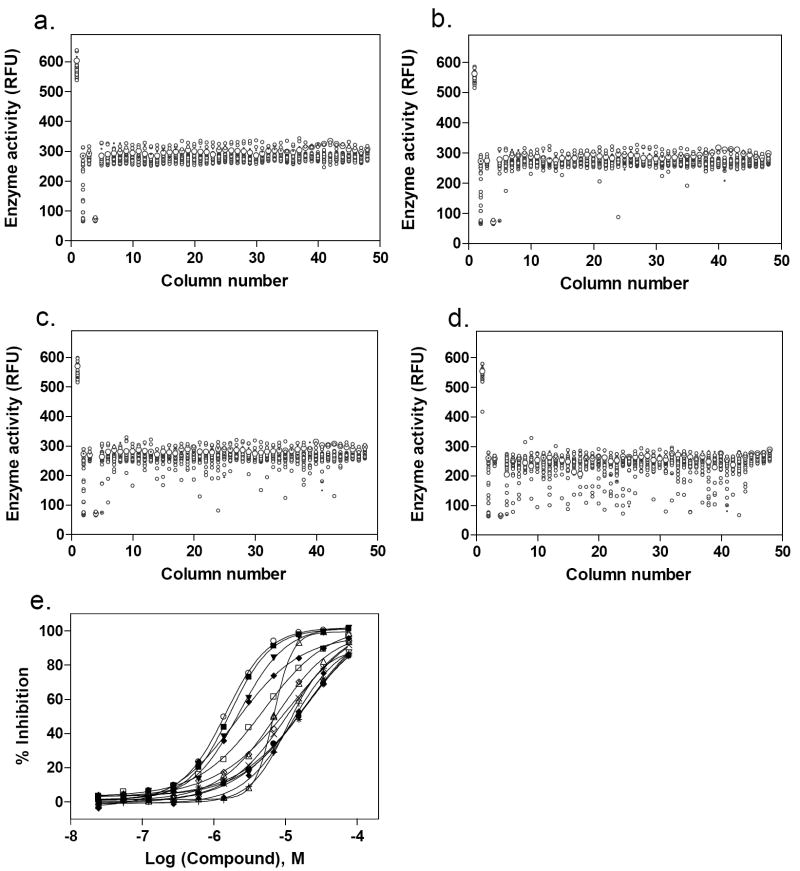
The LOPAC library is a collection of 1,280 pharmacologically active compounds frequently used for HTS assay validation [29, 30]. Both GC assays were tested for use in quantitative high-throughput screening (qHTS) using the LOPAC library in a 1536-well plate format. The compounds were serially diluted in DMSO to 15 concentrations in 384-well plates, which were then reformatted into one set of 1536-well plates. GC assays using either 4MU-β-Glc (“blue”) or Res-β-Glc (“red”) were performed in 3 μl volume as described in the Methods. Control assays were run with DMSO alone. The average signal-to-basal ratio from the control plate was 4.1, and the CV and Z’ factor[31] were 5.5% and 0.78, respectively, for the “red” GC enzyme assay (Fig. 5a). Similar results were obtained using the “blue” assay (data not shown).
Fig. (5).
Results of the LOPAC library screen using the “red” GC enzyme assay. (a) Scatter plot of the results from the control DMSO plate screen. The signal-to-basal ratio was 4.1-fold with a CV of 5.5% and Z’ factor of 0.78. Scatter plots of the LOPAC library screen at (b) 3.06, (c) 15.3 and (d) 76.7 μM compound concentrations. (e) Concentration-response curves of hits with an IC50 ≤10 μM selected from the LOPAC library screen. 13 active compounds were identified, yielding a hit rate of ~1.0 %.
One of the advantages of qHTS is its use of a dynamic range of compound concentrations, including high concentrations, for the primary screen. Only a single concentration is used in traditional HTS, and requires one or more test screens to determine a concentration that gives a hit rate (number of active compounds divided by the total number of compounds screened) between 0.1 to 0.5 %. In our qHTS of the LOPAC library, as expected, the apparent hit rate increased with increasing compound concentration. The hit rates were 0.2% at 3.06 μM, 0.7% at 15.3 μM and 4.3% at 76.7 μM compound (shown in Fig. 5b, 5c and 5d, respectively). Performing the primary screen simultaneously on multiple concentrations of the library enabled identification of potential hits from a wider range of active concentrations, whereas, if the higher compound concentrations had been used in a traditional single concentration HTS, too many hits would have been produced. Since the concentration-response curves for 15 different compound concentrations were available immediately after the primary screen using qHTS, we selected active compounds by their potencies and curve classes as discussed previously [23]. A total of 13 active compounds were identified with IC50 values of ≤10 μM; using this cutoff, the hit rate was approximately 1% (Fig. 5e).
Hit confirmation
Neat samples of the 13 primary hits were obtained and their activities were determined in the “red” GC enzyme assay. Two of the original 13 compounds were inactive (B-7283, Benserazide and P-4394, Cisplatin). GC inhibitory activity was confirmed for 11 of the 13 compounds and their structures, Sigma ID, IC50 values and reported properties are summarized in Table 1. While four had higher IC50s than observed in the primary screen, the remaining seven had IC50s within two-fold of their primary screen activity. Among the LOPAC compounds screened, several notable inhibitors of GC with micromolar IC50s were discovered: (-)-Ephedrine hemisulfate (1; 0.79μM), 4-Chloromercuribenzoic acid (9; 0.62μM) and Ebselen (10; 0.63μM) (see Table 1). Ephedrine is a well-known sympathomimetic amine with several mechanisms of action, including stimulation of adrenergic receptors and blockage of norepinephrine transporter activity. 4-Chloromercuribenzoic acid is a reactive organic mercury compound that is frequently used as a sulfhydryl reagent. Ebselen is a GSH-peroxidase-like organo-selenium compound that has been reported to exhibit a variety of effects, including anti-inflammatory activity [32]and antioxidant properties [33]. The weaker inhibitors of GC included several modulators of ion channels such as quinoxaline derivatives DNQX (5) and DCQX (4), dimethyl-piperazinium- (6) and piperidinium- (8) containing compounds, and the muscle relaxant Gallamine triethiodide (3) [34]. Iodoacetamide (11) is reported to be a protein alkylating reagent and irreversible enzyme inhibitor, making it inappropriate for use as a chaperone.
Table 1.
Confirmed glucocerebrosidase inhibitors from LOPAC library screening.
| No. | Structure | Sigma ID | IC50a | Compound Name, Reported propertiesb |
|---|---|---|---|---|
| 1 |  |
E-3250 | 0.79 μM |
(-)-Ephedrine hemisulfate Adrenergic stimulant |
| 2 |  |
I-3766 | 2.57 μM |
Isoliquiritigenin Soluble guanylyl cyclase activator and aldose reductase inhibitor |
| 3 |  |
G-8134 | 3.59 μM |
Gallamine triethiodide M2 muscarinic acetylcholine receptor antagonist; muscle relaxant |
| 4 |  |
D-133 | 4.52 μM |
6,7-Dichloroquinoxaline-2,3-doine NAPotent, competitive kainate/quisqualate glutamate receptor antagonist |
| 5 |  |
D-0540 | 4.77 μM |
DNQX M3 muscarinic acetylcholine receptor antagonist |
| 6 | 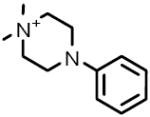 |
D-5891 | 6.80 μM |
1,1-Dimethyl-4-phenyl-piperazinium iodide Nicotinic acetylcholine receptor agonist |
| 7 | 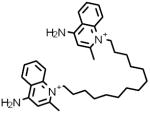 |
D-2064 | 8.26 μM |
Dequalinium analog, C-14 linker Protein kinase C-alpha (PKC-alpha) inhibitor |
| 8 | 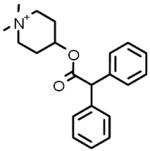 |
D-104 | 8.74 μM |
4-DAMP methiodide Antagonist specific for the strychnine-insensitive glycine binding site of the NMDA glutamate receptor |
| 9 | 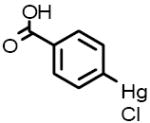 |
C-5913 | 0.62 μM |
4-Chloromercuribenzoic acid Carboxy- and aminopeptidase inhibitor |
| 10 |  |
E-3520 | 0.63 μM |
Ebselen Antioxidant; inhibitsmammalian lipoxygenases and glutathione S-transferase |
| 11 |  |
I-1149 | 7.01 μM |
Iodoacetamide Alkylating reagent for cysteine and histidine residues in proteins; irreversible protein inhibitor |
IC50 determined using the “red” GC assay
Properties as reported in the LOPAC1280 library reference material
In summary, we have adapted and optimized two fluorometric GC assays for HTS in a 1536-well plate format, using two different substrates with fluorescence emissions of 440 nm and 610 nm. Both assays performed comparably in screening for GC inhibitors. The “red” GC enzyme assay is more suitable for HTS, since it does not require the additional step of dispensing stop solution after the incubation, and is less prone to background noise caused by contaminants such as dust and lint. The “blue” GC enzyme can be used to examine the active compounds identified from the primary screen to help eliminate interference by autofluorescing or fluorescence-quenching compounds [15]. qHTS of the LOPAC library with both assays indicated that both were robust for primary screening. We have recently applied the “red” GC assay for qHTS of 60,000 compounds in a 1536-well plate format and used the “blue” GC assay for hit confirmation. Three novel structural classes of GC inhibitors were identified, and two compounds showed a chaperone effect in a cell-based assay [12]. This further demonstrates the robustness and effectiveness of these GC assays. We conclude that both GC enzyme assays are appropriate for HTS and can be used for the identification of both activators and inhibitors of GC.
Acknowledgments
We thank Noel Southall for informatics assistance and discussion, and Paul Shinn and Adam Yasgar for assistance with compound management. This research was supported by the Molecular Libraries Initiative of the NIH Roadmap for Medical Research and the Intramural Research Program of the National Human Genome Research Institute, National Institutes of Health.
Abbreviations
- qHTS
quantitative high-throughput screening
- GC
glucocerebrosidase
- nonyl-DNJ
N-nonyl-deoxynojirimycin
References
- 1.Brady RO. Baillieres Clin Haematol. 1997;10:621–634. doi: 10.1016/s0950-3536(97)80031-5. [DOI] [PubMed] [Google Scholar]
- 2.Sidransky E. Mol Genet Metab. 2004;83:6–15. doi: 10.1016/j.ymgme.2004.08.015. [DOI] [PubMed] [Google Scholar]
- 3.Sawkar AR, D’Haeze W, Kelly JW. Cell Mol Life Sci. 2006;63:1179–1192. doi: 10.1007/s00018-005-5437-0. [DOI] [PMC free article] [PubMed] [Google Scholar]
- 4.Sidransky E, LaMarca ME, Ginns EI. Mol Genet Metab. 2007;90:122–125. doi: 10.1016/j.ymgme.2006.09.007. [DOI] [PubMed] [Google Scholar]
- 5.Hruska KS, LaMarca ME, Scott CR, Sidransky E. Hum Mut. 2008;27:567–83. doi: 10.1002/humu.20676. [DOI] [PubMed] [Google Scholar]
- 6.Zimmer KP, le Coutre P, Aerts HM, Harzer K, Fukuda M, O’Brien JS, Naim HY. J Pathol. 1999;188:407–414. doi: 10.1002/(SICI)1096-9896(199908)188:4<407::AID-PATH377>3.0.CO;2-Z. [DOI] [PubMed] [Google Scholar]
- 7.Ron I, Horowitz M. Hum Mol Genet. 2005;14:2387–2398. doi: 10.1093/hmg/ddi240. [DOI] [PubMed] [Google Scholar]
- 8.Sawkar AR, Cheng WC, Beutler E, Wong CH, Balch WE, Kelly JW. Proc Natl Acad Sci U S A. 2002;99:15428–15433. doi: 10.1073/pnas.192582899. [DOI] [PMC free article] [PubMed] [Google Scholar]
- 9.Fan JQ. Trends Pharmacol Sci. 2003;24:355–360. doi: 10.1016/S0165-6147(03)00158-5. [DOI] [PubMed] [Google Scholar]
- 10.Alfonso P, Pampin S, Estrada J, Rodriguez-Rey JC, Giraldo P, Sancho J, Pocovi M. Blood Cells Mol Dis. 2005;35:268–276. doi: 10.1016/j.bcmd.2005.05.007. [DOI] [PubMed] [Google Scholar]
- 11.Lieberman RL, Wustman BA, Huertas P, Powe AC, Jr, Pine CW, Khanna R, Schlossmacher MG, Ringe D, Petsko GA. Nat Chem Biol. 2007;3:101–107. doi: 10.1038/nchembio850. [DOI] [PubMed] [Google Scholar]
- 12.Zheng W, Padia J, Urban DJ, Jadhav A, Goker-Alpan O, Simeonov A, Goldin E, Auld D, LaMarca ME, Inglese J, Austin CP, Sidransky E. Proc Natl Acad Sci U S A. 2007;104:13192–13197. doi: 10.1073/pnas.0705637104. [DOI] [PMC free article] [PubMed] [Google Scholar]
- 13.Premkumar L, Sawkar AR, Boldin-Adamsky S, Toker L, Silman I, Kelly JW, Futerman AH, Sussman JL. J Biol Chem. 2005;280:23815–23819. doi: 10.1074/jbc.M502799200. [DOI] [PubMed] [Google Scholar]
- 14.Butters TD. Expert Opin Pharmacother. 2007;8:427–435. doi: 10.1517/14656566.8.4.427. [DOI] [PubMed] [Google Scholar]
- 15.Inglese J, Johnson RL, Simeonov A, Xia M, Zheng W, Austin CP, Auld DS. Nat Chem Biol. 2007;3:466–479. doi: 10.1038/nchembio.2007.17. [DOI] [PubMed] [Google Scholar]
- 16.Daniels LB, Glew RH. Clin Chem. 1982;28:569–577. [PubMed] [Google Scholar]
- 17.Kohen E, Kohen C, Hirschberg JG, Santus R, Grabowski G, Mangel W, Gatt S, Prince J. Cell Biochem Funct. 1993;11:167–177. doi: 10.1002/cbf.290110304. [DOI] [PubMed] [Google Scholar]
- 18.Levade T, Salvayre R, Sicre J, Douste-Blazy L. Anal Biochem. 1983;130:521–526. doi: 10.1016/0003-2697(83)90627-9. [DOI] [PubMed] [Google Scholar]
- 19.Dale MP, Ensley HE, Kern K, Sastry KA, Byers LD. Biochemistry. 1985;24:3530–3539. doi: 10.1021/bi00335a022. [DOI] [PubMed] [Google Scholar]
- 20.Peters SP, Lee RE, Glew RH. Clin Chim Acta. 1975;60:391–396. doi: 10.1016/0009-8981(75)90083-2. [DOI] [PubMed] [Google Scholar]
- 21.Hays WS, Wheeler DE, Eghtesad B, Glew RH, Johnston DE. Hepatology. 1998;28:156–163. doi: 10.1002/hep.510280121. [DOI] [PubMed] [Google Scholar]
- 22.van Es HH, Veldwijk M, Havenga M, Valerio D. Anal Biochem. 1997;247:268–271. doi: 10.1006/abio.1997.2090. [DOI] [PubMed] [Google Scholar]
- 23.Inglese J, Auld DS, Jadhav A, Johnson RL, Simeonov A, Yasgar A, Zheng W, Austin CP. Proc Natl Acad Sci U S A. 2006;103:11473–11478. doi: 10.1073/pnas.0604348103. [DOI] [PMC free article] [PubMed] [Google Scholar]
- 24.Kolodny EH, Mumford RA. Clin Chim Acta. 1976;70:247–257. doi: 10.1016/0009-8981(76)90426-5. [DOI] [PubMed] [Google Scholar]
- 25.Peters SP, Coyle P, Glew RH. Arch Biochem Biophys. 1976;175:569–582. doi: 10.1016/0003-9861(76)90547-6. [DOI] [PubMed] [Google Scholar]
- 26.Tanaka H, Suzuki K. Brain Res. 1977;122:325–335. doi: 10.1016/0006-8993(77)90298-0. [DOI] [PubMed] [Google Scholar]
- 27.Taniguchi N, Kato E, Yoshida H, Iwaki S, Ohki T, Koizumi S. Clin Chim Acta. 1978;89:293–299. doi: 10.1016/0009-8981(78)90328-5. [DOI] [PubMed] [Google Scholar]
- 28.Hechtman P, Kachra Z. Biochem J. 1980;185:583–591. doi: 10.1042/bj1850583. [DOI] [PMC free article] [PubMed] [Google Scholar]
- 29.Benjamin ER, Pruthi F, Olanrewaju S, Ilyin VI, Crumley G, Kutlina E, Valenzano KJ, Woodward RM. J Biomol Screen. 2006;11:29–39. doi: 10.1177/1087057105280918. [DOI] [PubMed] [Google Scholar]
- 30.Rickardson L, Wickstrom M, Larsson R, Lovborg H. J Biomol Screen. 2007;12:203–210. doi: 10.1177/1087057106297115. [DOI] [PubMed] [Google Scholar]
- 31.Zhang JH, Chung TD, Oldenburg KR. J Biomol Screen. 1999;4:67–73. doi: 10.1177/108705719900400206. [DOI] [PubMed] [Google Scholar]
- 32.Patrick RA, Peters PA, Issekutz AC. Agents Actions. 1993;40:186–190. doi: 10.1007/BF01984060. [DOI] [PubMed] [Google Scholar]
- 33.Noguchi N, Gotoh N, Niki E. Biochim Biophys Acta. 1994;1213:176–182. doi: 10.1016/0005-2760(94)90024-8. [DOI] [PubMed] [Google Scholar]
- 34.Ogita K, Yoneda Y. J Neurochem. 1990;54:699–702. doi: 10.1111/j.1471-4159.1990.tb01927.x. [DOI] [PubMed] [Google Scholar]


