

Abstract
Augmented expression of cyclooxygenase-2 (COX-2) and enhanced production of prostaglandin E2 (PGE2) are associated with increased tumor cell survival and malignancy. Caveolin-1 is a scaffold protein that has been proposed to function as a tumor suppressor in human cancer cells, although mechanisms underlying this ability remain controversial. Intriguingly, the possibility that caveolin-1 regulates the expression of COX-2 has not been explored. Here we show that augmented caveolin-1 expression in cells with low basal levels of this protein, such as human colon cancer (HT29, DLD-1), breast cancer (ZR75), and embryonic kidney (HEK293T) cells reduced COX-2 mRNA and protein levels and β-catenin-Tcf/Lef and COX-2 gene reporter activity, as well as the production of PGE2 and cell proliferation. Moreover, COX-2 overexpression or PGE2 supplementation increased levels of the inhibitor of apoptosis protein survivin by a transcriptional mechanism, as determined by PCR analysis, survivin gene reporter assays and Western blotting. Furthermore, addition of PGE2 to the medium prevented effects attributed to caveolin-1–mediated inhibition of β-catenin-Tcf/Lef–dependent transcription. Finally, PGE2 reduced the coimmunoprecipitation of caveolin-1 with β-catenin and their colocalization at the plasma membrane. Thus, by reducing COX-2 expression, caveolin-1 interrupts a feedback amplification loop involving PGE2-induced signaling events linked to β-catenin/Tcf/Lef–dependent transcription of tumor survival genes including cox-2 itself and survivin.
INTRODUCTION
Caveolae are omega-shaped plasma membrane invaginations enriched in cholesterol and sphingolipids that are associated with the scaffolding protein caveolin-1. Caveolin-1 is an essential structural component required for the formation of caveola that forms homo- and hetero-oligomers with caveolin-2, as well as interacts with a large number of proteins involved in signal transduction. Generally, these interactions have been suggested to inhibit signal transduction pathways linked to cell proliferation and survival and, in doing so, contribute to the tumor suppressor function of caveolin-1, although alternative modes of action are likely to be important as well (Quest et al., 2004; Quest et al., 2008).
Caveolin-1 has been suggested to inhibit Wnt/β-catenin/Tcf/Lef-1 signaling by sequestering β-catenin to the plasma membrane (Galbiati et al., 2000) and preventing the transcription of genes, such as cyclin D1 (Hulit et al., 2000). Also, ectopic expression of caveolin-1 in human embryonic kidney (HEK293T) and colon cancer cells [HT29(ATCC), DLD-1] down-regulates survivin expression by suppression of β-catenin-Tcf/Lef–dependent transcription and reduces cell viability (Torres et al., 2006). This process requires the presence of E-cadherin for efficient caveolin-1–mediated sequestration of β-catenin to the plasma membrane, because metastatic HT29(US) cells lacking E-cadherin do not down-regulate survivin and this ability is restored upon reexpression of E-cadherin (Torres et al., 2007). Taken together, these results suggest that the ability of caveolin-1 to function as a tumor suppressor may, in part, be linked to its ability to reduce β-catenin-Tcf/Lef–dependent transcription (Quest et al., 2008).
On other hand, the proteins adenomatous polyposis coli (APC) and Axin interact with β-catenin and glycogen synthase kinase 3β (GSK-3β) thereby forming a multiprotein complex. GSK-3β phosphorylates β-catenin and promotes subsequent ubiquitin-dependent proteolysis (Dominguez and Green, 2001). Inhibition of GSK-3β upon Wnt ligand activation increases β-catenin levels, which migrates to the nucleus and associates with the transcriptional factors Tcf/Lef (Logan and Nusse, 2004). Such events promote the expression of several genes, including survivin, cyclin D1, c-myc, and cox-2 (Shtutman et al., 1999; Haertel-Wiesmann et al., 2000; Zhang et al., 2001). In colon cancer cells, COX-2 overexpression is due, in part, to increased β-catenin-Tcf/Lef transcriptional activity, because development of the disease is frequently associated with mutations in β-catenin or APC that preclude β-catenin phosphorylation by GSK-3β and subsequent proteasomal degradation (Morin et al., 1997; Segditsas and Tomlinson, 2006).
Cyclooxygenases (COXs) catalyze the conversion of arachidonic acid to prostaglandin H2 (PGH2), which is then further processed to PGE2, PGI2, PGD2, or thromboxane A2 by specific synthases (Wang et al., 2007). Two distinct genes encode COX enzymes, referred as cox-1 and -2 (Kanaoka et al., 2007). Expression of COX-1 is constitutive in most tissues, whereas COX-2 expression is induced by polypeptidic growth factors, mediators of inflammation, and carcinogens (Telliez et al., 2006; Kanaoka et al., 2007). COX-2 mRNA and protein levels are markedly elevated in colon cancer (DuBois et al., 1996; Kutchera et al., 1996). COX-2 mRNA is up-regulated by transcriptional and/or posttranscriptional mechanisms. For example, β-catenin has been shown to bind to AU-rich elements (ARE) in the 3′-UTR of COX-2 mRNA and stabilize the mRNA (Dixon, 2004). In general, COX proteins are thought to be constitutively active once expressed assuming all the cofactors required are present (Telliez et al., 2006; Wang et al., 2007). Increased COX-2 levels are associated with augmented PGE2 production, enhanced cellular proliferation, and tumorigenesis (Hla et al., 1999; Tong et al., 2005). In human colorectal cancer cells, increased expression of COX-2 is associated with cancer progression (Kanaoka et al., 2007) and leads to phenotypic changes that promote metastasis (Tsujii et al., 1997).
Interestingly, nonsteroidal anti-inflammatory drugs that specifically inhibit COX-2 have been shown to be quite effective in chemoprevention of adenomas in patients suffering from familial adenomatous polyposis (Smalley and DuBois, 1997; Watanabe et al., 2000; Marnett and DuBois, 2002). Thus, COX-2 is an attractive target in cancer therapy, and understanding the mechanisms involved in controlling its expression are of great interest.
PGE2, a secreted product generated as a consequence of COX-2 activity, increases β-catenin-Tcf/Lef transcriptional activity (Castellone et al., 2005; Shao et al., 2005), colon cancer cell growth (Shao et al., 2003), and viability (Sheng et al., 1998; Shao et al., 2003). On the other hand, survivin, an inhibitor of apoptosis protein (IAP) family member, is overexpressed in many human tumors, including colon cancer (Mori et al., 2007). Additionally, COX-2 expression and PGE2 production stabilize survivin protein, as well as increase resistance to apoptosis (Krysan et al., 2004a, 2004c).
Based on such evidence, it was provocative to speculate that caveolin-1 might not only modulate survivin but also COX-2 expression via the β-catenin-Tcf/Lef pathway. In doing so, caveolin-1 was predicted to reduce production of PGE2, an important downstream effector associated with the role of COX-2 as a tumor promoter. This prediction contradicts rather strikingly data in the literature indicating that caveolin-1 is unable to reduce COX-2 activity, and by extrapolation, PGE2 production in cells (Liou et al., 2001). Thus, given the established caveolin-1/β-catenin-Tcf/Lef/survivin connection, on the one hand, and the PGE2/β-catenin-Tcf/Lef link, on the other, we evaluated whether reduced PGE2 production in response to caveolin-1 expression modulated survivin expression.
The results obtained here confirmed that caveolin-1–mediated down-regulation of COX-2 involves inhibition of β-catenin-Tcf/Lef–dependent transcription in HEK293T, colon [HT29(ATCC), DLD-1], and breast (ZR75) cancer cell lines. Furthermore, a positive feedback loop between COX-2 and survivin was uncovered involving PGE2-enhanced transcription of survivin, because ectopic expression of COX-2 or PGE2 supplementation overcame limitations imposed by caveolin-1 presence, including down-regulation of survivin and decreased cell proliferation. These findings provide important new insights to caveolin-1 function as a tumor suppressor.
MATERIALS AND METHODS
Materials
Polyclonal anti-caveolin-1 and monoclonal anti-β-catenin antibodies were from Transduction Laboratories (Lexington, KY). Rabbit polyclonal anti-human survivin and anti-actin antibodies were from R&D Systems (Minneapolis, MN) and Sigma (St. Louis, MO), respectively. The goat polyclonal anti-human COX-2 antibody was from Santa Cruz Biotechnology (Santa Cruz, CA). Goat anti-rabbit IgG and goat anti-mouse IgG antibodies coupled to horseradish peroxidase (HRP) were from Bio-Rad Laboratories (Hercules, CA) and Sigma, respectively. The EZ-ECL Chemiluminescent Substrate was from Biological Industries (Kibbutz Beit Haemek, Israel). Superfect Reagent and Plasmid Midi Kit were from Qiagen (Valencia, CA). TriZOL reagent was from Invitrogen, Invitrogen (Carlsbad, CA). AMV reverse transcriptase (AMV RT) and Taq DNA polymerase were from Promega (Madison, WI). Hygromycin and PGE2 were from Calbiochem (La Jolla, CA). Cell medium and antibiotics were from Invitrogen-BRL (Paisley, Scotland, United Kingdom). Fetal bovine serum (FBS) was from Hyclone (Logan, UT). The MTS Proliferation Assay Kit was from Promega. For reporter assays, Luciferin was purchased from United States Biological (Swampscott, MA). All other reagents used were from Sigma or of the highest grade available.
Cell Culture and Transfections
HEK293T, human breast cancer cell (ZR75), and two human colon adenocarcinoma cell lines, HT29(ATCC) and DLD-1 (American Type Culture Collection, Manassas, VA), were cultured in DMEM supplemented with 10% FBS and antibiotics (10,000 U/ml penicillin and 10 μg/ml streptomycin) at 37°C, 5% CO2. Stably transfected HT29(ATCC), DLD-1, ZR75 cells, and transient transfection experiments in HEK293T cells using Superfect were performed as previously described (Bender et al., 2000; Torres et al., 2006, 2007). Additionally, DLD-1 cells stably transfected with pLacIOP or pLacIOP-caveolin-1 were transiently cotransfected with pOSML-COX-2 and pTOP-FLASH/pFOP-FLASH or pLuc-1710/pLuc420–3M using Superfect. For transient transfection, DLD-1 exposure to mixtures of Superfect with the different DNAs in DMEM was increased to 5 h. Then, the transfection medium (1 ml) was diluted by adding 1 ml complete culture medium and exposure to the transfection reagent with DNA was continued overnight. HT29(US) cells were selected from HT29(ATCC) cells for higher metastatic potential by repeated passages in nude mice whereby cells were injected dorsally and then recovered from lung metastases (Torres et al., 2007). HT29(US) cells were cotransfected with either pBATEM2 and pLacIOP or pBATEM2 and pLacIOP-caveolin-1 using Superfect. Stably transfected cells (mixed, nonclonal populations) were selected after cotransfection experiments by exposure to 750 μg/ml hygromycin for 2 to 3 wk.
Plasmids
The plasmids pLacIOP and pLacIOP-caveolin-1 were previously described (Bender et al., 2000; Felley-Bosco et al., 2000). To generate pEGFP-caveolin-1, full-length caveolin-1 available in pGEX2T (Felley-Bosco et al., 2000) was subcloned in frame into pEGFP-C1 vector using the restriction sites BglII-KpnI as previously described (Torres et al., 2006). The luciferase reporter plasmids pTOP-FLASH (containing a promoter with three wild-type Tcf/Lef-binding elements [TBEs]) and pFOP-FLASH (containing mutated TBEs) were kindly provided by Dr. Hans Clevers (Hubrecht Laboratory, Uppsalalaan, The Netherlands). The survivin reporter plasmids pLuc-1710 (containing a promoter with three TBEs) and pLuc420–3M (containing a mutation of the crucial TBE) were kindly provided by Dr. Dario Altieri (Department of Cancer Biology and the Cancer Center, University of Massachusetts, Medical School, Worcester, MA) and have been described previously (Kim et al., 2003). The COX-2 reporter vector pGL3-COX-2 (containing a TBE site) and pGL3 (containing only the luciferase gene) were provided by Dr. Ying Zhu (Laboratory of Virology, Wuhan University, Wuhan, China). The plasmid encoding β-galactosidase enzyme (pON) was provided by Dr. Sergio Lavandero (Universidad de Chile, Santiago, Chile). The plasmid pOSML-COX-2 encoding human wild-type COX-2 was kindly provided by Dr. Tim Hla (Center for Vascular Biology, University of Connecticut Health Center, Farmington).
Western Blotting
Cell extracts were prepared as described (Felley-Bosco et al., 2000), separated (50–80 μg total protein per lane) by SDS-PAGE on 12% acrylamide minigels (Bio-Rad Laboratories), and transferred to nitrocellulose as described previously (Bender et al., 2000). Blots were blocked with 5% milk or 2% gelatin in 0.1% Tween-PBS and then probed with anti-actin (1:5000), anti-COX-2 (1:500), anti-β-catenin (1:1000), anti-caveolin-1 (1:5000), or anti-survivin (1:3000) antibodies. Bound antibodies were detected with HRP-conjugated secondary antibodies and the EZ-ECL system.
Immunoprecipitation
Cell extracts were prepared in a 20 mM HEPES, pH 7.5, buffer containing 250 mM NaCl, 5 mM EDTA, protease inhibitor cocktail tablet (Roche, Molecular Biochemicals, Mannheim, Germany), and 1% octyl-β-d-glucopyranoside (OβG) from Sigma. Supernatants obtained after centrifugation (13,000 × g, 5 min, 4°C) were used for immunoprecipitation assays (500 μg total protein per assay) with antibodies immobilized on Dynabeads M-280 Tosylactivated (Invitrogen, Invitrogen, Carlsbad, CA). Immunoprecipitated samples were solubilized in sample buffer, separated by SDS-PAGE and analyzed by Western blotting as indicated above.
Immunofluorescence
Cells were cultured for 24 h in the presence of 1 mM IPTG (isopropyl β-d-1-thiogalactopyranoside) in normal culture medium, serum-starved for 4 h, and then incubated for 3 h in the presence of 20 μM PGE2 in serum-free medium. After rinsing with PBS, cells were fixed for 20 min with 4% paraformaldehyde in 100 mM PIPES buffer, pH 6.8, containing 0.04 M KOH, 2 mM EGTA, and 2 mM MgCl2. Afterwards, they were washed three times with universal buffer (50 mM Tris-HCl, pH 7.6, 0.15 N NaCl, and 0.1% sodium azide). Cells were permeabilized with 0.1% Triton X-100 in universal buffer for 10 min, washed twice with universal buffer, and then blocked with 2% bovine serum albumin in the same buffer for 30 min. Cells were then incubated with polyclonal anti-caveolin-1 IgG (dilution, 1:100) and monoclonal anti-β-catenin IgG (1:100) as primary antibodies, followed by Cy3-conjugated anti-mouse IgG (1:200) and FITC-conjugated anti-rabbit IgG (1:200) secondary antibodies. Samples were then mounted onto slides with 10% Mowiol (Calbiochem)–2.5% 1,4-diazobicyclo[2,2,2]octane (DABCO, Sigma) and visualized with an LSM Microsystems Pascal 5 confocal microscope (Carl Zeiss, Thornwood, NY) after excitation at 488 or 543 nm. Optical sections obtained for colocalization studies and acquired-image z stacks for three-dimensional visualization were processed with Imaris software (Bitplane, Zurich, Switzerland) as specified (see legend to Figure 10).
Figure 10.

PGE2 increased nuclear β-catenin localization and reduced the ability of caveolin-1 to sequester β-catenin to the plasma membrane. (A) HT29(ATCC) cells stably transfected with pLacIOP-caveolin-1 (+) or pLacIOP (−) were incubated 24 h in the presence of 1 mM IPTG. Then, cells were serum-starved for 4 h and incubated 3 h in serum-free medium containing 20 μM PGE2. After incubation, caveolin-1 and β-catenin protein levels were assessed in caveolin-1 immunoprecipitates by Western blotting. Numerical values in the bar graph indicate the percentage of β-catenin recovered (recovery %) in caveolin-1 immunoprecipitates averaged from four independent experiments corrected in each case for the efficiency of caveolin-1 recovery in immunoprecipitates. Statistically significant differences are indicated; #p < 0.05. (B) Cells were grown on glass coverslips and treated as described in A. Samples were analyzed by indirect immunofluorescence and confocal microscopy. Cellular localization of caveolin-1 (green) and β-catenin (red) are shown. Merged images were generated using the Imaris software program (Bitplane, Zurich, Switzerland), whereby a third pseudocolor channel (yellow) was used to show colocalization of red and green pixels. The software provides an automated selection of colocalization based on previously described algorithms (Costes et al., 2004). Z-Stacks obtained from the same samples were processed using Imaris software. The laser confocal image z-stack is visualized three-dimensionally using the isosurface processing mode that creates an artificial real volume object from available voxels. The isosurface image of a group of cells was rotated and virtually clipped at 5 μm from the coverslip surface to visualize better the nuclei. The resulting images are indicated as 3D merge +clipping.
Analysis of mRNA levels by Semiquantitative RT-PCR and Quantitative Real-Time RT-PCR
Total RNA was isolated with the reagent TriZOL following instructions provided by manufacturer. RNA samples were spectrophotometrically quantified, characterized by electrophoresis in 1% agarose gels (quality control) and then used as templates to generate cDNA. Specific PCR products were generated using the following primers: COX-2: sense primer, 5′-TTCAAATGAGATTGTGGGAAAATTGCT-3′ and anti-sense primer, 5′-AGATCATCTCTGCCTGAGTATCTT-3′; survivin: sense primer, 5′-CCGACGTTGCCCCCTGC-3′ and anti-sense primer, 5′-TCGATGGCACGGCGCAC-3′; caveolin-1: sense primer, 5′-GGGCAACATCTAGAAGCCCAACAA-3′ and anti-sense primer, 5′-CTGATGCACTGAATTCCAATCAGGAA-3′; and actin: sense primer, 5′-AAATCGTGCGTGACATTAAGC-3′ and anti-sense primer, 5′-CCGATCCACACGGAGTACTT-3′. All reaction products were analyzed after 25–30 amplification cycles, each of which involved consecutive 1-min steps at 94, 55–60, and 72°C. Survivin and COX-2 levels were normalized to actin RNA in semiquantitative RT-PCR studies. The results obtained by semiquantitative studies were confirmed by real-time quantitative PCR (qPCR) analysis with the brilliant SYBR green qPCR kit (Stratagene, La Jolla, CA). The PCR reactions were carried out in a Chromo4 real-time PCR detection system (Bio-Rad Laboratories) using thermal cycle conditions following suggestions of the manufacturer and according to primer design. The relative gene expression levels were calculated using the 2ΔΔCT method (Livak and Schmittgen, 2001). COX-2 levels were normalized to RNA of the 18S rRNA housekeeping gene (sense primer 5′-TCAAGAACGAAAGTCGGAGG-3′ and anti-sense primer 5′-GGACATCTAAGGGCATCACA-3′). All data were expressed relative to values obtained for mock-transfected cells (100%).
Proliferation Assay
HEK293T cells seeded in 96-well plates at a density of 1 × 10⁴ cells per well were serum-starved overnight and then incubated for 16 h in presence of 5 μM PGE2 in serum-free medium. HT29(ATCC) and DLD-1 colon cancer cells stably transfected with pLacIOP or pLacIOP-caveolin-1 were seeded in 96-well plates at a density of 5 × 10³. These cells were serum-starved for 4 h and incubated 3 h with 20 μM PGE2, and then all cells were incubated 24 h in serum-containing medium with 1 mM IPTG in the presence of either the COX-1 inhibitor FR122047 (10 μM; Calbiochem, La Jolla, CA) or the selective COX-2 inhibitor SC-791 (20 μM; Calbiochem). In our assays, concentrations recommended by the manufacturer in their data sheet were used. Experiments using similar concentrations have been reported in the literature (Furst et al., 2005). In all cases, cell proliferation and viability was evaluated by the MTS assay (Promega), according to the manufacturer's instructions.
Luciferase Reporter Assays
For Tcf/Lef, COX-2, and survivin promoter reporter assays, HEK293T, HT29(ATCC), DLD-1, and ZR75 cells were transfected with 2 μg of each plasmid: pTOP-FLASH (Tcf/Lef reporter), pFOP-FLASH (mutated Tcf/Lef binding site), pLuc-1710 (survivin promoter), pLuc420–3M (mutated Tcf/Lef binding site), pGL3-COX-2 (COX-2 promoter), and pGL3 (empty vector). After transfection (24 h), cells were lysed in a buffer containing 0.1 M KH2PO4 (pH 7.9), 1 mM DTT, 0.5% Triton X-100, and supernatants (50 μl) were used to measure luciferase activities (serial dilutions in a 96-well plates). Luciferase activity was detected using a luminescence counter (Topcount, Perkin Elmer-Cetus, Boston, MA) after addition of KTME buffer containing 100 mM Tris HCl, 10 mM MgSO4, 2 mM EDTA, 5 mM Na2ATP, and 0.1 mM luciferin. Luciferase activity data were standardized for each condition by calculating the TOP/FOP, pLuc-1710/pLuc420–3M or pGL3-COX-2/pGL3 activity ratios, respectively. It should be noted that the plasmid pGL3 contains a luciferase-encoding insert with detectable basal activity (Deng et al., 2004). For comparison, cells were cotransfected with a plasmid encoding β-galactosidase (pON) to standardize pGL3-COX-2 reporter activity in some cases. Essentially, results obtained after standardization using pON or pGL3 were the same (data not shown). Hence, pGL3-COX-2/pGL3 activity ratios are shown in all relevant figures. Values shown are the mean ± SEM of activity measurements averaged from at least three independent experiments, where 100% was assigned to values obtained in control cells.
Quantification of PGE2 Levels
Supernatants of colon and breast cancer cell lines, as well as HEK293T cells expressing (pLacIOP-caveolin-1) or not (pLacIOP) caveolin-1 were obtained by centrifugation and stored at −80°C. Also, supernatants of HEK293T cells transfected with increasing amounts of pOSML-COX-2 (0–4 μg) were collected the same way. PGE2 present in the supernatants was quantified using the PGE2 EIA monoclonal kit (Cayman Chemical Company, Ann Arbor, MI) according to instructions provided by the manufacturer. Essentially, this assay is based on the competition between PGE2 (in the supernatants) and a PGE2-acetylcholinesterase (AChE) conjugate (PGE2 tracer) for binding to a PGE2 mAb. To determine the concentration of PGE2 in each sample, the alternative linear plot equation suggested by the manufacturer was used. Results obtained for PGE2 present in samples were expressed in ng/ml. Basal levels of PGE2 were defined using culture media as a control.
Statistical Analysis
Results were statistically compared using the Kruskal-Wallis ANOVA for unpaired groups followed by multiple comparison posttests (Dunn's multiple comparison test). Data analyzed in this manner are specifically indicated in the respective figure legends. Also, where pertinent, a t test was performed for unpaired or paired groups. All groups were from three or more independent experiments. p < 0.05 was considered significant.
RESULTS
Caveolin-1 Down-regulated COX-2 Expression in Human Breast and Colon Cancer Cell Lines
Our previous studies showed that caveolin-1 inhibits expression of the IAP survivin, via a transcriptional mechanism involving the β-catenin-Tcf/Lef pathway in human breast and colon cancer cells (Torres et al., 2006). To investigate whether COX-2 expression might also be altered by caveolin-1 presence, we used the previously established cancer cell lines ZR75, DLD-1, and HT29(ATCC) (Bender et al., 2000; Torres et al., 2006, 2007) stably expressing caveolin-1. COX-2 mRNA levels were significantly reduced in ZR75, DLD-1, and HT29(ATCC) cells expressing caveolin-1 when compared with mock cells, as assessed by both semiquantitative RT-PCR (left panels, Figure 1, A, B, and C, respectively) and real-time qPCR (Figure 1D). Likewise, COX-2 protein levels were reduced by roughly 50% in all cells (right panels, Figure 1, A, B, and C, respectively) expressing caveolin-1 compared with mock-transfected cells.
Figure 1.
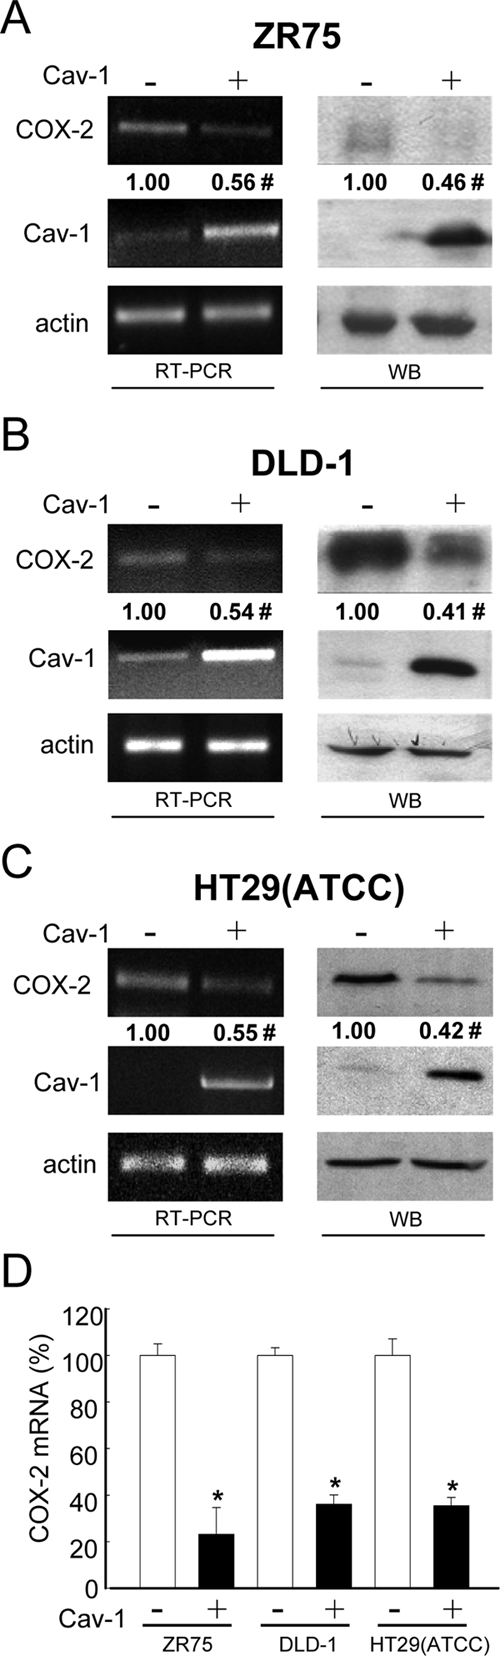
Caveolin-1 reduced COX-2 mRNA and protein levels in breast (ZR75) and colon [HT29(ATCC), DLD-1] cancer cell lines. Results obtained with ZR75 (A), DLD-1 (B), or HT29(ATCC) (C) cells stably transfected with the plasmids pLacIOP (−) or pLacIOP-caveolin-1 (+) are shown. Cells (2 × 10⁶) were seeded in 60-mm plates and grown in all cases for 24 h in the presence of 1 mM IPTG. COX-2 mRNA levels were assessed by semiquantitative RT-PCR analysis (RT-PCR). Actin was used as an internal control. Numerical data shown were averaged from three independent experiments (mean ± SEM). Residual COX-2 levels in the presence of caveolin-1 were (A) ZR75, 0.56 ± 0.06; (B) DLD-1, 0.54 ± 0.1; and (C) HT29(ATCC), 0.55 ± 0.06. Statistically significant differences between results for pLacIOP (−) and pLacIOP-caveolin-1 (+) transfected cells are indicated; #p < 0.05. Also, total protein extracts from ZR75, DLD-1, or HT29(ATCC) cells were separated by SDS-PAGE (80 μg/lane) and analyzed by Western blotting (WB) with anti-COX-2, anti-caveolin-1, or anti-actin antibodies. COX-2 levels were quantified by scanning densitometric analysis of Western blots and normalized to actin. COX-2 protein levels in cells transfected with pLacIOP-caveolin-1 were compared with those in pLacIOP controls, both in the presence of 1 mM IPTG. Numerical data were averaged from three independent experiments (mean ± SEM). Residual COX-2 levels in the presence of caveolin-1 were as follows: (A) ZR75, 0.46 ± 0.08; (B) DLD-1, 0.41 ± 0.05; and (C) HT29(ATCC), 0.42 ± 0.07. (D) COX-2 mRNA levels were compared by real-time qPCR analysis. Ribosomal 18S RNA was used as an internal control. Values shown were averaged from three independent experiments (mean ± SEM). Statistically significant differences between results obtained for cells transfected with pLacIOP (−) or pLacIOP-cav-1 (+) are indicated; *p < 0.01; #p < 0.05.
Caveolin-1 Down-regulated COX-2 Expression in HEK293T Cells
The results obtained with cancer cell lines were confirmed using HEK293T cells which express low levels of endogenous caveolin-1 and are easily susceptible to manipulation by transient transfection. Indeed, transfection efficiency was ∼40–50%, as assessed by flow cytometry following transfection with pEGFP-C1 (data not shown). To corroborate observations, HEK293T cells were transfected with either pEGFP-caveolin-1 (leading to expression of a GFP-caveolin-1 fusion protein) or pLacIOP-caveolin-1 (IPTG inducible; Torres et al., 2006). After transfection, COX-2 mRNA levels were assessed by semiquantitative RT-PCR and real-time qPCR. As expected, based on the results obtained in cancer cells (Figure 1), caveolin-1 also reduced COX-2 mRNA content by ∼40–50% in HEK293T cells (Figure 2, A and B). Likewise, COX-2 protein levels decreased to a similar extent in these cells (Figure 2C). Given that the transfection efficiency was roughly 50%, these observations indicate that caveolin-1–mediated COX-2 suppression was remarkably effective in HEK293T cells expressing either GFP-caveolin-1 or caveolin-1 alone. Altogether, these data suggest that caveolin-1 suppressed COX-2 expression by a predominantly transcriptional mechanism.
Figure 2.
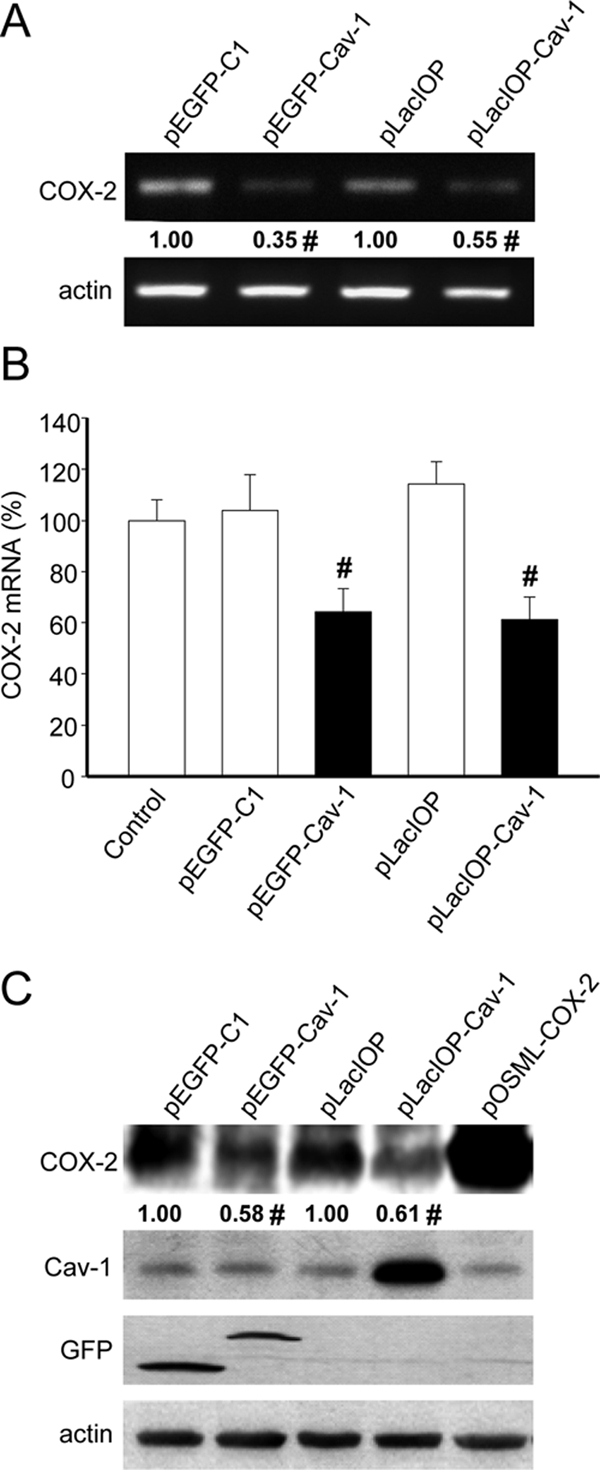
Caveolin-1 reduced COX-2 mRNA and protein levels in HEK293T cells. (A) HEK293T cells were transiently transfected with the plasmids pEGFP-C1, pEGFP-caveolin-1, pLacIOP, or pLacIOP-caveolin-1 (2 μg in each case). After transfection, the cells were grown 24 h either in the absence (pEGFP-C1, pEGFP-caveolin-1) or presence of 1 mM IPTG (pLacIOP and pLacIOP-caveolin-1). Semiquantitative RT-PCR analysis was performed using specific primers for COX-2 or actin as an internal control. Numerical data were averaged from three independent experiments (mean ± SEM). Residual COX-2 levels in the presence of caveolin-1 were 0.35 ± 0.07 (pEGFP-caveolin-1) and 0.55 ± 0.07 (pLacIOP-caveolin-1), respectively. Statistically significant differences with respect to mock controls are indicated; #p < 0.05. (B) Quantitative real-time qPCR analysis of HEK293T cells transiently transfected as in A. Data were normalized to values obtained with nontransfected cells (100%). Ribosomal 18S RNA was used as an internal control. Results shown were averaged from three independent experiments (mean ± SEM). Statistically significant differences with respect to mock controls are indicated; #p < 0.05. (C) Western blot analysis of HEK293T cells transiently transfected with the plasmids pEGFP-C1, pEGFP-caveolin-1, pLacIOP, or pLacIOP-caveolin-1 and grown for 24 h after transfection as indicated in A. Protein extracts were prepared, separated by SDS-PAGE (80 μg/lane), and analyzed by Western blotting with anti-COX-2, anti-caveolin-1, anti-GFP, or anti-actin antibodies. As a positive control for COX-2 expression, cells were transiently transfected with 2 μg of the COX-2 expression plasmid pOSML-COX-2. Numerical data were obtained by scanning densitometric analysis of Western blots and normalized to actin. Results shown were averaged from three independent experiments (mean ± SEM). Residual COX-2 levels in the presence of caveolin-1 were 0.58 ± 0.12 (pEGFP-caveolin-1) and 0.61 ± 0.10 (pLacIOP-caveolin-1), respectively. Statistically significant differences with respect to mock controls are indicated; #p < 0.05.
COX-2 Reduction by Caveolin-1 Involves a β-Catenin-Tcf/Lef–dependent Mechanism
Previous reports indicate that the COX-2 promoter region has a TBE and that COX-2 expression is regulated by the Wnt pathway (Araki et al., 2003). Caveolin-1 sequesters β-catenin to the plasma membrane in a multiprotein complex together with E-cadherin and thereby inhibits Tcf/Lef–dependent transcription (Torres et al., 2006, 2007). Indeed, the expression of caveolin-1 in HEK293T cells significantly reduced β-catenin-Tcf/Lef transcriptional activity, and this effect was reverted by the presence of the GSK-3β inhibitors, lithium, or SB-216763 (Figure 3A, graph). Furthermore, caveolin-1–dependent reduction of β-catenin transcriptional activity and COX-2 mRNA levels was reverted in the presence of GSK-3β inhibitors (Figure 3A, gels). Similar responses were observed for COX-2, β-catenin, and survivin protein levels assessed by Western blot analysis (Figure 3B). Additionally, a luciferase reporter construct containing the COX-2 promoter (pGL3-COX-2) was used in HEK293T cells to specifically demonstrate that coexpression with caveolin-1 reduced COX-2 reporter activity. In this case, the effect of caveolin-1 was also reverted when the cells were incubated with either of the two GSK-3β inhibitors: lithium (20 mM) or SB-216763 (10 μM; Figure 3C).
Figure 3.

Caveolin-1–mediated suppression of COX-2 in different cell lines involved the β-catenin-Tcf/Lef pathway. HEK293T cells were transiently cotransfected with the reporter plasmids pTOP-FLASH or pFOP-FLASH and pLacIOP or pLacIOP-caveolin-1 (2 μg each). After transfection, cells were incubated with 1 mM of IPTG for 24 h. Additionally, HEK293T cells were cultured after transfection in the presence or absence of lithium (20 mM) or SB-216763 (10 μM; both GSK-3β inhibitors). (A) After 24 h, cells were harvested and prepared for the Tcf/Lef reporter assay and semiquantitative RT-PCR analysis as described. Bar graph: luciferase activity was normalized by calculating the pTOP-FLASH (three functional TBE in tandem)/pFOP-FLASH (all TBEs mutated) activity ratio for each condition. Data were normalized to values obtained in control cells transfected with pLacIOP (100%). Results from three independent experiments were averaged (mean ± SEM). Statistically significant differences compared with control cells are indicated (*p < 0.01; #p < 0.05). COX-2 mRNA levels were assessed by semiquantitative RT-PCR using COX-2–specific primers. (B) Total protein extracts (80 μg/lane) were separated by SDS-PAGE and analyzed by Western blotting with anti-COX-2, anti-β-catenin, anti-survivin, anti-caveolin-1, or anti-actin antibodies. Data shown are representative of results obtained in three independent experiments. (C) HEK293T cells were transiently cotransfected with the reporter plasmids pGL3-COX-2 (COX-2 promoter) or pGL3 (empty vector) and pLacIOP or pLacIOP-caveolin-1 (2 μg each). After transfection, cells were treated with GSK-3β inhibitors, as indicated. Reporter activity was normalized by calculating the pGL3-COX-2/pGL3 activity for each condition. Data shown were averaged from three independent experiments (mean ± SEM). Statistically significant differences with respect to mock controls are indicated; *p < 0.01; #p < 0.05. (D and E) ZR75 and DLD-1 cells stably transfected with pLacIOP (Cav-1 (−)) or pLacIOP-caveolin-1 (Cav-1 (+)), were additionally transfected with pGL3 or pGL3-COX-2 (each 2 μg) and cultured for 24 h in presence or absence of the specific GSK-3β inhibitor SB-216763 (10 μM). Then, cell extracts were prepared, and reporter activity was determined as described. pGL3-COX-2/pGL3 activity ratios were calculated for each condition. Values obtained for control cells stably transfected with pLacIOP were defined as 100%. Data were averaged from three independent experiments (mean ± SEM). Statistically significant differences with respect to mock controls are indicated; *p < 0.01; #p < 0.05.
To investigate whether caveolin-1 specifically decreased COX-2 transcription in cancer cells, human breast (ZR75) and colon (DLD-1) cancer cell lines expressing or not caveolin-1 were transiently transfected with the plasmids pGL3 (empty vector) or pGL3-COX-2 (COX-2 promoter). Indeed, caveolin-1 expression decreased luciferase activity in ZR75 (Figure 3D) and DLD-1 (Figure 3E) cells. As expected, reduced COX-2 reporter activity was reverted in all cases by incubation with the specific GSK-3β inhibitor SB-216763.
COX-2 Overexpression and PGE2 Activated the β-Catenin-Tcf/Lef–dependent Pathway and Increased Survivin Expression
Interestingly, PGE2, a product of COX-2 activity, promotes β-catenin-Tcf/Lef transcriptional activity via stimulation of EP2, a heterotrimeric guanine nucleotide-binding protein (G protein)-coupled receptor (Castellone et al., 2005). In addition, COX-2 expression and PGE2 production stabilize survivin protein and increase resistance to apoptosis in nonsmall cell lung cancer cells (Krysan et al., 2004a, 2004c). Moreover, survivin expression is regulated directly by the β-catenin-Tcf/Lef pathway (Zhang et al., 2001; Torres et al., 2006). Thus, the effect of COX-2 overexpression on survivin levels was investigated. To that end, HEK293T cells were transfected with increasing amounts of a plasmid encoding COX-2 (pOSML-COX-2). As anticipated, a dose-dependent increase in COX-2 and survivin mRNA levels was detected by semiquantitative RT-PCR analysis (Figure 4A). Subsequently, increased COX-2, β-catenin, and survivin protein levels were observed by Western blot analysis (Figure 4B). To investigate whether survivin increments induced by COX-2 involved a transcriptional mechanism based on activation of the β-catenin-Tcf/Lef pathway, HEK293T cells were cotransfected with pOSML-COX-2 and different luciferase reporter plasmids. As expected, overexpression of COX-2 in HEK293T cells promoted either general β-catenin-Tcf/Lef–dependent or –specific survivin transcription (Figure 4C). Interestingly, ectopic expression of COX-2 (pOSML-COX-2) also led to increased COX-2 reporter activity, indicating that COX-2 promotes its own expression (Figure 4C). Because COX-2 overexpression was expected to increase PGE2 production, the PGE2 levels in supernatants of HEK293T cells transfected with increasing amounts of pOSML-COX-2 (0–4 μg) were quantified. The results obtained indicate that indeed PGE2 increased in a dose-dependent manner (Figure 4D). Finally, we evaluated whether ectopic COX2 expression was sufficient to overcome limitations in the proliferation of HEK293T cells imposed by the presence of caveolin-1 and found that, indeed, this was the case (Figure 4E).
Figure 4.

Overexpression of COX-2 augmented PGE2 production, up-regulated survivin expression and promoted proliferation in HEK293T cells. HEK293T cells were transiently transfected with increasing amounts (0, 0.5, 1.0, 2.0, and 4.0 μg) of the plasmid encoding COX-2 (pOSML-COX-2; A–C), and in C additionally were cotransfected with 1.0 μg of the different luciferase reporter plasmids: pTOP-FLASH, pFOP-FLASH, pLuc-1710 (survivin promoter with three TBEs), pLuc-420-3M (survivin promoter with 2 TBEs where the critical one is mutated), pGL3-COX-2 (COX-2 promoter), and pGL3 (empty vector). After transfection cells were cultured for 24 h and prepared for the following: (A) Semiquantitative RT-PCR analysis of COX-2 and survivin mRNA levels. Actin was used as internal control. Numerical data are the means of results obtained in three independent experiments. Relative survivin mRNA levels compared with controls were (mean ± SEM): 2.0 ± 0.07, 2.1 ± 0.05, and 2.8 ± 0.1, with 1, 2, and 4 μg of pOSML-COX-2, respectively. (B) Western blot analysis of HEK293T cells. Total protein extracts (80 μg/lane) were separated by SDS-PAGE and analyzed by Western blotting with anti-COX-2, anti-β-catenin, anti-survivin, or anti-actin antibodies. Numerical data were obtained by scanning densitometric analysis. Values shown were normalized to actin and averaged from three different experiments (mean ± SEM). Relative β-catenin protein levels compared with controls were: 2.6 ± 0.04, 2.7 ± 0.0, and 2.4 ± 0.08, with 1, 2 and 4 μg of pOSML-COX-2, respectively. Relative survivin protein levels compared with controls were 2.5 ± 0.04, 4.2 ± 0.08, and 4.6 ± 0.08, with 1, 2, and 4 μg of pOSML-COX-2, respectively. Statistically significant differences with respect to mock controls found in A and B are indicated; *p < 0.01; #p < 0.05. (C) Reporter activity was determined and normalized by calculating the pTOP-FLASH/pFOP-FLASH, pLuc-1710/pLuc-420–3M, and pGL3-COX-2/pGL3 activity ratios. Data from three independent experiments were averaged (mean ± SEM). Values were standardized relative to those obtained for control cells not transfected with the plasmid encoding COX-2 (100%). Statistically significant differences detected by multiple comparisons using ANOVA are indicated; *p < 0.01; #p < 0.05. (D) PGE2 production was quantified using the EIA monoclonal assay kit. After transfection with increasing amounts of pOSML-COX-2 (0–4 μg) and incubation for 24 h, the supernatants of HEK293T cells were collected and PGE2 concentration (ng/ml) was quantified as described (Materials and Methods). Data from three independent experiments were averaged (mean ± SEM). Statistically significant differences detected by multiple comparisons using ANOVA are indicated; *p < 0.01; #p < 0.05. (E) HEK293T cells were transiently transfected with pOSML-COX-2 and pLacIOP or pLacIOP-caveolin-1 (2 μg each plasmid).Twenty-four hours after transfection cell proliferation was measured by the MTS assay. Data from three independent experiments were averaged (mean ± SEM). Statistically significant differences between cells transfected with pLacIOP-caveolin-1 or pLacIOP-caveolin-1/pOSML-COX-2 are indicated; #p < 0.05.
To explore whether exogenous addition of PGE2 was sufficient to increase survivin levels by a β-catenin–dependent mechanism as observed upon COX-2 overexpression, HEK293T cells were cotransfected with the same reporter plasmids and incubated with PGE2 (5 μM). Surprisingly, increased β-catenin-Tcf/Lef (TOP/FOP-FLASH), survivin and COX-2 promoter-dependent reporter activity were observed upon addition of PGE2 (Figure 5A). Importantly, the increase in COX-2 promoter-dependent reporter activity observed in the presence of PGE2 confirmed the notion that COX-2 enzymatic activity enhances its own transcription. When examined by semiquantitative RT-PCR and real-time qPCR, PGE2 treatment increased COX-2 (Figure 5, B and C) and survivin (Figure 5, B and D) mRNA levels, confirming the results observed using reporter assays.
Figure 5.

PGE2 increased survivin and COX-2 expression via the β-catenin-Tcf/Lef pathway, as well as proliferation in HEK293T cells. (A) HEK293T cells were transfected with reporter plasmids for the Tcf/Lef (pTOP-FLASH or pFOP-FLASH), survivin (pLuc-1710 or pLuc-420–3M), and COX-2 (pGL3-COX-2 or pGL3) promoters. After transfection, cells were serum-starved for 12 h and then incubated 4 h with serum-free medium containing PGE2 (5 μM). Cell extracts were prepared and luciferase activity was determined as described (Materials and Methods). Results were normalized to values obtained for cells without PGE2. Data shown are averaged from three independent experiments (mean ± SEM). Statistically significant differences are indicated; *p < 0.01; #p < 0.05. (B) Total RNA was isolated from cells treated the same way as in A. The mRNA levels of COX-2 and survivin were determined by semiquantitative RT-PCR using actin as a control. Relative mRNA levels compared with controls estimated by scanning densitometry were 2.0 ± 0.03 for survivin and 1.4 ± 0.06 for COX-2. Differences compared with nontransfected cells were statistically significant; #p < 0.05. (C and D) Real-time qPCR analysis of COX-2 and survivin mRNA levels from samples obtained as indicated in A. Ribosomal 18S RNA was used as an internal control. Statistically significant differences when compared with nontreated cells are indicated; *p < 0.01; #p < 0.05. (E) Protein extracts from cells obtained as in A were separated by SDS-PAGE (80 μg/lane) and analyzed by Western blotting with anti-COX-2, anti-β-catenin, anti-survivin, or anti-actin antibodies. Numerical data were obtained by scanning densitometric analysis and normalized to actin. Compared with controls, protein levels in the presence of PGE2 were 1.55 ± 0.03 for COX-2, 1.35 ± 0.05 for β-catenin, and 1.74 ± 0.04 for survivin. (F) Cell proliferation was measured by MTS assay in HEK293T cells cultured 12 h in serum-free medium and then incubated 16 h in serum-free medium containing PGE2 (5 μM). Data from three independent experiments (mean ± SEM) are shown. Statistically significant differences when compared with nontreated cells are indicated; #p < 0.05.
To investigate whether PGE2-mediated increases in mRNA and reporter activity also lead to higher protein levels compared with nontreated cells, β-catenin, survivin, and COX-2 levels were analyzed by Western blotting in HEK293T cells. As expected, PGE2 increased the levels of all these proteins by ∼1.5-fold in HEK293T cells (Figure 5E). In the same experiments, we evaluated whether PGE2-enhanced COX-2/survivin expression correlated with increased proliferation. Indeed, measurements using the MTS assay indicated that PGE2 significantly increased the proliferation of HEK293T cells (Figure 5F).
Caveolin-1 Decreased PGE2 Production in Embryonic Kidney and Different Cancer Cell Lines
The results obtained so far suggested that caveolin-1 may decrease COX-2 expression and enzymatic activity in HEK293T, breast (ZR75), and colon [HT29(ATCC), DLD-1] cancer cells. Thus, we explored whether caveolin-1–mediated down-regulation of COX-2 also resulted in lower levels of PGE2. Cell supernatants were obtained from the respective cells expressing or not caveolin-1 (see Figures 1 and 2), and PGE2 presence in supernatants was quantified (see Materials and Methods). As expected, caveolin-1 expression decreased PGE2 production in all cases (Figure 6), although the reduction was only statistically significant for HEK293T, DLD-1, and HT29(ATCC) cells.
Figure 6.

Caveolin-1 expression decreased PGE2 production in embryonic kidney and cancer cell lines. Quantification of PGE2 production by an immunodetection method. Results for HEK293T (A), ZR75 (B), DLD-1 (C), or HT29(ATCC) (D) cells transiently (for embryonic HEK293T) or stably (cancer cells) transfected with the plasmids pLacIOP (−) or pLacIOP-caveolin-1 (+), □ and ■, respectively, are shown. Cells (2 × 10⁶) were seeded in 60-mm plates and grown in all cases for 24 h in presence of 1 mM IPTG. Supernatants were collected and quantified with the PGE2 EIA monoclonal kit. Data averaged from three independent experiments are shown (mean ± SEM). Statistically significant differences with respect to mock controls found in A, C, and D are indicated; #p < 0.05.
PGE2 Supplementation Prevented Caveolin-1–induced Loss of Survivin and Reduction in Cell Proliferation
We previously demonstrated that caveolin-1 decreases survivin expression and cell proliferation (Torres et al., 2006). To determine whether caveolin-1–mediated suppression of survivin is prevented by PGE2 supplementation, HEK293T cells transiently transfected with caveolin-1 and the human breast (ZR75) as well as colon [HT29(ATCC), DLD-1] cancer cell lines stably expressing caveolin-1 were used. Compared with mock-transfected cells, these cell lines expressed lower levels of COX-2 (see Figure 2 and Figure 1, A-C, respectively) and produced less PGE2 (Figure 6).
In agreement with our hypothesis, PGE2 supplementation restored survivin mRNA levels upon expression of caveolin-1 as assessed by semiquantitative RT-PCR in cancer cell lines (Figure 7A), whereas COX-2 mRNA levels were augmented in all cancer cell lines, as assessed by real-time qPCR (Figure 7B). Likewise, PGE2 generally up-regulated COX-2 and survivin protein levels in these cancer cell lines either expressing or not caveolin-1 (Figure 7C).
Figure 7.

PGE2 reverted caveolin-1–mediated inhibition of COX-2 and survivin expression in cancer cell lines. The colon [HT29(ATCC), DLD-1] and breast (ZR75) cancer cell lines stably transfected with pLacIOP (−) or pLacIOP-caveolin-1 (+) were incubated 24 h either in the presence of 1 mM IPTG or 1 mM IPTG and 3 h with 20 μM PGE2 in serum-free medium. (A) Survivin, caveolin-1, and actin mRNA levels were analyzed by semiquantitative RT-PCR. Actin was used as an internal control. Numerical data averaged from three independent experiments after standardization to actin are shown (means). (B) Quantitative qPCR analysis of COX-2 mRNA levels in colon [HT29(ATCC), DLD-1] and breast (ZR75) cancer cell lines treated as described in A. Ribosomal 18S RNA was used as an internal control. Values shown were averaged from three independent experiments (mean ± SEM). (C) Western blot of the same samples as in A. Total protein extracts were separated by SDS-PAGE (80 μg/lane) and analyzed by Western blotting using anti-β-catenin, anti-COX-2, anti-survivin, anti-caveolin-1, or anti-actin antibodies. Numerical data were averaged from three independent experiments after standardization to actin (means). Statistically significant differences found in A–C between results for cells transfected with pLacIOP-caveolin-1 and cultured in the absence or presence of PGE2 (20 μM) are indicated; *p < 0.01; #p < 0.05.
To evaluate for cancer cell lines, whether ectopic expression of COX-2 was sufficient to overcome limitations imposed by the presence of caveolin-1 (as already shown with HEK293T cells; see Figure 4E), we chose to focus the analysis on DLD-1 cells for a number of reasons. First, these are the easiest to transfect of the three cancer cell lines used in this study, whereby efficiencies similar to those obtained with HEK293T cells can be achieved using a modified transfection protocol (Materials and Methods). Second, reduction in PGE2 presence in the medium due to caveolin-1 expression was most apparent in this cancer cell line (see Figure 6C). Third, this same cell line was used in the study by Castellone et al. (2005) showing that PGE2 promotes β-catenin-Tcf/Lef–dependent transcription via EP2 receptors in a manner independent of cAMP-mediated signaling. As was to be anticipated from previous experiments and results shown with HEK293T cells (Figure 4E), additional transfection of DLD-1 cells expressing caveolin-1 with pOSML-COX-2 overcame limitations imposed on these cells by the presence of caveolin-1, including reduced survivin mRNA (Figure 8A) and protein (Figure 8D) levels and reduced generic β-catenin-Tcf/Lef (Figure 8B) and survivin (Figure 8C) reporter activities, as well as reduced PGE2 production (Figure 8E) and cell proliferation (Figure 8F).
Figure 8.

COX-2 overexpression prevented caveolin-1–mediated inhibition of transcription and proliferation in DLD-1 cells. The DLD-1 colon cancer cells stably transfected with pLacIOP (−; □) or pLacIOP-caveolin-1 (+; ■) were additionally transfected with pOSML-COX-2 (2 μg). For reporter assays (B and C), DLD-1 cells were also cotransfected with 1.0 μg of the different luciferase reporter plasmids: pTOP-FLASH, pFOP-FLASH, pLuc-1710, or pLuc-420–3M. Then, DLD-1 cells were incubated 24 h in the presence of 1 mM IPTG. (A) The mRNA levels of survivin were determined by semiquantitative RT-PCR analysis. Actin was used as an internal control, and numbers between panels represent the average from two independent experiments. Residual survivin mRNA levels in the presence of caveolin-1 (pLacIOP-caveolin-1) increased from 0.4–1.7 upon cotransfection with pOSML-COX-2. (B and C) Luciferase activity was determined and normalized by calculating the pTOP-FLASH/pFOP-FLASH and pLuc-1710/pLuc-420–3M activity ratios, respectively. Values were standardized relative to those obtained for control cells not transfected with the plasmid encoding COX-2 (100%). Data shown were averaged from three independent experiments (mean ± SEM). Statistically significant differences are indicated; *p < 0.01; #p < 0.05. (D) Western blot analysis of DLD-1 cells. Total protein extracts (50 μg/lane) were separated by SDS-PAGE and analyzed by Western blotting with anti-COX-2, anti-survivin, anti-caveolin-1, or anti-actin antibodies. Numerical data were obtained by scanning densitometric analysis. Values shown were normalized to actin and averaged from two independent experiments. Residual survivin protein levels in the presence of caveolin-1 (pLacIOP-caveolin-1) increased from 0.5 to 2.0 upon cotransfection with pOSML-COX-2. (E) After cotransfection, as described above, the supernatants from DLD-1 cells were collected and PGE2 concentrations (ng/ml) were quantified as described in Materials and Methods. Data averaged from three independent experiments are shown (mean ± SEM). Statistically significant differences are indicated; *p < 0.01; #p < 0.05. (F) DLD-1 cells stably transfected with pLacIOP (−) or pLacIOP-caveolin-1 (+) and additionally transfected with pOSML-COX-2 (2 μg). Then, DLD-1 cells were seeded in 96-well plates and cultured 24 h in the presence of 1 mM IPTG. Cell proliferation was measured using the MTS assay. Data from three independent experiments (mean ± SEM) are shown. The p value shown (p = 0.054) refers to the difference in proliferation between DLD-1 cells stably transfected with pLacIOP-caveolin-1 alone or additionally transfected with pOSML-COX-2.
To provide further proof that COX-2 activity and PGE2 production were important, we assessed the effect of a commercially available COX-2 inhibitor. Initially, experiments sought to define the inhibitor concentration at which significant effects were detectable. In DLD-1 cells we found that using 20 μM SC-791, TOP/FOP reporter activity, PGE2 production, proliferation, and survivin expression were significantly reduced (see Supplementary Material, Figure S1). In these experiments, the COX-1 inhibitor (FR122047, 10 μM) displayed a tendency to reduce values observed, although changes were generally not statistically significant.
DLD-1 and HT29(ATCC) cells expressing or not caveolin-1 were also incubated with PGE2, in the absence or presence of either a COX-1 (FR122047, 10 μM) or COX-2 (SC-791, 20 μM) inhibitor, and proliferation was evaluated using the MTS assay. Results showed that caveolin-1 decreased the proliferation in both cancer cells (Figures 9, A and B; cf. bars 1 and 2), and this effect was slightly potentiated by incubation with the COX-2 inhibitor, but not the COX-1 inhibitor (Figure 8, A and B; cf. bars 2, 6, and 10). Importantly, PGE2 supplementation prevented the observed reduction in cell proliferation due to either caveolin-1 expression or the presence of the COX-1/COX-2 inhibitors or a combination of these two conditions (Figure 9, A and B; cf. bars 4, 8, and 12).
Figure 9.

PGE2 prevented inhibition of proliferation in cancer cell lines due to caveolin-1 expression or the presence of a COX-2 inhibitor. Proliferation was assessed using the MTS assay in HT29(ATCC) (A) and DLD-1 (B) colon cancer cells stably transfected with pLacIOP (−) or pLacIOP-caveolin-1 (+). After serum starvation for 4 h and incubation for 3 h with PGE2 (20 μM) in serum-free media, cells were grown for 24 h in the presence of IPTG (1 mM) and either 10 μM of the COX-1 inhibitor (FR122047) or 20 μM of the COX-2 inhibitor II (SC-791). Results were normalized to values in control cells (100%) transfected with the empty vector (pLacIOP). Data shown were averaged from three independent experiments (mean ± SEM). Statistically significant differences detected by multiple comparisons using ANOVA in A and B are indicated; #p < 0.05.
PGE2 Increased Nuclear β-Catenin Localization and Precluded Caveolin-1–dependent Sequestration of β-Catenin to the Plasma Membrane
Castellone et al. (2005) described that PGE2 supplementation promotes β-catenin accumulation and nuclear translocation in DLD-1 cells. In view of our previous findings showing that caveolin-1 expression in HT29(ATCC) cells promotes sequestration of β-catenin at the plasma membrane (Torres et al., 2007), we explored whether PGE2 modulated β-catenin distribution in these cells. The results obtained here confirmed our previous findings showing that caveolin-1 coimmunoprecipitated with β-catenin in HT29(ATCC) cells (Torres et al., 2007). Interestingly, addition of PGE2 (20 μM) decreased the amount of β-catenin that coimmunoprecipitated with caveolin-1 by roughly 70% (Figure 10A, bar graph).
To confirm these results, HT29(ATCC) cells expressing or not caveolin-1 were also analyzed by confocal microscopy. As reported previously (Torres et al., 2007), caveolin-1 expression in HT29(ATCC) cells reduced nuclear localization of β-catenin and promoted colocalization of caveolin-1 and β-catenin at the plasma membrane. Importantly, PGE2 induced nuclear accumulation of β-catenin in both caveolin-1 positive (+) and negative (−) cells. Furthermore, PGE2 reduced caveolin-1/β-catenin colocalization at the plasma membrane and promoted nuclear accumulation of β-catenin in HT29(ATCC) cells expressing caveolin-1 (Figure 10B). Taken together, these results indicate that PGE2 treatment precludes efficient formation of caveolin-1/β-catenin complexes at the plasma membrane and in doing so permits nuclear translocation of β-catenin.
Caveolin-1–induced Reduction of COX-2 mRNA Levels Required E-Cadherin Presence
The loss of E-cadherin expression is frequently observed during tumor progression, as well as metastasis, and is associated with higher β-catenin–mediated transcriptional activity (Cavallaro and Christofori, 2004; Logan and Nusse, 2004). Indeed, in a metastatic cell line derived from the human adenocarcinoma cell line HT29(ATCC), termed HT29(US), E-cadherin protein levels are almost undetectable. Most importantly, unlike in HT29(ATCC) cells that do express E-cadherin, caveolin-1 does not regulate survivin expression, and reexpression of E-cadherin is sufficient to restore the ability of caveolin-1 to do so in HT29(US) cells (Torres et al., 2007). Thus, to investigate whether COX-2 expression may be regulated in the same manner, HT29(US) cells were stably cotransfected with pBATEM2 and either pLacIOP or pLacIOP-caveolin-1. In pBATEM2-transfected cells E-cadherin levels are increased five- to sevenfold (Torres et al., 2007). COX-2 mRNA levels were determined in HT29(US) cells by semiquantitative RT-PCR and real-time qPCR. As expected, caveolin-1 expression did not alter COX-2 mRNA levels in the absence of E-cadherin (E-cad (−); Figure 11A). However, when caveolin-1 and E-cadherin (E-cad (+); Figure 11B), were coexpressed in these cells, COX-2 mRNA levels decreased significantly as assessed by the semiquantitative approach. These findings where confirmed by real-time qPCR, where a significant, 70% decrease in COX-2 mRNA levels was observed for HT29(US) cells expressing both caveolin-1 and E-cadherin (Figure 11C). Taken together, these results indicate that, as described for survivin, caveolin-1 cooperates with E-cadherin in the regulation of COX-2 expression via a β-catenin-Tcf/Lef–dependent transcriptional mechanism.
Figure 11.
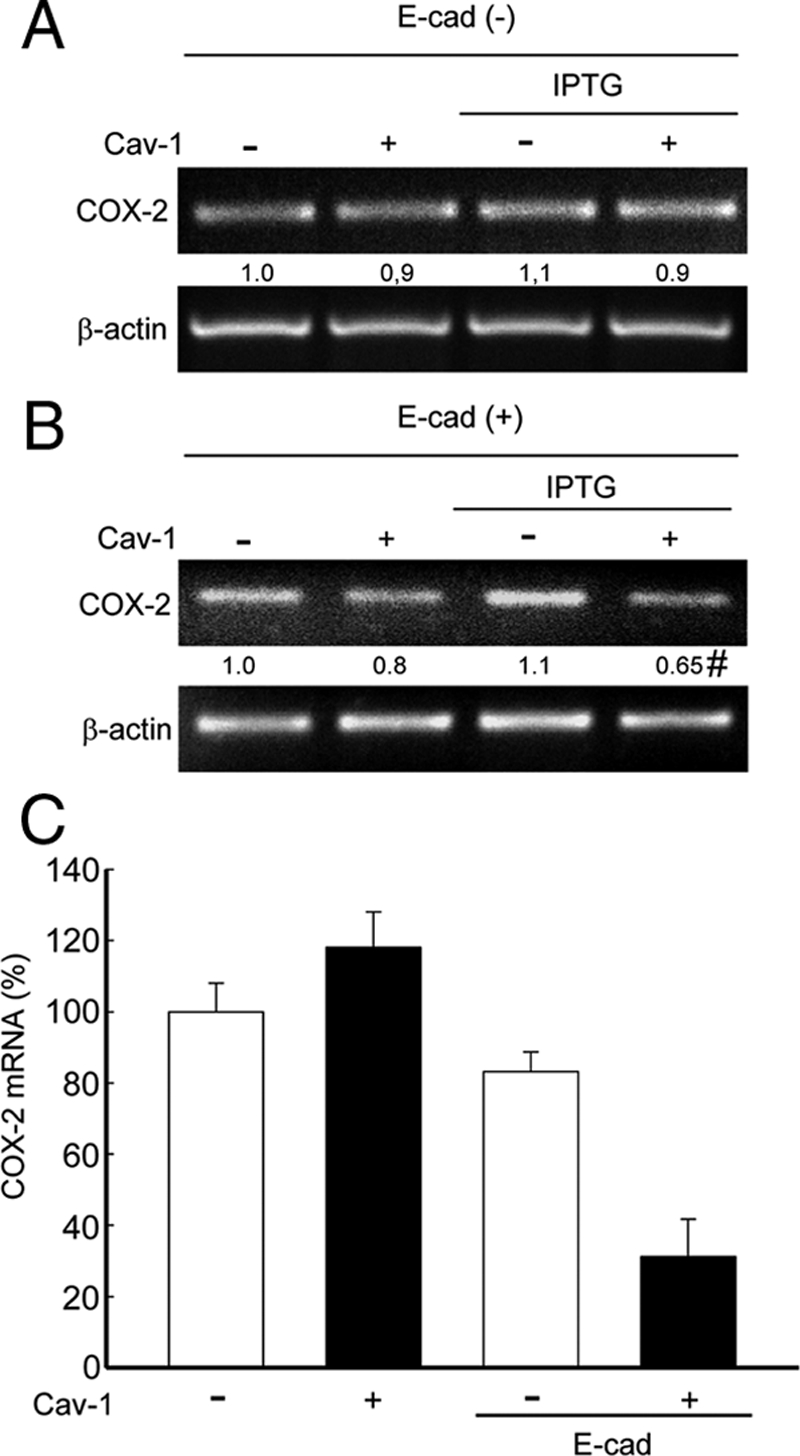
Caveolin-1–mediated reduction of COX-2 mRNA levels was restored in the HT29(US) colon cancer cell line by ectopic E-cadherin expression. The HT29(US) (E-cad/−) cells stably transfected with pLacIOP (−) or pLacIOP-caveolin-1 (+) were incubated 24 h in the absence or presence of 1 mM IPTG. (A) COX-2 and actin mRNA levels were analyzed by semiquantitative RT-PCR. Actin was used as an internal control. Numerical data averaged from three independent experiments after standardization to actin are shown (B) HT29(US) cells were cotransfected with pBATEM2 (E-cad/+) and pLacIOP (−) or pLacIOP-caveolin-1 (+) and grown for 24 h in the absence or presence of 1 mM IPTG. For cotransfection experiments, 2 μg of each plasmid were used. COX-2 mRNA levels were assessed as described in A. Numerical data averaged from three independent experiments after standardization to actin are shown (mean ± SEM). COX-2 levels in E-cadherin and caveolin-1–expressing cells were 0.65 ± 0.14. Statistically significant differences between results for cells cotransfected with pLacIOP/pBATEM2 or pLacIOP-caveolin-1/pBATEM2 are indicated; #p < 0.05. (C) Real-time qPCR analysis of COX-2 mRNA levels in HT29(US) cells cotransfected as in B. Numerical data averaged from two independent experiments in triplicate after standardization to ribosomal 18S RNA are shown (mean ± SEM).
DISCUSSION
Caveolin-1 Decreases COX-2 Expression by a β-Catenin-Tcf/Lef–dependent Transcriptional Pathway in HEK293T, HT29(ATCC), DLD-1, and ZR75 Cells
The ability of caveolin-1 to function as a tumor suppressor has been linked in part to the ability to function as a negative regulator of β-catenin-Tcf/Lef–dependent transcription (Quest et al., 2008). Examples of target genes that are negatively regulated by a mechanism involving caveolin-1–mediated suppression of β-catenin-Tcf/Lef-transcription include cyclin D1 (Galbiati et al., 2000) and survivin (Torres et al., 2006). Associated with these changes, reduced cell proliferation and an increased susceptibility to apoptosis have been observed (Torres et al., 2006, 2007).
In this report, we provide evidence showing that ectopic expression of caveolin-1 reduces COX-2 at the mRNA and protein levels in breast (ZR75) and colon [HT29(ATCC), DLD-1] cancer cells (Figure 1). Also, in HEK293T cells inhibition was observed (Figure 2). Furthermore, caveolin-1 decreased reporter activity associated generically with activation of the β-catenin-Tcf/Lef pathway (TOP/FOP reporter), as well as specifically with the activation of the cox-2 gene in cancer and HEK293T cells. Therefore, these results are consistent with the notion that COX-2 expression is transcriptionally modulated by β-catenin-Tcf/Lef (Haertel-Wiesmann et al., 2000; Araki et al., 2003) and suggest that caveolin-1 presence down-regulates COX-2 expression via this pathway, in a manner apparently similar to that reported for survivin (Torres et al., 2006).
On the other hand, Liou et al., (2001) showed the colocalization and interaction of COX-2 with caveolin-1 in human foreskin fibroblasts stimulated with phorbol 12-myristate acetate. Moreover, a gluthatione-S-transferase-caveolin-1 fusion protein was shown to bind directly to purified COX-2 without inducing changes in COX-2 activity, as measured by cyclooxygenase activity (in vitro experiments), suggesting that caveolin-1 does not regulate COX-2 by this posttranscriptional mechanism (Liou et al., 2001). However, other types of posttranscriptional regulation promoted by caveolin-1, such as augmented proteosomal degradation (Felley-Bosco et al., 2000, 2002), cannot be ruled out by these studies. Moreover, transcriptional mechanisms of control were not considered at the time. Thus, the observations reported here represent a significant advance in this respect.
Caveolin-1 Expression Reduced PGE2 Production
PGE2 is attributed a wide variety of biological functions, including the stimulation of cell migration, proliferation, tumor-associated neo-vascularization, modulation of immunosuppression, and inhibition of cell death, through activation of four cognate G protein–linked receptors, EP1–EP4 (Hull et al., 2004; Backlund et al., 2005; Hawcroft et al., 2007). Thus, we evaluated whether COX-2 down-regulation, observed in the presence of caveolin-1, correlated with reduced PGE2 production. Indeed, PGE2 production was diminished in all cell lines expressing caveolin-1, albeit to highly variable degrees (see Figure 6). Taken together, the simplest interpretation of our data is that caveolin-1–dependent down-regulation of COX-2 transcription is linked to reductions in overall PGE2 production. However, additional scenarios can be invoked. For instance, caveolin-1 may also modulate vesicular transport of PGE2 from the perinuclear region, where COX-2 frequently localizes (Kojima et al., 2004), to the plasma membrane and/or control liberation of PGE2-containing vesicles at the cell surface. Distinguishing between these possibilities and determining their relevance will require extensive additional experimental analysis beyond the scope of this study.
A Positive Feedback Loop Connects COX-2 Overexpression and PGE2 Production with Increased Survivin Expression
Constitutive COX-2 expression is associated with angiogenesis, cell invasion, resistance to apoptosis, and cancer cell proliferation. Furthermore, PGE2, an important product of COX-2 activity, increases β-catenin protein levels through GSK-3β inhibition (Lim et al., 2008), augments Tcf/Lef transcriptional activity (Shao et al., 2005), and promotes colon cancer cell growth (Shao et al., 2003; Castellone et al., 2005). Given this wide variety of effects, it is not surprising that COX-2 represents an excellent target for therapeutic intervention using specific inhibitors (Castellone et al., 2006; Kanaoka et al., 2007).
Our results in HEK293T cells agree with these findings and additionally show that COX-2 overexpression significantly increased β-catenin protein levels (Figure 4B), as well as survivin expression (Figure 4, A and B). Furthermore, COX-2 overexpression increased PGE2 production (Figure 4D) and cell proliferation even in the presence of caveolin-1 (Figure 4E), as well as increased β-catenin-Tcf/Lef–dependent expression of survivin and COX-2 (see Figure 5). The addition of PGE2 produced only modest increases in β-catenin protein levels in these cells (Figure 5E), suggesting that an alternative mechanism, such as enhanced nuclear translocation, may contribute to enhanced β-catenin–dependent transcription. Indeed, this was the case, as is discussed subsequently, for the results obtained with HT29(ATCC) cells.
The relevance of our findings is underscored by data indicating that constitutive overexpression of COX-2 or PGE2 treatment leads to decreased proteasomal degradation of survivin and elevated resistance of COX-2-overexpressing non-small cell lung cancer or human monocyte-derived dendritic cells exposed to apoptotic stimuli (Krysan et al., 2004a,b; Baratelli et al., 2005). Furthermore, combinations of COX-2 inhibitors and oxaliplatin promote the loss of survivin, inhibition of growth, and death in human colon cancer cells (Lin et al., 2005). Ectopic survivin expression is sufficient to prevent the decrease in cell proliferation observed upon caveolin-1 expression (Torres et al., 2006), as well as in response to other apoptotic stimuli (Tapia et al., 2006). Moreover, a number of studies have shown that PGE2 activates β-catenin-Tcf/Lef–mediated transcription in HEK293, DLD-1, and LS-174T cells (Fujino et al., 2002; Castellone et al., 2005; Shao et al., 2005). In agreement with these reports, PGE2 supplementation overcame caveolin-1–induced loss of survivin in all cell lines tested here (see Figures 5 and 7). In contrast to previously discussed models, we suggest that COX-2 promotes nuclear accumulation of β-catenin and activation of β-catenin-Tcf/Lef–dependent transcription of survivin. To the best of our knowledge, this study provides the first evidence indicating that COX-2 increases survivin expression via PGE2-induced transcriptional activity of the β-catenin-Tcf/Lef pathway.
PGE2 Disrupts Plasma Membrane–associated Caveolin-1/β-Catenin Complexes
In cancer cells, mutations of APC and/or β-catenin, increase β-catenin levels in the cytoplasm and transcriptional activity of the nuclear β-catenin-Tcf/Lef complex, thereby promoting the expression of COX-2 and survivin (Zhang et al., 2001; Kim et al., 2003; Segditsas and Tomlinson, 2006). These changes are linked to increased proliferation and viability of cancer cells (Tsujii et al., 1997). Events consistent with the activation of similar signaling pathways were observed in this study using [HT29(ATCC), DLD-1] colon cancer cells. According to an existing model, PGE2 binds to EP2 receptors coupled to heterotrimeric Gαs and disrupts the regulation of β-catenin by the displacement of GSK-3β from the axin/GSK-3β/APC/β-catenin complex (Castellone et al., 2005). Concomitantly liberated βγ heterodimers activate the PI3K-Akt pathway, which results in phosphorylation and inactivation of GSK-3β. A related sequence of events may explain how PGE2 blocks the ability of caveolin-1 to sequester β-catenin to the plasma membrane in the presence of E-cadherin (Torres et al., 2007) and, in doing so, promotes transcription of β-catenin-Tcf/Lef target genes, such as survivin and cox-2. Our studies revealed that PGE2 induced translocation of β-catenin from the plasma membrane to the nucleus in mock and caveolin-1–expressing cells. Importantly, coimmunoprecipitation and colocalization of β-catenin with caveolin-1 at the plasma membrane decreased in the presence of PGE2 (Figure 10). Thus, signaling events triggered by PGE2 disrupt a caveolin-1/β-catenin multiprotein complex at the cell surface that precludes β-catenin-Tcf/Lef–mediated transcription in the nucleus.
E-Cadherin Is Required for Caveolin-1–mediated Down-regulation of COX-2 in Metastatic HT29(US) Colon Cancer Cells
As mentioned, the presence of E-cadherin in cancer cells was shown recently to be required for caveolin-1–mediated down-regulation of β-catenin-Tcf/Lef–dependent transcription and survivin expression (Torres et al., 2007). These phenomena were not observed in metastatic HT29(US) cells lacking E-cadherin. Similarly, we observed here that COX-2 mRNA levels were not affected by ectopic caveolin-1 expression in HT29(US) cells and that reexpression of E-cadherin restored such regulation downstream of caveolin-1 (see Figure 11). Our findings concerning COX-2 strengthen the notion that loss of E-cadherin expression during tumor progression represents an important step toward the generation of a permissive cellular environment where the ability of caveolin-1 to display traits associated with tumor suppression and/or inhibition of metastasis may be severely impaired (Quest et al., 2008).
In summary, we demonstrate that caveolin-1 down-regulates COX-2 in a manner similar to that described for cyclin D1 (Hulit et al., 2000) and survivin (Torres et al., 2006, 2007). Furthermore, a feed-forward amplification loop between COX-2/PGE2 and survivin expression was identified. The working model (Figure 12) summarizes how caveolin-1 or COX-2, inhibit or activate, respectively, β-catenin-Tcf/Lef–dependent transcription. On the one hand, PGE2, produced as a consequence of COX-2 activity and released from cells, binds to EP2 receptors (Castellone et al., 2005, 2006), increases β-catenin-Tcf/Lef activity, and promotes the expression of growth-enhancing genes, such as cox-2 and survivin. On the other hand, caveolin-1 sequesters β-catenin to the plasma membrane in a complex with E-cadherin and inhibits β-catenin-Tcf/Lef–dependent transcription of survivin (Torres et al., 2006, 2007) and cox-2 (shown here, Figures 10 and 11). Thus, augmented PGE2 production by any given cell is predicted to reduce the ability of caveolin-1 to inhibit β-catenin-Tcf/Lef–dependent transcription and function as a tumor suppressor in the same cell, as well as in neighboring cells. On the contrary, increments in the expression of caveolin-1 may modulate cell features in an autocrine and paracrine manner by reducing PGE2 production. Taken together, our findings suggest that alterations in caveolin-1 expression in both epithelial and stroma cells are likely to be important in tumor development. Consistent with such thinking, reduced caveolin-1 protein levels are observed both in mucosa and stroma of tumor samples from colon cancer patients (Bender et al., 2000).
Figure 12.

Schematic summary of data. Our previous studies showed that caveolin-1 suppresses β-catenin-Tcf/Lef activity by sequestering β-catenin to the plasma membrane in a complex with E-cadherin and thereby inhibits survivin expression (Torres et al., 2006). The results obtained here additionally show that caveolin-1 suppressed the expression of COX-2 by essentially the same transcriptional mechanism in HEK293T, colon [HT29(ATCC) and DLD-1], and breast (ZR75) cancer cell lines. Moreover, caveolin-1 expression generally correlated with reduced presence of PGE2 in the culture medium. Importantly, caveolin-1–mediated inhibition of β-catenin-Tcf/Lef–dependent transcription and survivin expression were prevented either by ectopic expression of COX-2 or by incubation with PGE2. Thus, caveolin-1–dependent regulation of survivin, COX-2, and presumably other β-catenin-Tcf/Lef target genes involves not only inhibition of transcription by sequestration of β-catenin to the plasma membrane in a complex with E-cadherin, but also suppression of this posttranscriptional COX-2-PGE2 amplification loop. Alternatively, our data also indicate that PGE2 blocks the ability of caveolin-1 to sequester β-catenin to the plasma membrane, although the precise mechanism by which this occurs remains to be established. In agreement with results obtained by others (Castellone et al., 2005, 2006), PGE2 is suggested here to enhance β-catenin stability in the cytosol via an EP2 receptor–dependent mechanism. In addition, although speculative, this same sequence is suggested to block efficient formation of the caveolin-1/E-cadherin/β-catenin complex at the cell surface.
Supplementary Material
ACKNOWLEDGMENTS
Ying Zhu, Hans Clevers, Dario Altieri, and Tim Hla are gratefully acknowledged for providing the pGL3/pGL3-COX-2, TOP-FLASH/FOP-FLASH and survivin promoter region reporter constructs and the plasmid encoding human wild-type COX-2 (pOSML-COX-2), respectively. The plasmid pBATEM2, encoding E-cadherin, was generously provided by Amparo Cano (Universidad Autonoma de Madrid, Madrid, Spain). This work was supported by FONDAP Grant 15010006 (A.F.G.Q.), Fondo Nacional de Investigación Científica y Tecnológica (FONDECYT) Grants 3050037 and 11070116 (J.C.T.), FONDECYT Grants 1040390 and 1070699 (L.L.), a Mejoramiento de la calidad de la educación superior (MECESUP) fellowship (D.A.R.), and a Consejo Nacional de Investigaciones Científicas y Técnicas PhD fellowship (J.G.F.).
Abbreviations used:
- APC
adenomatous polyposis coli
- COX-2
cyclooxygenase-2
- GSK-3β
glycogen synthase kinase 3β
- IPTG
isopropyl β-d-1-thiogalactopyranoside
- PGE2
prostaglandin E2
- qPCR
quantitative PCR
- RT-PCR
reverse transcriptase polymerase chain reaction
- TBE
Tcf/Lef-binding element.
Footnotes
This article was published online ahead of print in MBC in Press (http://www.molbiolcell.org/cgi/doi/10.1091/mbc.E08-09-0939) on February 25, 2009.
The results reported here have been presented in preliminary form on previous occasions: 22nd Annual Meeting of the Chilean Cell Biology Society, Pucon, Chile, October 5–9, 2008 and 48th Annual Meeting of the American Society for Cell Biology, San Francisco, CA, December 13–17, 2008.
REFERENCES
- Araki Y., Okamura S., Hussain S. P., Nagashima M., He P., Shiseki M., Miura K., Harris C. C. Regulation of cyclooxygenase-2 expression by the Wnt and ras pathways. Cancer Res. 2003;63:728–734. [PubMed] [Google Scholar]
- Backlund M. G., Mann J. R., Dubois R. N. Mechanisms for the prevention of gastrointestinal cancer: the role of prostaglandin E2. Oncology. 2005;69(Suppl 1):28–32. doi: 10.1159/000086629. [DOI] [PubMed] [Google Scholar]
- Baratelli F., Krysan K., Heuze-Vourc'h N., Zhu L., Escuadro B., Sharma S., Reckamp K., Dohadwala M., Dubinett S. M. PGE2 confers survivin-dependent apoptosis resistance in human monocyte-derived dendritic cells. J. Leukoc. Biol. 2005;78:555–564. doi: 10.1189/jlb.1004569. [DOI] [PubMed] [Google Scholar]
- Bender F. C., Reymond M. A., Bron C., Quest A. F. Caveolin-1 levels are down-regulated in human colon tumors, and ectopic expression of caveolin-1 in colon carcinoma cell lines reduces cell tumorigenicity. Cancer Res. 2000;60:5870–5878. [PubMed] [Google Scholar]
- Castellone M. D., Teramoto H., Gutkind J. S. Cyclooxygenase-2 and colorectal cancer chemoprevention: the beta-catenin connection. Cancer Res. 2006;66:11085–11088. doi: 10.1158/0008-5472.CAN-06-2233. [DOI] [PubMed] [Google Scholar]
- Castellone M. D., Teramoto H., Williams B. O., Druey K. M., Gutkind J. S. Prostaglandin E2 promotes colon cancer cell growth through a Gs-axin-beta-catenin signaling axis. Science. 2005;310:1504–1510. doi: 10.1126/science.1116221. [DOI] [PubMed] [Google Scholar]
- Cavallaro U., Christofori G. Cell adhesion and signalling by cadherins and Ig-CAMs in cancer. Nat. Rev. Cancer. 2004;4:118–132. doi: 10.1038/nrc1276. [DOI] [PubMed] [Google Scholar]
- Costes S. V., Daelemans D., Cho E. H., Dobbin Z., Pavlakis G., Lockett S. Automatic and quantitative measurement of protein-protein colocalization in live cells. Biophys. J. 2004;86:3993–4003. doi: 10.1529/biophysj.103.038422. [DOI] [PMC free article] [PubMed] [Google Scholar]
- Deng W. G., Zhu Y., Wu K. K. Role of p300 and PCAF in regulating cyclooxygenase-2 promoter activation by inflammatory mediators. Blood. 2004;103:2135–2142. doi: 10.1182/blood-2003-09-3131. [DOI] [PubMed] [Google Scholar]
- Dixon D. A. Dysregulated post-transcriptional control of COX-2 gene expression in cancer. Curr. Pharm. Des. 2004;10:635–646. doi: 10.2174/1381612043453171. [DOI] [PubMed] [Google Scholar]
- Dominguez I., Green J. B. Missing links in GSK3 regulation. Dev. Biol. 2001;235:303–313. doi: 10.1006/dbio.2001.0317. [DOI] [PubMed] [Google Scholar]
- DuBois R. N., Radhika A., Reddy B. S., Entingh A. J. Increased cyclooxygenase-2 levels in carcinogen-induced rat colonic tumors. Gastroenterology. 1996;110:1259–1262. doi: 10.1053/gast.1996.v110.pm8613017. [DOI] [PubMed] [Google Scholar]
- Felley-Bosco E., Bender F., Quest A. F. Caveolin-1-mediated post-transcriptional regulation of inducible nitric oxide synthase in human colon carcinoma cells. Biol. Res. 2002;35:169–176. doi: 10.4067/s0716-97602002000200007. [DOI] [PubMed] [Google Scholar]
- Felley-Bosco E., Bender F. C., Courjault-Gautier F., Bron C., Quest A. F. Caveolin-1 down-regulates inducible nitric oxide synthase via the proteasome pathway in human colon carcinoma cells. Proc. Natl. Acad. Sci. USA. 2000;97:14334–14339. doi: 10.1073/pnas.250406797. [DOI] [PMC free article] [PubMed] [Google Scholar]
- Fujino H., West K. A., Regan J. W. Phosphorylation of glycogen synthase kinase-3 and stimulation of T-cell factor signaling following activation of EP2 and EP4 prostanoid receptors by prostaglandin E2. J. Biol. Chem. 2002;277:2614–2619. doi: 10.1074/jbc.M109440200. [DOI] [PubMed] [Google Scholar]
- Furst S. M., Komocsar W. J., Khan K. N., White K. L., Jr, Peachee V. L., Mennear J. H. Screening new drugs for immunotoxic potential: I. Assessment of the effects of conventional nonsteroidal anti-inflammatory drugs and selective COX-2 inhibitors on in vitro and in vivo phagocytic activity. J. Immunotoxicol. 2005;1:149–158. doi: 10.1080/15476910490916828. [DOI] [PubMed] [Google Scholar]
- Galbiati F., Volonte D., Brown A. M., Weinstein D. E., Ben-Ze'ev A., Pestell R. G., Lisanti M. P. Caveolin-1 expression inhibits Wnt/beta-catenin/Lef-1 signaling by recruiting beta-catenin to caveolae membrane domains. J. Biol. Chem. 2000;275:23368–23377. doi: 10.1074/jbc.M002020200. [DOI] [PubMed] [Google Scholar]
- Haertel-Wiesmann M., Liang Y., Fantl W. J., Williams L. T. Regulation of cyclooxygenase-2 and periostin by Wnt-3 in mouse mammary epithelial cells. J. Biol. Chem. 2000;275:32046–32051. doi: 10.1074/jbc.M000074200. [DOI] [PubMed] [Google Scholar]
- Hawcroft G., Ko C. W., Hull M. A. Prostaglandin E2-EP4 receptor signalling promotes tumorigenic behaviour of HT-29 human colorectal cancer cells. Oncogene. 2007;26:3006–3019. doi: 10.1038/sj.onc.1210113. [DOI] [PubMed] [Google Scholar]
- Hla T., Bishop-Bailey D., Liu C. H., Schaefers H. J., Trifan O. C. Cyclooxygenase-1 and -2 isoenzymes. Int. J. Biochem. Cell Biol. 1999;31:551–557. doi: 10.1016/s1357-2725(98)00152-6. [DOI] [PubMed] [Google Scholar]
- Hulit J., et al. The cyclin D1 gene is transcriptionally repressed by caveolin-1. J. Biol. Chem. 2000;275:21203–21209. doi: 10.1074/jbc.M000321200. [DOI] [PubMed] [Google Scholar]
- Hull M. A., Ko S. C., Hawcroft G. Prostaglandin EP receptors: targets for treatment and prevention of colorectal cancer? Mol. Cancer Ther. 2004;3:1031–1039. [PubMed] [Google Scholar]
- Kanaoka S., Takai T., Yoshida K. Cyclooxygenase-2 and tumor biology. Adv. Clin. Chem. 2007;43:59–78. [PubMed] [Google Scholar]
- Kim P. J., Plescia J., Clevers H., Fearon E. R., Altieri D. C. Survivin and molecular pathogenesis of colorectal cancer. Lancet. 2003;362:205–209. doi: 10.1016/S0140-6736(03)13910-4. [DOI] [PubMed] [Google Scholar]
- Kojima F., Naraba H., Miyamoto S., Beppu M., Aoki H., Kawai S. Membrane-associated prostaglandin E synthase-1 is upregulated by proinflammatory cytokines in chondrocytes from patients with osteoarthritis. Arthritis Res. Ther. 2004;6:R355–365. doi: 10.1186/ar1195. [DOI] [PMC free article] [PubMed] [Google Scholar]
- Krysan K., Dalwadi H., Sharma S., Pold M., Dubinett S. Cyclooxygenase 2-dependent expression of survivin is critical for apoptosis resistance in non-small cell lung cancer. Cancer Res. 2004a;64:6359–6362. doi: 10.1158/0008-5472.CAN-04-1681. [DOI] [PubMed] [Google Scholar]
- Krysan K., et al. Cyclooxygenase-2-dependent expression of survivin in non-small cell lung cancer. Chest. 2004b;125:140S. doi: 10.1378/chest.125.5_suppl.140s. [DOI] [PubMed] [Google Scholar]
- Krysan K., et al. COX-2-dependent stabilization of survivin in non-small cell lung cancer. FASEB J. 2004c;18:206–208. doi: 10.1096/fj.03-0369fje. [DOI] [PubMed] [Google Scholar]
- Kutchera W., Jones D. A., Matsunami N., Groden J., McIntyre T. M., Zimmerman G. A., White R. L., Prescott S. M. Prostaglandin H synthase 2 is expressed abnormally in human colon cancer: evidence for a transcriptional effect. Proc. Natl. Acad. Sci. USA. 1996;93:4816–4820. doi: 10.1073/pnas.93.10.4816. [DOI] [PMC free article] [PubMed] [Google Scholar]
- Lim K., Han C., Xu L., Isse K., Demetris A. J., Wu T. Cyclooxygenase-2-derived prostaglandin E2 activates beta-catenin in human cholangiocarcinoma cells: evidence for inhibition of these signaling pathways by omega 3 polyunsaturated fatty acids. Cancer Res. 2008;68:553–560. doi: 10.1158/0008-5472.CAN-07-2295. [DOI] [PubMed] [Google Scholar]
- Lin J., Hsiao P. W., Chiu T. H., Chao J. I. Combination of cyclooxygenase-2 inhibitors and oxaliplatin increases the growth inhibition and death in human colon cancer cells. Biochem. Pharmacol. 2005;70:658–667. doi: 10.1016/j.bcp.2005.05.028. [DOI] [PubMed] [Google Scholar]
- Liou J. Y., Deng W. G., Gilroy D. W., Shyue S. K., Wu K. K. Colocalization and interaction of cyclooxygenase-2 with caveolin-1 in human fibroblasts. J. Biol. Chem. 2001;276:34975–34982. doi: 10.1074/jbc.M105946200. [DOI] [PubMed] [Google Scholar]
- Livak H. J., Schmittgen T. D. Analysis of relative gene expression data using real-time quantitative PCR and the 2-DDCT method. Methods. 2001;25:402–408. doi: 10.1006/meth.2001.1262. [DOI] [PubMed] [Google Scholar]
- Logan C. Y., Nusse R. The Wnt signaling pathway in development and disease. Annu. Rev. Cell Dev. Biol. 2004;20:781–810. doi: 10.1146/annurev.cellbio.20.010403.113126. [DOI] [PubMed] [Google Scholar]
- Marnett L. J., DuBois R. N. COX-2, a target for colon cancer prevention. Annu. Rev. Pharmacol. Toxicol. 2002;42:55–80. doi: 10.1146/annurev.pharmtox.42.082301.164620. [DOI] [PubMed] [Google Scholar]
- Mori F., Piro F. R., Della Rocca C., Mesiti G., Giampaoli S., Silvestre G., Lazzaro D. Survivin and cyclooxygenase-2 are co-expressed in human and mouse colon carcinoma and in terminally differentiated colonocytes. Histol. Histopathol. 2007;22:61–77. doi: 10.14670/HH-22.61. [DOI] [PubMed] [Google Scholar]
- Morin P. J., Sparks A. B., Korinek V., Barker N., Clevers H., Vogelstein B., Kinzler K. W. Activation of beta-catenin-Tcf signaling in colon cancer by mutations in beta-catenin or APC. Science. 1997;275:1787–1790. doi: 10.1126/science.275.5307.1787. [DOI] [PubMed] [Google Scholar]
- Quest A., Gutierrez-Pajares J. L., Torres V. Caveolin-1, an ambiguous partner in cell signaling and cancer. J. Cell Mol. Med. 2008;12:1130–1150. doi: 10.1111/j.1582-4934.2008.00331.x. [DOI] [PMC free article] [PubMed] [Google Scholar]
- Quest A. F., Leyton L., Parraga M. Caveolins, caveolae, and lipid rafts in cellular transport, signaling, and disease. Biochem. Cell Biol. 2004;82:129–144. doi: 10.1139/o03-071. [DOI] [PubMed] [Google Scholar]
- Segditsas S., Tomlinson I. Colorectal cancer and genetic alterations in the Wnt pathway. Oncogene. 2006;25:7531–7537. doi: 10.1038/sj.onc.1210059. [DOI] [PubMed] [Google Scholar]
- Shao J., Jung C., Liu C., Sheng H. Prostaglandin E2 Stimulates the beta-catenin/T cell factor-dependent transcription in colon cancer. J. Biol. Chem. 2005;280:26565–26572. doi: 10.1074/jbc.M413056200. [DOI] [PubMed] [Google Scholar]
- Shao J., Lee S. B., Guo H., Evers B. M., Sheng H. Prostaglandin E2 stimulates the growth of colon cancer cells via induction of amphiregulin. Cancer Res. 2003;63:5218–5223. [PubMed] [Google Scholar]
- Sheng H., Shao J., Morrow J. D., Beauchamp R. D., DuBois R. N. Modulation of apoptosis and Bcl-2 expression by prostaglandin E2 in human colon cancer cells. Cancer Res. 1998;58:362–366. [PubMed] [Google Scholar]
- Shtutman M., Zhurinsky J., Simcha I., Albanese C., D'Amico M., Pestell R., Ben-Ze'ev A. The cyclin D1 gene is a target of the beta-catenin/LEF-1 pathway. Proc. Natl. Acad. Sci. USA. 1999;96:5522–5527. doi: 10.1073/pnas.96.10.5522. [DOI] [PMC free article] [PubMed] [Google Scholar]
- Smalley W. E., DuBois R. N. Colorectal cancer and nonsteroidal anti-inflammatory drugs. Adv. Pharmacol. 1997;39:1–20. doi: 10.1016/s1054-3589(08)60067-8. [DOI] [PubMed] [Google Scholar]
- Tapia J. C., Torres V. A., Rodriguez D. A., Leyton L., Quest A. F. Casein kinase 2 (CK2) increases survivin expression via enhanced beta-catenin-T cell factor/lymphoid enhancer binding factor-dependent transcription. Proc. Natl. Acad. Sci. USA. 2006;103:15079–15084. doi: 10.1073/pnas.0606845103. [DOI] [PMC free article] [PubMed] [Google Scholar]
- Telliez A., Furman C., Pommery N., Henichart J. P. Mechanisms leading to COX-2 expression and COX-2 induced tumorigenesis: topical therapeutic strategies targeting COX-2 expression and activity. Anticancer Agents Med. Chem. 2006;6:187–208. doi: 10.2174/187152006776930891. [DOI] [PubMed] [Google Scholar]
- Tong X., Yin L., Joshi S., Rosenberg D. W., Giardina C. Cyclooxygenase-2 regulation in colon cancer cells: modulation of RNA polymerase II elongation by histone deacetylase inhibitors. J. Biol. Chem. 2005;280:15503–15509. doi: 10.1074/jbc.M411978200. [DOI] [PubMed] [Google Scholar]
- Torres V. A., Tapia J. C., Rodriguez D. A., Lladser A., Arredondo C., Leyton L., Quest A. F. E-Cadherin is required for caveolin-1-mediated down-regulation of the inhibitor of apoptosis protein survivin via reduced β-catenin-Tcf/Lef-dependent transcription. Mol. Cell. Biol. 2007;27:7703–7717. doi: 10.1128/MCB.01991-06. [DOI] [PMC free article] [PubMed] [Google Scholar]
- Torres V. A., Tapia J. C., Rodriguez D. A., Parraga M., Lisboa P., Montoya M., Leyton L., Quest A. F. Caveolin-1 controls cell proliferation and cell death by suppressing expression of the inhibitor of apoptosis protein survivin. J. Cell Sci. 2006;119:1812–1823. doi: 10.1242/jcs.02894. [DOI] [PubMed] [Google Scholar]
- Tsujii M., Kawano S., DuBois R. N. Cyclooxygenase-2 expression in human colon cancer cells increases metastatic potential. Proc. Natl. Acad. Sci. USA. 1997;94:3336–3340. doi: 10.1073/pnas.94.7.3336. [DOI] [PMC free article] [PubMed] [Google Scholar]
- Wang M. T., Honn K. V., Nie D. Cyclooxygenases, prostanoids, and tumor progression. Cancer Metastasis Rev. 2007;26:525–534. doi: 10.1007/s10555-007-9096-5. [DOI] [PubMed] [Google Scholar]
- Watanabe K., Kawamori T., Nakatsugi S., Wakabayashi K. COX-2 and iNOS, good targets for chemoprevention of colon cancer. Biofactors. 2000;12:129–133. doi: 10.1002/biof.5520120120. [DOI] [PubMed] [Google Scholar]
- Zhang T., Otevrel T., Gao Z., Gao Z., Ehrlich S. M., Fields J. Z., Boman B. M. Evidence that APC regulates survivin expression: a possible mechanism contributing to the stem cell origin of colon cancer. Cancer Res. 2001;61:8664–8667. [PubMed] [Google Scholar]
Associated Data
This section collects any data citations, data availability statements, or supplementary materials included in this article.