

Abstract
The development of orientation preference maps was studied in ferret primary visual cortex using chronic optical imaging of intrinsic signals. The emergence and maturation of the maps were examined over time in single animals. The earliest age at which cortical domains selectively responsive to particular stimulus orientations were observed varied considerably between individuals, from postnatal day 31 to 36. In all cases, the earliest maps seen were low-contrast, with regions of orientation-specific activity that were difficult to distinguish from noise. These early maps matured over a period of several days into the high-contrast, patchy maps typical of adult animals. The structure of the orientation maps was remarkably constant over time. The indistinct features in the earliest maps were always patches of the same sizes and shapes and at the same locations as in the maps obtained in subsequent recording sessions. Details of the more mature maps, including the relative intensities of individual iso-orientation domains, were also constant from one recording session to another over periods of several weeks. The patterning of iso-orientation domains in ferret primary visual cortex thus is established early in development and remains stable over time, unaffected by either normal visual experience or the anatomical rearrangements of geniculocortical afferents into eye-specific domains.
Keywords: orientation map, development, ferret, optical imaging, visual system, cortex, activity dependence
Neurons are arranged with precise organization in the primary visual cortex of adult mammals. Radial columns of cortical cells have similar response properties, and receptive field properties, such as orientation preference, are mapped rather smoothly across the cortical surface (Hubel and Wiesel, 1962). Despite a long history of experiments addressing the emergence of these “cortical maps,” it is still not clear how this organization develops and what role visual experience plays in this process.
The tangential organization of orientation preference in primary visual cortex was first studied using extracellular electrophysiology (Hubel and Wiesel, 1962); later maps across cortex of the response to a single stimulus orientation were obtained using 2-deoxyglucose (2-DG) metabolic labeling techniques (Hubel et al., 1977; Albus, 1979;Schoppmann and Stryker, 1981; Singer, 1981; Thompson et al., 1983;Löwel et al., 1987). More recently, the details of cortical orientation maps have been studied using the technique of optical imaging (Blasdel and Salama, 1986; Grinvald et al., 1986; Ts’o et al., 1990; Bonhoeffer and Grinvald, 1991; Weliky et al., 1995), which provides a number of advantages over more conventional methods. Optical imaging of intrinsic signals allows responses to visual stimuli to be observed across a wide area of cortex simultaneously and also provides map information at a much higher spatial resolution than is possible using electrophysiological recording (Swindale et al., 1987). In addition, optical imaging allows the cortical responses to many different stimuli to be studied in the same area of cortex in the same experiment, which is not possible using metabolic labeling techniques such as 2-DG or cytochrome oxidase labeling.
Relatively little is known about the development of orientation preference maps in primary visual cortex. The development of orientation tuning at the single-cell level has been widely studied (monkey: Wiesel and Hubel, 1974; cat: Hubel and Wiesel, 1963; Barlow and Pettigrew, 1971; Blakemore and Van Sluyters, 1975; Buisseret and Imbert, 1976; Frégnac and Imbert, 1978; Albus and Wolf, 1984), but the single-unit electrophysiological results do not reveal anything about either the timing of map development or the tangential organization of early orientation maps. Metabolic labeling techniques such as 2-DG or cytochrome oxidase can provide some information about the early organization of the developing maps (LeVay et al., 1978; Des Rosier et al., 1978; LeVay et al., 1980; Thompson et al., 1983), but individual differences between animals in the onset of orientation development and in the patterning of the maps make these results difficult to interpret. Both electrophysiological recording experiments and 2-DG labeling studies can provide information only at a single time point in a given animal; therefore, these methods cannot be used to determine whether orientation maps are stable during development or whether the maps are continually rearranging. Obtaining an answer to this question is of considerable importance because it has profound implications for models of the development of response properties in visual cortex.
To examine the emergence, organization, and stability of orientation preference maps during development, we have developed a chronic method of optical imaging of intrinsic signals in very young animals. This technique allows orientation maps to be studied over long periods of time in individual animals. At the single-cell level, orientation tuning properties of cells in primary visual cortex previously have been found to mature very early in development. In the monkey, orientation tuning is adult-like at or soon after birth (Wiesel and Hubel, 1974); in the cat, maturation of orientation tuning occurs in the first few weeks of life (for review, see Blakemore and Van Sluyters, 1975; Freeman and Ohzawa, 1992). Optical imaging experiments in young monkeys so far have been limited to acute experiments and have confirmed that orientation maps are essentially adult-like at the earliest ages examined (Blasdel et al., 1995). Such acute experiments can, of course, not address the questions of map emergence or stability. Chronic optical imaging studies have been performed in kittens, but they have proved very difficult because of the fragility of the young animals (Kim and Bonhoeffer, 1993). To be able to perform chronic experiments during the time period of orientation map emergence and maturation, we have chosen the ferret as the experimental animal. Ferrets have a visual system that is quite similar to that of the cat (Law et al., 1988) and that develops at a similar rate from conception (Linden et al., 1981). However, the gestation period in the ferret is 42 d compared with 65 d in the cat, so that at a stage of visual system development equivalent to day of birth in the cat, the ferret is already 3 weeks old. Ferrets thus provide a physiologically robust preparation during the time period when orientation tuning at the single-cell level is maturing (Chapman and Stryker, 1993). Using chronic optical imaging of intrinsic signals in the ferret, we have been able to study the development in individual animals of the maps of orientation preference in primary visual cortex from before the first emergence of iso-orientation domains through the time at which orientation maps are fully mature.
MATERIALS AND METHODS
Optical imaging of intrinsic signals was used to examine the normal development of orientation maps over time in single animals. A total of 13 ferret pups (Marshall Farms, New Rose, NY) was used in these experiments. Imaging was performed through the intact dura to maintain an optimal physiological state over the course of multiple imaging sessions lasting several weeks. Maps of the distribution of cortical activity at each age were generated in response to moving square-wave gratings at each of four orientations: horizontal, vertical, and the two obliques.
Optical imaging. Each optical imaging recording session was performed under aseptic conditions. Anesthesia was induced using a mixture of xylazine (2–4 mg/kg) and ketamine (20–40 mg/kg) injected intramuscularly. Atropine (0.1 mg/kg) was injected subcutaneously. Animals were intubated, and anesthesia was maintained using halothane delivered in a 3:1 mixture of nitrous oxide:oxygen. Ventilation was adjusted to a rate and volume providing peak inspiratory pressure at 1.5 kPa and end-tidal carbon dioxide at 3.8–4.2%. Animals were placed on a heating pad to sustain a core temperature of 38°. Electroencephalogram, electrocardiogram, end-tidal carbon dioxide, arterial oxygen saturation (SpO2), and rectal temperature were monitored throughout the experiment. Subcutaneous injections of ∼1 ml of 5% dextrose Ringer’s/hour were administered to prevent dehydration.
The animals were placed in a modified kitten stereotaxic apparatus. In the initial recording session for each animal, the scalp was incised and retracted. A craniotomy was performed over the caudal pole of the left hemisphere. The dura remained intact. In subsequent recording sessions, the incision was reopened, the agar plug (see below) was removed from the craniotomy, and the dura was carefully cleaned using sterile cotton swabs.
Before imaging, 2% agar and a glass coverslip were applied over the craniotomy. Atropine and neosynephrine eye drops were used to dilate the pupil and paralyze accommodation, and to retract the nictitating membrane. Animals were fitted with contact lenses to focus the eyes on the monitor placed 33 cm in front of the animal. Visual stimuli were produced using custom-made software (STIM, Kaare Christian, Rockefeller University) and presented on the monitor. These stimuli consisted of drifting, square-wave gratings (drift velocity 10–15°/sec) at a spatial frequency chosen empirically to optimize the activity signal (This spatial frequency varies with age probably because of changing optics in the ferrets’ maturing eyes.) and were presented at four different orientations: horizontal, vertical, and the two obliques. Visual stimuli were presented binocularly during the recording sessions in five of eight animals; in the other three animals, motor-controlled shutter eye occluders were used to produce monocular stimuli.
The brain was illuminated through the dura using bandpass-filtered light at 605 ± 10 nm (Grinvald et al., 1986; Frostig et al., 1990). Images of the intrinsic signals produced by neuronal activity in response to the different visual stimuli were captured using a cooled charge-coupled device camera (Princeton Instruments) focused ∼500 μm below the cortical surface. Five frames of 600 msec duration were collected during each 3 sec stimulus presentation, followed by a 7 sec interstimulus interval. For analysis, the first frame was discarded. In most experiments, each stimulus was presented 128 times, with different stimuli randomly interleaved.
After each recording session, the agar and coverslip were removed and the craniotomy was flushed with sterile saline and covered over with a 3% agar plug containing broad-spectrum antibiotics. The fascia and scalp were sutured closed, and the scalp wound was infused with lidocaine and covered with topical iodine. The animal was then allowed to recover from anesthesia before being returned to its mother and littermates. After the final recording session, the animals were euthanized with an overdose of barbiturate.
Orientation maps. Single-condition activity maps: Signal averaging was used to reduce noise in the acquired images. To extract from the images only the small changes attributable to the visual stimulation and to remove nonstimulus-specific signals such as uneven illumination or blood-vessel artifacts, each orientation activity map was divided by a “cocktail blank” consisting of the sum of the images produced in response to all orientations (for details, seeBonhoeffer and Grinvald, 1993). Activity maps were calculated for responses to drifting square-wave gratings presented at horizontal, vertical, and the two obliques.
Angle and polar maps: To obtain a more comprehensive picture of the mapping of orientation preference across the cortical surface, the information from the single-condition activity maps for all four orientations of stimuli was combined into single, color-coded orientation preference maps using vectorial addition on a pixel-by-pixel basis. In “angle maps,” the vector angle is displayed as the hue of each pixel, indicating only the preferred orientation. In “polar maps,” the vector angle is again displayed as the hue of each pixel (indicating the preferred orientation), and the vector length is additionally encoded as the brightness of the color (indicating the strength of orientation tuning) (for details, seeBonhoeffer and Grinvald, 1993).
Cross-correlation analysis. Single-condition orientation maps from young animals were compared with mature single-condition maps by computing the cross-correlation between the maps. As a first step in this analysis, a region of interest (ROI) was determined for each animal to isolate only the area of the maps where orientation-specific activity was seen in the mature map. Information from the portion of the images outside the ROIs (including the image of the skull posterior to the caudal pole and the area of cortex anterior to the 17/18 border) was not considered in the analysis. The cross-correlograms were produced by calculating the correlation coefficient between two maps of similar orientation preference at x- andy-offsets of −30 to 30 pixels (each pixel corresponds to 36 μm across the cortical surface). This two-dimensional array of correlation coefficients then allowed us to get a meaningful measure of the degree of correlation between two maps even if they were not perfectly aligned.
Two-dimensional mean orientation similarity analysis. To assess map stability, early angle maps were compared with mature maps in each animal. As a control, maps obtained in each animal were also compared with mature maps from different animals.
This analysis consists of a comparison between two maps. As a first step in this analysis, ROIs for each map were determined as described above. Next, at each pixel within the intersection of ROIs, the difference between the preferred orientations in the two angle maps was calculated, to range between 0 (no difference in the orientation preference at that point) and 90 (the maximum possible difference between orientation preferences). The mean angle difference over all of the pixels within the intersection of ROIs was then calculated. To produce the two-dimensional plots, the two maps being compared were shifted across each other horizontally and vertically in one-pixel steps, and the mean orientation difference was calculated for each relative position of the two maps. Each pixel in these two-dimensional plots shows the mean orientation difference for a particular relative position of the two maps being compared.
The maximum mean orientation difference present in these plots was used to quantify the similarity between maps. These values were divided by 90 and subtracted from one to produce an index of similarity of two orientation maps, which varies between 0 and 1. If two identical maps are compared by this method, the orientation similarity index is one. If two maps are completely anticorrelated, with exactly orthogonal orientation preference at each point, the similarity index is zero. Comparison of two maps with no correlation in angle preference yields a similarity index of 0.5.
Auto-correlation analysis. Two-dimensional auto-correlations were performed on mature single-condition maps to determine the spatial structure of the maps and to assess the degree to which the maps were banded (stripy) as well as the angle of iso-orientation bands with respect to the area 17/18 border.
The auto-correlograms were produced exactly as described above for the cross-correlograms, only the maps were correlated with themselves.
Two-dimensional auto-correlations were also performed on single-condition maps from earlier recording sessions to determine the periodicity of iso-orientation domains. After producing auto-correlograms for each condition at each age, periodicity was assessed by determining the sine wave grating that showed the best fit to the auto-correlation of the map. The spatial period of this sine wave grating was then taken as a good estimate of the mean periodicity of the map.
Orientation tuning analysis. Analysis of the development of orientation tuning was done by using the median length of the vectors in the polar maps as a measure for orientation tuning. This calculation was again only performed within the ROI.
RESULTS
Chronic optical imaging experiments were performed in 13 juvenile ferrets. In three animals, multiple optical imaging recordings completed very early in development, between postnatal day (P) 26 and 29, showed no evidence for orientation-specific activity in the primary visual cortex at these ages. In eight animals, it was possible to perform four or more optical imaging sessions between P31 and P55; data from these animals are reported in this paper. Shorter data series that confirmed the conclusions drawn from these eight animals were obtained in two additional ferrets between P32 and P40.
A complete set of orientation maps from one developing animal, ferret 1-3-3630, is shown in Figure 1. The left side of this figure shows the activity maps obtained in this animal in response to four orientations of drifting square-wave gratings, and the right side of the figure shows angle and polar maps. Each row in the figure illustrates the maps obtained at a given age during development. In this and all subsequent figures, each map is presented with caudal up, medial to the left. The area of the images exhibiting orientation-specific activity corresponds to the exposed region of area 17. Blank areas where no activity maps can be seen result from the skull, which remained intact behind the caudal pole of cortex in the upper left corner of each image, or from cortical areas rostral to the approximate location of the 17/18 border, which did not respond to the visual stimuli used in this study. In the single-condition maps, areas of cortex that respond to a given stimulus appear dark, whereas nonresponsive areas are light. In the angle and polar maps, information from the four single-condition maps is combined to show how orientation preference is arranged across the cortex, with each hue representing a different preferred orientation; in polar maps, information about the strength of orientation tuning is additionally encoded as color brightness.
Fig. 1.
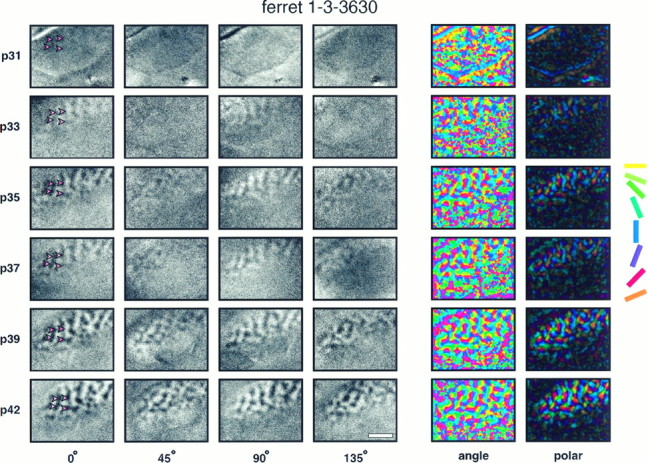
Development of orientation maps revealed by chronic optical imaging. Single-condition orientation maps, angle maps, and polar maps recorded at six different ages in one animal. Each row of the figure shows orientation maps recorded in the left primary visual cortex of one ferret at the age indicated at theleft of the row. Each column of single-condition maps shows orientation maps recorded in response to a particular orientation of a moving square-wave grating (0° = horizontal). For each map, caudal is up and medial is to the left. The curve in the upper left corner of each map indicates the location of the caudal pole of the cortex behind which the skull remained intact over the cerebellum. The approximate location of the area 17/18 border can be seen in each image as a linerostral to which no orientation activity is seen. In this example, the first clear orientation maps can be seen at P33. Early maps are stronger for horizontal and vertical orientations than for the two obliques. Individual iso-orientation domains remain stable over time and do not change their position, shape, or size. The four red arrows shown in each horizontal single-condition map highlight this stability by pointing to particular features in the map. The information from activity maps in response to all four orientations of stimuli are combined into a single color-coded angle and polar map using vectorial addition on a pixel-by-pixel basis. In angle maps, the hue of each pixel indicates the preferred orientation of cells at that location in cortex. The hue coding scheme is shown to theright of the figure. In polar maps, the hue again indicates the preferred orientation, whereas now the brightness of the color also indicates the strength of orientation tuning. At early ages, the polar maps are almost completely dark, indicating that there were no regions of the cortex that showed tightly tuned orientation-specific responses. As the maps mature, iso-orientation domains become visible as colored regions in the map. These domains become more strongly responsive over time, and more domains appear as the maps mature. Scale bar, 2 mm.
In ferret 1-3-3630, illustrated in Figure 1, little or no orientation-specific activity is seen in the single-condition maps at the earliest age of imaging, P31. By P33, iso-orientation domains are clearly visible, at least in response to vertical and horizontal stimuli. Orientation activity maps continue to become stronger over time, reaching adult-like clarity by P42, the final recording session in this animal. This progression of development is also shown in the polar maps for this animal, where the increasing brightness of the color of the maps with age indicates an increase in the strength of orientation tuning as the animal matures.
Single-condition orientation maps for a second animal, ferret 1-5-413, are shown in Figure 2. The same general pattern of development was seen in this animal, with early faint activity maps at P36 developing into mature maps by P41. The timing of development in ferret 1-5-413 was quite different, however, with little or no orientation-specific activity seen at P34, when relatively good maps were already present in ferret 1-3-3630.
Fig. 2.

Concurrent development of all orientation maps. Single-condition orientation activity maps from a second ferret. In this animal, activity maps for all orientations developed at the same rate. Note that in this ferret the first orientation maps are visible at a substantially later time (P36) than in the example shown in Figure1. All conventions as in Figure 1.
The first age at which iso-orientation domains were visible in ferret primary visual cortex varied considerably among animals, from P31 to P36. In all animals, however, the earliest observed maps were low-contrast, with orientation domains difficult to distinguish from noise. The maps then matured over several days’ time into the high-contrast, patchy orientation maps seen in adult animals. The initial emergence of orientation maps occurred about the time of natural eye opening, which varies considerably between individuals in the ferret. However, there was no clear correlation between the age of first visual experience and the timing of map emergence. In some animals, the eyes were surgically opened at the time of the initial optical imaging session and very faint maps were already seen, whereas in other animals no activity maps were seen for several days after the eyes had opened naturally.
In addition to the inter-animal variability in the timing of map development, early development of iso-orientation domains responding to horizontal and vertical stimuli was seen in some, but not all, animals. An example of this early development of horizontal and vertical responses occurred in the animal illustrated in Figure 1, in which horizontal and vertical maps could be seen at P33, whereas oblique maps did not appear until P35. In contrast, in the animal illustrated in Figure 2, responses to all orientations of stimuli were first seen at P36 and appeared to mature at the same rate. The tendency for horizontal and vertical maps to develop early is fully discussed elsewhere (Chapman and Bonhoeffer, 1994).
Perhaps the most striking property of the developing orientation maps in ferret primary visual cortex is their constancy over time. Features of orientation domains that can barely be distinguished in the earliest maps are always present as patches of the same size, shape, and location in later recording sessions from the same animal. Fine features of the more mature maps, including the relative intensities of individual patches of iso-orientation activity, are also stable over a period of several weeks, the longest time investigated in our study. This stability of the maps over time can be seen in all of the maps presented in this paper, and it was also evident in all of the other ferrets studied. This stability is evident in Figure 1, and it is highlighted by the use of arrows pointing to particular map features that can be clearly seen at all ages of development. For example, the top right arrow points to an elongated region of cortex that responded strongly to horizontal stimuli. This region is constant in location and shape in the five maps obtained between P33 and P42 and may even have been present at P31, where little orientation-specific activity was seen.
As a first, obvious step in quantifying the stability of the orientation preference maps obtained from developing ferret visual cortex, a cross-correlation analysis was used to compare early single-condition maps in each animal with the most mature maps obtained for that animal (data not shown). The two-dimensional cross-correlation analysis did reveal both the stability of the maps over time and the increasing strength of orientation tuning in the cortex during development, which is seen qualitatively in the single-condition maps. Map stability was evident in the similar spatial structure of the correlation plots obtained at each age, and maturation of tuning was seen as an increase in the maximum correlation of the maps with age.
However, cross-correlation of the single-condition maps with mature maps was not an ideal method for measuring either map stability or tuning maturation. Because the strength of tuning in the maps heavily influenced the correlation coefficient, the analysis could not be used to produce a stability metric. Because horizontal and vertical orientation preferences develop earlier than oblique preferences in some animals (Chapman and Bonhoeffer, 1994), the cross-correlation analysis also could not produce a single measure to assess the strength of orientation tuning at a given age, because cross-correlations were higher for horizontal and vertical single-condition maps in those animals. Therefore, new analyses were devised to measure these developmental features. The orientation similarity index used to measure map stability is described below and illustrated in Figures 3and 4; the measurement of orientation tuning is described in the Discussion and illustrated in Figure 7.
Fig. 3.
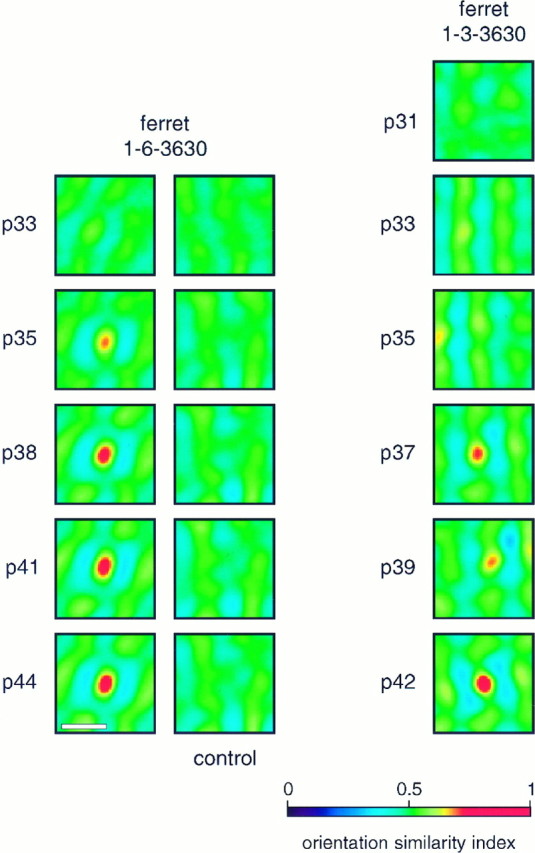
Orientation similarity plots. Orientation similarity plots for two animals. For both animals, plots comparing early maps with the most mature maps are shown. For ferret 1-6-3630, control data comparing early maps with the mature map from a different animal are shown. Ferret 1-3-3630 is the animal illustrated in Figure1. Scale bar, 1 mm.
Fig. 4.

Stability of orientation maps. The maximum similarity index calculated from the orientation similarity plots (see Fig. 3) for all animals at all ages is shown. Filled squares show within-animal comparisons and open squares show between-animal (control) comparisons. The height of the histogram bars indicates the mean of the maximum orientation similarity indices for each animal at all ages.Gray squares indicate data from immature maps recorded before P35. Additional control data showing the comparison of mature maps in each animal with a map consisting of randomized pixels is shown at the far right.
Fig. 7.

Comparison of the development of orientation tuning assessed by optical imaging and electrophysiology.A, Orientation tuning derived from polar maps for each animal at each age studied. Solid curves show the best-fit cumulative Gaussian sigmoid curve for individual animals. Thedashed line indicates the best-fit curve for data from all eight animals. The time of eye opening for each animal is also indicated. Although orientation maps did begin to appear about the time of eye opening, note that early eye opening was not always correlated with early development of maps. B, Orientation tuning assessed electrophysiologically from single-unit recordings compared with optical imaging of the development of orientation tuning. Single-unit data from Chapman and Stryker (1993). Mean orientation tuning indices derived from orientation tuning histograms collected from single-unit recordings are shown for 16 animals of different ages. Note that values of this orientation tuning index greater than 25–30 correspond to a significantly biased response in favor (Figure legend continues) of one orientation. Values of this index measured on neurons in the lateral geniculate nucleus of the ferret were <25; the median value for neurons in primary visual cortex of the cat was 55–60 (Chapman and Stryker, 1993). The solid curve indicates the best sigmoid-fit curve through these data. The best-fit curve for the optical imaging data (dashed line) is replotted from Figure 7A for comparison. The mean of the best-fit sigmoid for the electrophysiological data is 4 d earlier (P33.4) than the mean for the optical imaging data (P37.4).
To develop a quantitative measure of stability, early angle maps in each animal were compared with the mature angle map in the same animal. This comparison, unlike the single-condition map cross-correlation analysis, is independent of map strength because angle maps only show preferred orientation without containing any information about tuning strength. To perform the angle map comparison, orientation similarities between the early and the mature map were determined at each point. The mean orientation similarity was then calculated across the map. Because the two maps may not have been in perfect spatial alignment with each other, the mean orientation similarity between the maps was calculated at relative offsets of the two maps, ranging from −30 to 30 pixels in the x and y directions (each pixel corresponds to 36 μm across the cortical surface). Two-dimensional plots of mean orientation similarities were thus produced for each map comparison. As a control, the developing maps in each animal were compared with the mature map from another animal. Examples of such orientation similarity plots are shown for two animals in Figure 3. For ferret 1-6-3630, both the analysis and the control plots are shown; for 1-3-3630, only the analysis is shown because the controls for all animals were very similar. The locations of the “hot spots” near the centers of orientation similarity plots show the relative position at which the two angle maps were best aligned. The high values of orientation similarity at these hot spots indicate the high degree of similarity in the maps being compared. For both animals, at early ages when little or no orientation-specific activity was seen, the plots lack convincing hot spots, showing the anticipated low similarity of essentially blank maps with the mature maps. For ferret 1-6-3630, developing maps after P33 were very similar to the mature maps, indicating a very high degree of stability. Although the magnitude of the similarity was smaller for the earlier maps, the spatial structure of the plot was the same even at P35, when the orientation map first emerged, indicating that the earliest map already had similar organization to the mature map. The control plots shown for this animal reveal that, as expected, maps from one animal were not very similar to the mature map seen in a different animal. For ferret 1-3-3630, the magnitude of the similarity shown at P33 was low, but already above control, indicating that in this animal as well, maps were stable throughout development. The spatial structure of the early plots for this ferret, however, was quite different from that seen for more mature maps. This is because, as shown in Figure 1, horizontal and vertical maps in this animal developed earlier than oblique maps, so that the spatial components of the plot that reflect the oblique maps were missing at early ages.
The maximum value of the two-dimensional mean orientation similarity plots was used as a measure of map stability, as illustrated in Figure4. In this figure, the orientation similarity index for each age is shown for each animal as a filled square, with the height of the histogram bar indicating the mean. Gray squares show similarity indices calculated for maps obtained at early ages (before P35). Open squares show control orientation similarity indices calculated by comparing maps obtained at each age with the mature map from a different animal; the height of the bar again indicates the mean. For all animals studied, the degree of similarity between early and mature maps was high at all ages except in some cases at the earliest time points where little or no orientation-specific activity was seen. There is only one case in which there is any overlap between the real orientation similarities for maps obtained after P35 and the control orientation similarities; this exception is seen for ferret 1-1-4479, which was not respirated at the earliest time points, resulting in poor activity maps. In contrast, little similarity was seen between maps in one animal and maps in another animal, shown by the control bars in the histogram. This small degree of similarity, however, was larger than the similarity seen between real angle maps and random pixel maps, which is shown in the right-most bar of the histogram. The slight similarity seen between maps from different animals presumably is a reflection of the similar width of orientation “stripes” between animals and the tendency of these stripes to run perpendicular to the 17/18 border in all animals (see below).
The developing orientation maps seen in different animals varied considerably in their spatial structure. In some animals, including that illustrated in Figure 1, the maps appeared somewhat spotted, whereas in other animals, including that illustrated in Figure 2, single-condition maps were more stripy in appearance. In one of the eight animals studied, ferret 1-3-413, the orientation maps looked quite disorganized. Single-condition maps for this animal are shown in Figure 5. Images of the blood vessel pattern on the surface of the brain photographed at each age are shown on the right side of the figure. These images allow blood vessel artifacts (an example of which is indicated by the arrows in the P39 maps) to be identified. Despite the odd appearance of the maps, these maps were clearly real representations of orientation preference and not artifactual, because individual features of the maps are present at all ages studied. Therefore, the orderly appearance of maps published elsewhere (Blasdel and Salama, 1986; Grinvald et al., 1986; Ts’o et al., 1990; Bonhoeffer and Grinvald, 1991; Weliky et al., 1995) is not seen in all instances, at least in the ferret. Even so, this ferret did exhibit the same stability of map features during development as was found in all of the animals in this study (see Fig. 4). In addition, examination of the angle maps obtained in this ferret and all of the animals studied (see examples in Fig. 1) reveals that orientation preference maps in ferret primary visual cortex are similar to those seen in other species, with relatively smooth mapping of orientation across the cortex punctuated by “pinwheels.”
Fig. 5.

“Disorganized” activity maps seen in one animal. Single-condition activity maps from one animal in which orientation activity maps did not have the usual spotty or stripy appearance seen in the other ferrets in this study. Instead, maps appeared “disorganized.” This structure of the map was real, as it was reproducible between experiments performed at different ages of the animal. It was not attributable to blood vessel artifacts, as shown by the photographs of the cortical surface showing blood vessel patterns illustrated in the right-most column. There are some blood vessel artifacts in these maps (one example is indicated by thearrowheads in the maps recorded at P39), but they are easily discernible and they do not account for the observed activity pattern. Scale bar, 2 mm.
One feature observed in the animals that had the more stripy patterns of orientation maps was a tendency of the stripes to run perpendicular to the area 17/18 border. To quantify this effect, all four mature single-condition maps from all eight animals were examined. Spatial auto-correlograms were performed on each map to reveal any anisotropies. These auto-correlograms are shown in Figure6A. Long, straight bands of anticorrelation (blue-black) were present in the auto-correlograms made from maps that were stripy, whereas a more circular or cross-shaped pattern is seen in other maps. To determine the relationship between the iso-orientation stripes and the 17/18 border, the best-fitting sine wave grating to each correlogram was determined, and the angle of this sign wave with respect to the 17/18 border was measured. Results of this analysis are shown in Figure 6B. The histogram indicates that in the majority of maps, iso-orientation stripes tend to run perpendicular to the areal border, and in no maps do the stripes run parallel or near-parallel to the border.
Fig. 6.
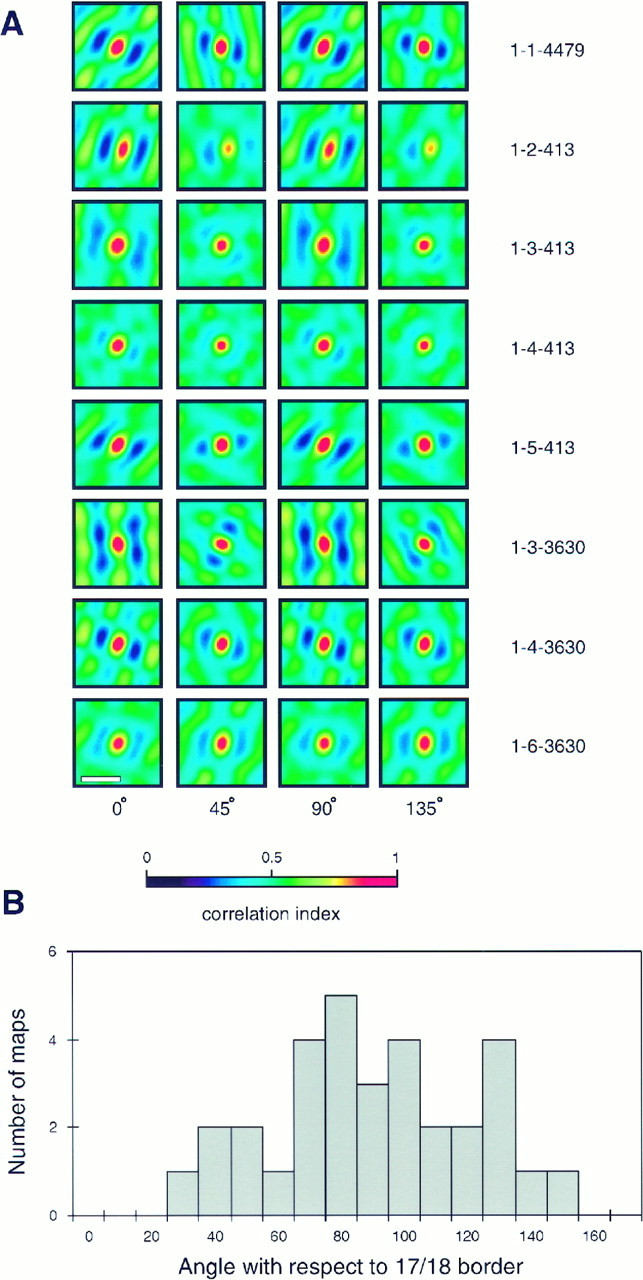
Spatial structure of orientation preference maps.A, Two-dimensional spatial auto-correlograms are shown for mature single-condition orientation maps in each animal. Scale bar, 1 mm. B, Histogram of the angle between the angle of the best-fitting sine-wave grating and the area 17/18 border for all animals.
Auto-correlograms were also produced for all of the earlier maps obtained in each animal to determine the spacing of orientation stripes during development. The average periodicity seen in the grouped data from all animals at all ages studied was 872 ± 65 μm. Analysis confirmed that the spacing seen in orientation maps was very constant during development, as was expected from observation of the maps and from the high degree of stability shown by the orientation similarity index. The changes seen in periodicity within individual animals varied from 3 to 12%; in no animal was there any tendency for periodicity to increase with age over the period examined. The constant spacing seen over time, together with the constant appearance of blood-vessel pictures (e.g., in Fig. 5), suggests that there is little growth in the size of the brain during the period between P31 and P55, at least in the cortical areas investigated in this study.
DISCUSSION
Using the technique of chronic optical imaging of intrinsic signals, we have examined the development of orientation preference maps in ferret primary visual cortex. We have found that orientation activity maps are initially low-contrast and that they mature over several days into high-contrast, adult-like maps. During this period of maturation, the features of the developing maps are very stable. Despite differences among animals in the timing of map emergence and the individual spatial layout of the maps, the overall course of development was similar in all eight ferrets studied.
The time course of the map maturation found in this study closely parallels, but appears to lag slightly behind, the time course of orientation tuning maturation previously seen at the single-cell level in electrophysiological recordings from young ferret visual cortex (Chapman and Stryker, 1993). The development of orientation tuning determined from optical imaging experiments is illustrated in Figure7A. This figure shows the orientation tuning calculated from the polar maps obtained in all of the animals in this study at all ages examined. The solid sigmoid curves show the best-fit normal distribution for these data in each individual animal, and the dashed line indicates the best fit for data from all animals. The time of eye opening is also shown for each animal. For comparison, this summary distribution of developing tuning seen in optical imaging experiments is replotted in Figure 7B (dashed curve) along with the development of tuning seen in electrophysiological recording data [solid curve shows best-fit sigmoid; data replotted from Chapman and Stryker (1993), their Figs. 3, 4]. A time difference of several days is seen between the development of orientation at the single-cell level and that seen in the activity maps. This cannot be explained by differences in the rate of maturation of orientation tuning in different cortical layers; the supragranular layers that are responsible for most of the signal obtained in optical imaging (Bonhoeffer and Grinvald, 1996) are the layers where orientation first matures at the single-cell level (Chapman and Stryker, 1993). The difference in the timing of the development of orientation tuning assessed by the two different techniques has several possible explanations. First, the difference may be attributable to a difference in the sensitivity of the two techniques. Because optical imaging cannot measure tuning of individual cells, it may not be able to assess the earliest development of orientation tuning when only a few individual cells in the cortex first become well-tuned for orientation. In addition, optical imaging may be less sensitive to early orientation tuning because cortical cells at the earliest ages that orientation is seen electrophysiologically are less responsive than more mature cells (Chapman and Stryker, 1993). Second, it is possible that the difference in time course might not be caused by the different sensitivities of the two techniques, but rather might indicate that at early ages cells tuned for different orientations might be intermingled and might sort out into iso-orientation domains during development. The marked stability seen in the orientation tuning maps as soon as they appear, however, makes this explanation of the timing difference less than likely.
The observed stability of orientation maps in supragranular cortical layers is a surprising result given the massive rearrangements of the connections to the cortical cells that are known to occur during the developmental time period covered by our experiments. Not only do eye-specific afferents segregate into ocular dominance columns in layer IV during this period, greatly altering the geniculate inputs to a given orientation column (LeVay et al., 1978; Des Rosier et al., 1978;LeVay et al., 1980; Thompson et al., 1983; Ruthazer et al., 1995), but intracortical patchy connections within cortical layers II/III undergo substantial refinement during this period of development (Callaway and Katz, 1990; Ruthazer and Stryker, 1994). The constancy of the orientation preference maps in the face of such extensive changes in the connectivity of cortical cells suggests the primacy of orientation preference as an organizing feature in visual cortex. This conclusion is also supported by experiments double-labeling the patchy intracortical connections at two time points in individual animals. These experiments suggest that the general pattern of orientation columns is present early and changes little—if at all—during development (Callaway and Katz, 1990).
The stability of orientation maps during normal development observed in this study is, in fact, very much in line with results from several other experiments. We have found not only that orientation tuning is present in primary visual cortex much earlier than other cortical features such as ocular dominance columns, but also that as soon as orientation-specific activity is seen with optical imaging and very shortly after it is evident in the responses of more than a few single units, orientation preference is already mapped across cortex with the same map features found in mature animals. Other studies have shown that orientation maps are continuous across areal borders in normal animals (Bonhoeffer et al., 1995) and across ocular dominance columns in strabismic animals (Löwel et al., 1994). In addition, the features of orientation maps are unaffected by monocular deprivation and reverse occlusion (Kim and Bonhoeffer, 1994) despite the dramatic anatomical rearrangements of geniculocortical axons produced by brief periods of monocular deprivation (Antonini and Stryker, 1993), and matching orientation maps develop for the two eyes even in animals raised under a reverse-suture paradigm from the time of natural eye opening, such that the two eyes never have common visual experience (Gödecke and Bonhoeffer, 1996). These reports, along with the present results, suggest that the smooth mapping of orientation preference across cortex constitutes a remarkably stable framework for the development of other features of cortical organization.
Although this study was not designed to assess the role of visual experience, its results indicate that visual experience plays little or no role in determining the layout of orientation maps. Faint orientation activity maps having the same features as the mature maps were seen in the initial imaging session in at least one animal before the time of natural eye opening, and early eye opening did not correlate with early development of orientation maps (see Fig.7A). In addition, the stability of the maps during development shows that the map structure was not altered by the animals’ normal visual experience. These results are consistent with the fact that orientation tuning at the single-cell level has been found to be present at birth in the monkey (Wiesel and Hubel, 1974) and about the time of natural eye opening in the cat (for review, seeBlakemore and Van Sluyters, 1975). The stability of orientation maps during early development reinforces the interpretation (Stryker et al., 1978) that the plasticity of orientation preference that seems to occur after restricted early visual experience with oriented contours (Blakemore and Cooper, 1970) is in fact attributable to selective orientation-dependent losses in responsiveness of single cells rather than genuine changes in orientation preference of the cells. Future experiments will be required to test this interpretation directly, but the use of optical imaging for such purposes is fraught with the peril of potential artifact. Imaging relies on aggregate responses of populations and thus has more difficulty than single-unit recording in distinguishing a selective loss of responsiveness in some cortical columns from a reorganization of the columns.
The tendency of iso-orientation stripes to run perpendicular to the area 17/18 border, which was noted in the orientation maps obtained in this study, is surprising given previous reports that in the adult ferret, ocular dominance columns also tend to run perpendicular to the areal border (Law et al., 1988). The precise relationship between orientation maps and ocular dominance maps in individual animals remains to be determined.
Our studies of the emergence and maturation of cortical orientation maps suggest that orientation selectivity may be the primary organizing feature of the developing visual cortex. Smooth mapping of orientation preference emerges very early in cortical development, and once established, the maps remain stable despite the anatomical rearrangements of connections to the cortical cells. In addition, details of the organization of the maps are not affected by normal visual experience. This primacy of orientation has profound implications for how we think about the development of the visual cortex. These results raise questions about what could be the substrate for map stability given the massive alterations in geniculocortical and intracortical connections that fail to affect the maps. In addition, these results provide groundwork for future theoretical and experimental studies of how the organization of orientation may guide the development of the organization of other cortical cell receptive field properties such as ocular dominance.
Footnotes
This work was supported by the Max Planck Gesellschaft, Human Frontier Science Program Grant RG 69/93 to T.B. and M.P.S., and National Institutes of Health Grant EY09760 to M.P.S. We thank Frank Brinkmann for expert technical assistance.
Correspondence should be addressed to Tobias Bonhoeffer, Max Planck Institute for Psychiatry, Am Klopferspitz 18A, 82152 Munich-Martinsried, Germany.
Barbara Chapman’s present address: Center for Neuroscience, 1544 Newton Court, University of California, Davis, CA 95616.
REFERENCES
- 1.Albus K. 14C-deoxyglucose mapping of orientation subunits in the cat’s visual cortical areas. Exp Brain Res. 1979;37:609–613. doi: 10.1007/BF00236828. [DOI] [PubMed] [Google Scholar]
- 2.Albus K, Wolf K. Early postnatal development of neuronal function in the kitten’s visual cortex: a laminar analysis. J Physiol (Lond) 1984;348:153–185. doi: 10.1113/jphysiol.1984.sp015104. [DOI] [PMC free article] [PubMed] [Google Scholar]
- 3.Antonini A, Stryker MP. Rapid remodeling of axonal arbors in the visual cortex. Science. 1993;260:1819–1821. doi: 10.1126/science.8511592. [DOI] [PubMed] [Google Scholar]
- 4.Barlow HB, Pettigrew JD. Lack of specificity of neurones in the visual cortex of young kittens. J Physiol (Lond) 1971;218:P98–P100. [PubMed] [Google Scholar]
- 5.Blakemore C, Cooper GF. Development of the brain depends on the visual environment. Nature. 1970;228:477–478. doi: 10.1038/228477a0. [DOI] [PubMed] [Google Scholar]
- 6.Blakemore C, Van Sluyters R. Innate and environmental factors in the development of the kitten’s visual cortex. J Physiol (Lond) 1975;248:663–716. doi: 10.1113/jphysiol.1975.sp010995. [DOI] [PMC free article] [PubMed] [Google Scholar]
- 7.Blasdel GG, Salama G. Voltage-sensitive dyes reveal a modular organization in monkey striate cortex. Nature. 1986;321:579–585. doi: 10.1038/321579a0. [DOI] [PubMed] [Google Scholar]
- 8.Blasdel G, Obermayer K, Kiorpes L. Organization of ocular dominance and orientation columns in the striate cortex of neonatal macaque monkeys. Vis Neurosci. 1995;12:589–603. doi: 10.1017/s0952523800008476. [DOI] [PubMed] [Google Scholar]
- 9.Bonhoeffer T, Grinvald A. Iso-orientation domains in cat visual cortex are arranged in pinwheel-like patterns. Nature. 1991;353:429–431. doi: 10.1038/353429a0. [DOI] [PubMed] [Google Scholar]
- 10.Bonhoeffer T, Grinvald A. The layout of iso-orientation domains in area 18 of cat visual cortex. Optical imaging reveals a pinwheel-like organization. J Neurosci. 1993;13:4157–4180. doi: 10.1523/JNEUROSCI.13-10-04157.1993. [DOI] [PMC free article] [PubMed] [Google Scholar]
- 11. Bonhoeffer T, Grinvald A. Optical imaging based on intrinsic signals: the methodology. Toga A, Mazziotta J. Brain mapping: the methods 1996. Academic; New York: in press. [Google Scholar]
- 12.Bonhoeffer T, Kim DS, Malonek D, Shoham D, Grinvald A. Optical imaging of the layout of functional domains in area 17 and across the area 17/18 border in cat visual cortex. Eur J Neurosci. 1995;7:1973–1988. doi: 10.1111/j.1460-9568.1995.tb00720.x. [DOI] [PubMed] [Google Scholar]
- 13.Buisseret P, Imbert M. Visual cortical cells: their developmental properties in normal and dark-reared kittens. J Physiol (Lond) 1976;255:511–525. doi: 10.1113/jphysiol.1976.sp011293. [DOI] [PMC free article] [PubMed] [Google Scholar]
- 14.Callaway EM, Katz LC. Emergence and refinement of clustered horizontal connections in cat striate cortex. J Neurosci. 1990;10:1134–1153. doi: 10.1523/JNEUROSCI.10-04-01134.1990. [DOI] [PMC free article] [PubMed] [Google Scholar]
- 15.Chapman B, Bonhoeffer T. Chronic optical imaging of the development of orientation domains in ferret area 17. Soc Neurosci Abstr. 1994;20:214. [Google Scholar]
- 16.Chapman B, Stryker MP. Development of orientation selectivity in ferret visual cortex and effects of deprivation. J Neurosci. 1993;13:5251–5262. doi: 10.1523/JNEUROSCI.13-12-05251.1993. [DOI] [PMC free article] [PubMed] [Google Scholar]
- 17.Des Rosier MH, Sakurada O, Jehle J, Shinohara M, Kennedy C, Sokoloff L. Functional plasticity in the immature striate cortex of the monkey shown by the [14C]deoxyglucose method. Science. 1978;200:447–449. doi: 10.1126/science.417397. [DOI] [PubMed] [Google Scholar]
- 18.Freeman RD, Ohzawa I. Development of binocular vision in the kitten’s striate cortex. J Neurosci. 1992;12:4721–4736. doi: 10.1523/JNEUROSCI.12-12-04721.1992. [DOI] [PMC free article] [PubMed] [Google Scholar]
- 19.Frégnac Y, Imbert M. Early development of visual cortical cells in normal and dark-reared kittens: the relationship between orientation selectivity and ocular dominance. J Physiol (Lond) 1978;278:27–44. doi: 10.1113/jphysiol.1978.sp012290. [DOI] [PMC free article] [PubMed] [Google Scholar]
- 20.Frostig RD, Lieke EE, Ts’o DY, Grinvald A. Cortical functional architecture and local coupling between neuronal activity and the microcirculation revealed by in vivo high-resolution optical imaging of intrinsic signals. Proc Natl Acad Sci USA. 1990;87:6082–6086. doi: 10.1073/pnas.87.16.6082. [DOI] [PMC free article] [PubMed] [Google Scholar]
- 21.Gödecke I, Bonhoeffer T. Development of identical orientation maps for two eyes without common visual experience. Nature. 1996;379:251–254. doi: 10.1038/379251a0. [DOI] [PubMed] [Google Scholar]
- 22.Grinvald A, Lieke E, Frostig RD, Gilbert CD, Wiesel TN. Functional architecture of cortex revealed by optical imaging of intrinsic signals. Nature. 1986;324:361–364. doi: 10.1038/324361a0. [DOI] [PubMed] [Google Scholar]
- 23.Hubel DH, Wiesel TN. Receptive fields, binocular interaction and functional architecture in the cat’s visual cortex. J Physiol (Lond) 1962;160:106–154. doi: 10.1113/jphysiol.1962.sp006837. [DOI] [PMC free article] [PubMed] [Google Scholar]
- 24.Hubel DH, Wiesel TN. Receptive fields of cells in striate cortex of very young, visually inexperienced kittens. J Neurophysiol. 1963;26:994–1002. doi: 10.1152/jn.1963.26.6.994. [DOI] [PubMed] [Google Scholar]
- 25.Hubel DH, Wiesel TN, Stryker MP. Orientation columns in macaque monkey visual cortex demonstrated by the 2-deoxyglucose autoradiographic technique. Nature. 1977;269:328–330. doi: 10.1038/269328a0. [DOI] [PubMed] [Google Scholar]
- 26.Kim DS, Bonhoeffer T. Chronical observation of the emergence of iso-orientation domains in kitten visual cortex. Soc Neurosci Abstr. 1993;19:1800. [Google Scholar]
- 27.Kim DS, Bonhoeffer T. Reverse occlusion leads to a precise restoration of orientation preference maps in visual cortex. Nature. 1994;370:370–372. doi: 10.1038/370370a0. [DOI] [PubMed] [Google Scholar]
- 28.Law MI, Zahs KR, Stryker MP. Organization of primary visual cortex (area 17) in the ferret. J Comp Neurol. 1988;278:157–180. doi: 10.1002/cne.902780202. [DOI] [PubMed] [Google Scholar]
- 29.LeVay S, Stryker MP, Shatz CJ. Ocular dominance columns and their development in layer IV of the cat’s visual cortex: a quantitative study. J Comp Neurol. 1978;179:223–244. doi: 10.1002/cne.901790113. [DOI] [PubMed] [Google Scholar]
- 30.LeVay S, Wiesel TN, Hubel DH. The development of ocular dominance columns in normal and visually deprived monkeys. J Comp Neurol. 1980;191:1–51. doi: 10.1002/cne.901910102. [DOI] [PubMed] [Google Scholar]
- 31.Linden DC, Guillery RW, Cucciaro J. The dorsal lateral geniculate nucleus of the normal ferret and its postnatal development. J Comp Neurol. 1981;203:189–211. doi: 10.1002/cne.902030204. [DOI] [PubMed] [Google Scholar]
- 32.Löwel S, Freeman B, Singer W. Topographic organization of the orientation column system in large flat-mounts of the cat visual cortex: a 2-deoxyglucose study. J Comp Neurol. 1987;255:401–415. doi: 10.1002/cne.902550307. [DOI] [PubMed] [Google Scholar]
- 33.Löwel S, Schmidt KE, Kim D-S, Singer W, Bonhoeffer T. Continuity of iso-orientation domains across ocular dominance borders in area 17 of strabismic cats. Eur J Neurosci (Suppl) 1994;7:77. doi: 10.1046/j.1460-9568.1998.00274.x. [DOI] [PubMed] [Google Scholar]
- 34.Ruthazer ES, Stryker MP. Development of long-range horizontal connections in ferret primary visual cortex. Soc Neurosci Abstr. 1994;20:1108. [Google Scholar]
- 35.Ruthazer ES, Baker GE, Stryker MP. Development and pattern of ocular dominance columns in ferret visual cortex. Soc Neurosci Abstr. 1995;21:1795. [Google Scholar]
- 36.Schoppmann A, Stryker MP. Physiological evidence that the 2-deoxyglucose method reveals orientation columns in cat visual cortex. Nature. 1981;293:574–576. doi: 10.1038/293574a0. [DOI] [PubMed] [Google Scholar]
- 37.Singer W. Topographic organization of orientation columns in the cat visual cortex. A deoxyglucose study. Exp Brain Res. 1981;44:431–436. doi: 10.1007/BF00238836. [DOI] [PubMed] [Google Scholar]
- 38.Stryker MP, Sherk H, Leventhal AG, Hirsch HVB. Physiological consequences for the cat’s visual cortex of effectively restricting early visual experience with oriented contours. J Neurophysiol. 1978;41:896–909. doi: 10.1152/jn.1978.41.4.896. [DOI] [PubMed] [Google Scholar]
- 39.Swindale NV, Matsubara JA, Cynader MS. Surface organization of orientation and direction selectivity in cat area 18. J Neurosci. 1987;7:1414–1427. doi: 10.1523/JNEUROSCI.07-05-01414.1987. [DOI] [PMC free article] [PubMed] [Google Scholar]
- 40.Thompson ID, Kossut M, Blakemore C. Development of orientation columns in cat striate cortex revealed by 2-deoxyglucose autoradiography. Nature. 1983;301:712–715. doi: 10.1038/301712a0. [DOI] [PubMed] [Google Scholar]
- 41.Ts’o DY, Frostig RD, Lieke EE, Grinvald A. Functional organization of primate visual cortex revealed by high resolution optical imaging. Science. 1990;249:417–420. doi: 10.1126/science.2165630. [DOI] [PubMed] [Google Scholar]
- 42.Weliky M, Kandler K, Fitzpatrick D, Katz LC. Patterns of excitation and inhibition evoked by horizontal connections in visual cortex share a common relationship to orientation columns. Neuron. 1995;15:541–552. doi: 10.1016/0896-6273(95)90143-4. [DOI] [PubMed] [Google Scholar]
- 43.Wiesel TN, Hubel D. Ordered arrangement of orientation columns in monkeys lacking visual experience. J Comp Neurol. 1974;158:307–318. doi: 10.1002/cne.901580306. [DOI] [PubMed] [Google Scholar]