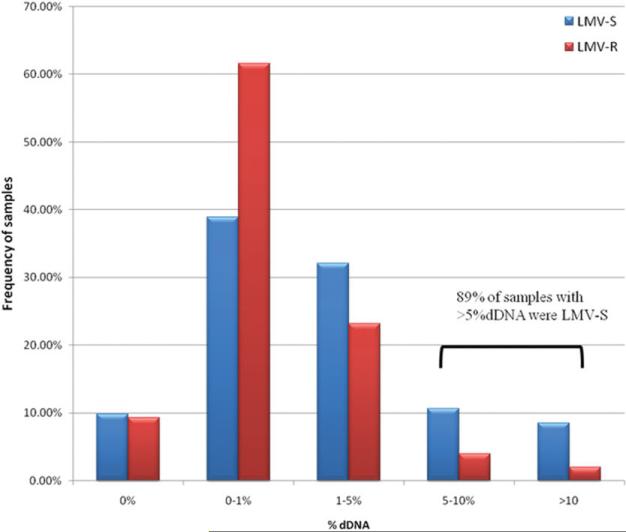
Fig. 1.
The relative abundance of defective DNA in persons infected with lamivudine-sensitive (LMV-S) and resistant (LMV-R) HBV. Samples were separated into discrete % dDNA ranges, and the frequency with which each range was represented in the population (y axis) was plotted against the midpoint of the range (x axis). The ranges used were 0%, >0%, and <1%, >1% and <%5, >5% and <10%, and >10%. Eighty-nine percent of samples with >5% dDNA were LMV-S, compared with 70% of samples being LMV-S overall.

