

Abstract
Aim
The adiponutrin gene family consists of five genes (PNPLA1-5) coding for proteins with both lipolytic and lipogenic properties. PNPLA3 has previously been associated with adult obesity. Here we investigated the possible association between genetic variants in these genes and childhood and adolescent obesity.
Methods/Results
Polymorphisms in the five genes of the adiponutrin gene family were selected and genotyped using the Sequenom platform in a childhood and adolescent obesity case-control study. Six variants in PNPLA1 showed association with obesity (rs9380559, rs12212459, rs1467912, rs4713951, rs10947600, and rs12199580, p<0.05 after adjustment for age and gender). Three variants in PNPLA3 showed association with obesity before, but not after, adjustment for age and gender (rs139051, rs12483959, and rs2072907, p>0.05). When analyzing these SNPs in relation to phenotypes, two SNPs in the PNPLA3 gene showed association with insulin sensitivity (rs12483959: β = −0.053, p = 0.016, and rs2072907: β = −0.049, p = 0.024). No associations were seen for PNPLA2, PNPLA4, and PNPLA5.
Conclusions
Genetic variation in the adiponutrin gene family does not seem to contribute strongly to obesity in children and adolescents. PNPLA1 exhibited a modest effect on obesity and PNPLA3 on insulin sensitivity. These data, however, require confirmation in other cohorts and ethnic groups.
Introduction
A new family of genes with conserved patatin and lipase domains has recently been identified and given the name patatin-like phospholipase family [1]–[3]. The family consists of nine genes, and of these, five genes form a subgroup called the adiponutrin family [3]. This subfamily include patatin-like phospholipase 1 (PNPLA1), adipose triglyceride lipase (ATGL/PNPLA2), adiponutrin (ADPN/PNPLA3), gene sequence 2 (PNPLA4) and GS2-like (PNPLA5). It is believed that members of the adiponutrin family complement the hormone sensitive lipase (HSL) as responsible for adipocyte triacylglycerol lipase activity. Mice lacking HSL display a lean phenotype and accumulate diglycerides suggesting that HSL is the main enzyme for the second step of lipolysis and that other enzymes are responsible for the first step [4]–[6]. Several studies indicate that the protein encoded by PNPLA2 is one of the enzymes responsible for this first step in lipolysis [3], [7]. Less is known about the function of the other members but data indicates that they retain both lipolytic and lipogenic properties [1]–[3].
All members of the adiponutrin gene family are highly expressed in the adipose tissue. Expression increases during adipocyte differentiation and is regulated in by nutritional challenges [1]–[3]. For example, PNPLA3 is downregulated in the adipose tissue of insulin resistant subjects and upregulated in a glucose dependent fashion in response to insulin stimulation [8]. Two studies have demonstrated genetic association between PNPLA2 and PNPLA3 with type 2 diabetes and obesity, respectively [8]–[10]. Far less is known about the other three members of the family, PNPLA1, PNPLA4 and PNPLA5. The aim of this study was to investigate the genetic relevance of all five genes in the adiponutrin family in the pathogenesis of childhood obesity and insulin resistance.
Results
In total, 61 out of 85 selected SNPs were successfully genotyped using the Sequenom platform in a childhood and adolescent obesity case-control material (Table S1 and Figures S1, S2, S3, S4, S5). Clinical characteristics for this cohort have been presented previously and are summarized in Table 1 [11]. Gender distribution was similar between the obese and non-obese children. By definition, the obese group was younger than the normal weight controls (Table 1). The obese subjects all showed a significant degree of insulin resistance (HOMA-IR: 3.04 [2.11–4.49], n = 297).
Table 1. Clinical characteristics of the child obesity case-control study.
| Non-obese | Obese | p-value | |
| Gender (m/f) | 234/257 | 226/240 | 0.79 |
| Age (years) | 17 (16–18) | 13 (10–15) | <0.001 |
| Weight (kg) | 61 (55–69) | 91 (73–109) | <0.001 |
| Length (m) | 1.72 (1.66–1.79) | 1.61 (1.51–1.70) | <0.001 |
| BMI (kg/m2) | 20.7 (19.5–22.3) | 34.3 (30.9–38.3) | <0.001 |
| BMI-SDS | 0.36 (−0.16–1.03) | 5.98 (5.14–7.04)A | <0.001 |
p-values are calculated using Wilcoxon Rank Sum test or chi2 test for distributions.
Patients with data available were 463. BMI-SDS – Body Mass Index - Standard Deviation Score.
Logistic regression identified six variants in PNPLA1 that show association with obesity when adjusting for age and gender (rs9380559, rs12212459, rs1467912, rs4713951, rs10947600 and the coding rs12199580, Table 2 and Table S2). Three variants in PNPLA3 showed association with obesity (rs139051, rs12483959 and rs2072907, Table 2 and Table S2). This association was unaffected by adjustment for gender but attenuated when adjusting for age (data not shown). No variants in the PNPLA2, PNPLA4 and PNPLA5 were associated with obesity in this cohort (Table S2).
Table 2. Genetic variants in PNPLA1 and PNPLA3 showing significant association with obesity using logistic regression.
| Gene | SNP | N (case/control) | MAF (cases) | OR | 95% CI | P | P Adjusted |
| PNPLA1 | rs9380559 | 451/484 | 0.43 | 1.42 | (1.02–1.98) | 0.63 | 0.038 |
| rs12212459 | 440/464 | 0.41 | 0.70 | (0.50–0.99) | 0.94 | 0.043 | |
| rs1467912 | 455/482 | 0.37 | 0.71 | (0.51–1.00) | 0.61 | 0.049 | |
| rs4713951 | 451/479 | 0.46 | 0.71 | (0.51–0.98) | 0.67 | 0.037 | |
| rs10947600 | 456/482 | 0.41 | 0.72 | (0.52–0.99) | 0.87 | 0.042 | |
| rs12199580 | 451/485 | 0.41 | 0.70 | (0.51–0.96) | 0.64 | 0.028 | |
| PNPLA3 | rs139051 | 453/469 | 0.35 | 0.99 | (0.71–1.38) | 0.014 | 0.97 |
| rs12483959 | 450/484 | 0.16 | 0.79 | (0.52–1.20) | 0.023 | 0.27 | |
| rs2072907 | 455/477 | 0.17 | 0.82 | (0.55–1.24) | 0.041 | 0.35 |
p-values are calculated using Logistic regression including gender and age as covariates, additive model. The presented Odds ratios (OR) are adjusted for age and gender. SNP – Single nucleotide polymorphism, MAF – Minor Allele Frequency, OR – Odds ratio, 95% CI – 95% confidence interval.
The associated SNPs were further analyzed for association with phenotypes related to obesity in the group of obese children and adolescents (Table 3). Similar data for the control group was not available. PNPLA1 variants rs12212459 and rs1467912 showed association with BMI-standard deviation score (SDS) after adjusting for age and gender (Table 3). Adjusting for insulin resistance defined by HOMA-IR did affect this observation (β = 0.30, p = 0.025 and β = 0.40, p = 0.0029, respectively). PNPLA1 SNP rs10947600 was associated with both body weight (n = 330, GG: 104.3[85.1–124.8] kg, GA: 94.1[78.3–111.9] kg, AA: 94.4[79.3–109.0] kg, β = −3.38, p = 0.018) and glucose levels (n = 292, GG: 4.9[4.7–5.3] mmol/L, GA: 4.9[4.6–5.2] mmol/L, AA: 4.7[4.5–5.1] mmol/L, β = −0.0077, p = 0.032) and PNPLA1 SNP rs12199580 with glucose levels (n = 289, CC: 4.9[4.7–5.3] mmol/L, CA: 5.0[4.6–5.2] mmol/L, AA: 4.7[4.5–5.1] mmol/L, β = −0.0085, p = 0.016).
Table 3. Obesity-associated variants in PNPLA1 and PNPLA3 and the association with phenotypes using multiple regression analyses.
| SNP | BMI-SDS | Insulin sensitivity (Si*10−5/pM/min) | HOMA-IR | |
| rs9380559 | n | 323 | 271 | 224 |
| β | −0.058 | 0.0062 | −0.15 | |
| p | 0.60 | 0.73 | 0.47 | |
| AA | 6.07 (5.19–7.20) | 0.29 (0.18–0.46) | 3.40 (1.99–4.91) | |
| AG | 5.61 (4.97–5.68) | 0.33 (0.19–0.48) | 3.38 (2.46–4.52) | |
| GG | 6.03 (5.29–6.71) | 0.37 (0.25–0.49) | 3.22 (2.35–4.40) | |
| rs12212459 | n | 316 | 268 | 220 |
| β | 0.24 | 0.0098 | 0.012 | |
| p | 0.036 | 0.58 | 0.96 | |
| AA | 5.76 (4.86–6.67) | 0.32 (0.19–0.43) | 3.44 (2.48–4.61) | |
| AC | 5.76 (5.15–6.85) | 0.33 (0.19–0.49) | 3.38 (2.24–4.90) | |
| CC | 6.07 (5.30–7.56) | 0.33 (0.21–0.52) | 3.30 (1.80–4.48) | |
| rs1467912 | n | 329 | 276 | 229 |
| β | 0.26 | 0.0048 | −0.068 | |
| p | 0.022 | 0.80 | 0.76 | |
| CC | 5.82 (4.95–6.68) | 0.32 (0.19–0.45) | 3.36 (2.45–4.61) | |
| CT | 5.66 (5.08–6.69) | 0.34 (0.20–0.51) | 3.35 (2.10–4.74) | |
| TT | 6.22 (5.53–7.61) | 0.32 (0.21–0.46) | 3.43 (2.27–4.63) | |
| rs4713951 | n | 326 | 275 | 228 |
| β | 0.22 | −0.014 | −0.080 | |
| p | 0.052 | 0.45 | 0.72 | |
| CC | 5.66 (4.98–6.68) | 0.33 (0.20–0.47) | 3.30 (2.45–4.19) | |
| CT | 5.81 (5.02–6.90) | 0.31 (0.18–0.49) | 3.64 (2.34–4.83) | |
| TT | 6.11 (5.37–7.37) | 0.33 (0.22–0.42) | 3.19 (1.92–4.53) | |
| rs10947600 | n | 327 | 275 | 228 |
| β | 0.024 | 0.015 | −0.28 | |
| p | 0.83 | 0.41 | 0.20 | |
| GG | 5.89 (4.97–6.88) | 0.33 (0.18–0.48) | 3.56 (2.49–5.03) | |
| GA | 5.83 (5.12–6.93) | 0.33 (0.21–0.48) | 3.25 (2.31–4.55) | |
| AA | 5.83 (5.02–7.01) | 0.28 (0.19–0.45) | 3.24 (1.89–4.78) | |
| rs12199580 | n | 323 | 271 | 224 |
| β | 0.078 | 0.0067 | −0.38 | |
| p | 0.48 | 0.72 | 0.088 | |
| CC | 5.82 (4.92–6.68) | 0.34 (0.19–0.49) | 3.54 (2.46–5.21) | |
| CA | 5.87 (5.14–6.97) | 0.33 (0.21–0.47) | 3.33 (2.45–4.54) | |
| AA | 5.83 (5.14–7.05) | 0.28 (0.19–0.45) | 3.07 (1.83–4.61) | |
| rs139051 | n | 326 | 274 | 227 |
| β | −0.060 | −0.0223 | 0.14 | |
| p | 0.59 | 0.23 | 0.46 | |
| GG | 5.90 (4.98–7.15) | 0.33 (0.22–0.50) | 3.43 (2.37–4.58) | |
| GA | 5.75 (5.00–6.57) | 0.33 (0.18–0.47) | 3.35 (2.30–4.80) | |
| AA | 5.95 (5.14–6.89) | 0.30 (0.21–0.42) | 3.61 (2.34–4.75) | |
| rs12483959 | n | 324 | 274 | 228 |
| β | 0.029 | −0.053 | −0.30 | |
| p | 0.83 | 0.016 | 0.25 | |
| GG | 5.83 (5.00–7.09) | 0.33 (0.21–0.49) | 3.32 (2.36–4.63) | |
| GA | 5.81 (5.05–6.54) | 0.33 (0.16–0.42) | 3.56 (2.39–5.03) | |
| AA | 6.14 (5.28–7.32) | 0.34 (0.28–0.65) | 2.50 (2.14–4.00) | |
| rs2072907 | n | 327 | 275 | 229 |
| β | 0.034 | −0.049 | −0.21 | |
| p | 0.79 | 0.024 | 0.40 | |
| GG | 5.81 (4.99–7.04) | 0.33 (0.22–0.49) | 3.29 (2.35–4.63) | |
| GC | 5.88 (5.02–6.65) | 0.27 (0.16–0.42) | 3.56 (2.39–4.72) | |
| CC | 6.24 (5.47–7.16) | 0.33 (0.25–0.64) | 2.67 (2.28–4.48) |
p-values are calculated using multiple regression including gender and age as covariates. SNP – Single nucleotide polymorphism. n – number of observations, β– Regression coefficient, p - p-value for t-statistic. f – fasting samples, BMI-SDS – Body Mass Index - Standard Deviation Score, HOMA-IR – homeostasis model of assessment - Insulin Resistance.
The obesity associated PNPLA3 variants rs12483959 and rs2072907 showed association with insulin sensitivity (Table 3) and disposition index (rs12483959: n = 264, GG: 122[66–208], GA: 109[61–214], AA: 74[52–197], β = −0.14, p = 0.017 and rs2072907: n = 265, GG: 121[66–209], GC: 109[58–215], CC: 83[56–192], β = −0.12, p = 0.043). Adjusting for BMI-SDS did not affect the association with insulin sensitivity (β = −0.053, p = 0.015 and β = −0.049, p = 0.022, respectively) or disposition index (β = −0.15, p = 0.012 and β = −0.12, p = 0.031, respectively).
Discussion
The genetic analysis using TagSNPs in the five genes included in the adiponutrin gene family revealed that some variants within these genes exert a weak but significant effect on obesity in children and adolescents. In this study the association was limited to the two genes PNPLA1 and PNPLA3. Findings concerning PNPLA3 variants were attenuated when adjusting for age and gender but further analysis indicated that they might influence insulin sensitivity.
Childhood obesity is associated with increased risk of cardiovascular disease [12] and reduced life expectancy [13], [XPATH ERROR: unknown variable "rids-text".]. It is therefore of great importance to study this group in order to identify markers that could recognize individuals predisposed to obesity at an early stage. However, the polygenic nature of obesity makes the search for risk altering genes difficult. Recent studies have identified two strong obesity candidate genes, the fat mass and obesity associated (FTO) and melanocortin 4 receptor (MC4R) [15]–18. Genes involved in lipid metabolism such as lipases would be relevant to investigate in relation with obesity since it is a state of excessive storage of lipids. In the obese state, the adipose tissue is less efficient in buffering lipids resulting in increased levels in the circulation. These lipids will then be stored in other tissues thereby promoting development of insulin resistance and possibly type 2 diabetes [19]. Genetic studies of for example the important lipase hormone sensitive lipase (HSL) show significant associations with measures of obesity suggesting that genes coding for proteins with lipase activity are of importance [20]–[25]. The five adiponutrin gene family members encode proteins that are able to both catalyze the build-up and breakdown of fat thus identifying them as possible candidate genes [1]–[3]. Data presented here, for the most part, failed to clearly confirm this candidacy. We found borderline association with obesity for PNPLA1 and PNPLA3, but these data would not hold for multiple corrections. Given the hypothesis generating nature of the study it is important to underline that the results should be interpreted with caution and need confirmation elsewhere.
So far little is known concerning genetic variation in the adiponutrin gene family and its possible influence on metabolic disease. Only the PNPLA2 and PNPLA3 have been studied in this context before. For PNPLA2, common variants has been associated with free fatty acid levels, triglyceride levels and type 2 diabetes suggesting that the gene may play an important role for the risk factors associated with obesity rather than obesity per se [9]. Rare mutations in the PNPLA2 gene, resulting in a truncated protein with no capacity to bind to lipid droplets but with an intact patatin domain, has been identified in a subgroup of patients with neutral lipid storage disorder (NLSD) with mild myopathy [26]. NLSD is a disorder characterized by storage of triglyceride-containing cytoplasmic droplets in for example leukocytes, bone marrow, skin and muscle (OMIM #610717). In our study we did not find any association between PNPLA2 and obesity and therefore no further analysis was conducted. As stated in both previous studies regarding PNPLA2, no association was found with obesity and the NLSD patients carrying PNPLA2 mutations were not obese [9], [26].
Genetic variants in PNPLA3 have previously been associated with obesity [8]. In this study we confirm these data but also demonstrate an association with insulin sensitivity. The association with obesity disappears when adjusting for age while that with insulin sensitivity association remains. Data may suggest that variants in PNPLA3 rather affect insulin sensitivity. Although obese adolescents in general are insulin resistant, the degree of obesity is not a major determining factor [27] and together with age, cardiorespiratory fitness, and truncal fat, only 25% of individual variation can be explained [28]. Thus, it is likely that genetic vulnerability is of importance and it is possible that PNPLA3 variation may play a role It has been shown that both genetic variants and insulin resistance regulate adipose PNPLA3 gene expression [8], [29].
Genetic variants in the PNPLA1, PNPLA4 and PNPLA5 genes have not been studied before. We found an association between PNPLA1 and juvenile obesity but no associations were found for PNPLA4 or PNPLA5. These data need to be replicated due to the relatively small study material used in this study.
In conclusion, although members of the adiponutrin gene family are clear candidate genes for obesity we were unable to clearly confirm this candidacy for obesity in children and adolescents. We did find a modest effect of PNPLA1 on obesity and PNPLA3 on insulin sensitivity although these data need confirmatory studies. Furthermore, although PNPLA2, PNPLA4 and PNPLA5 did not show any significant association with obesity and insulin sensitivity, we cannot rule out a possible implication in the pathogenesis due to the low power of this study.
Materials and Methods
Study subjects
We studied 466 obese children and adolescents referred to the National Childhood Obesity Centre at Karolinska University Hospital and Karolinska Institute and 491 non-obese adolescents recruited from 17 upper secondary schools around Stockholm (Table 1) [11]. For the obese children we had available blood samples, growth charts, clinical journal notes, medical examination and laboratory reports as well as questionnaires completed by the parents of the children at enrolment. The lean adolescents were asked through the school nurse if they wanted to participate in the study. Blood was collected and every adolescent completed a questionnaire concerning ethnicity, health and the use of medical drugs. Subjects with overweight/obesity or chronic diseases were excluded from the control group.
Height (Ulmer Stadiometer, Ulm, Germany), and weight (Vetek TI-1200, Väddö, Sweden) were measured with subjects in light clothing and body mass index (BMI; kg/m2) calculated. Body weight and height was measured at the first visit to the nearest 0.1 kg and 1 cm, respectively. All subjects in the obese group were obese according to international age and sex adjusted standards [30]. Values of a BMI standard deviation score (BMI-SDS) was calculated from weight, height, age and gender based on a French material from 1982 [31]. All subjects gave their written informed consent and the Regional Committee of Ethics, Stockholm, approved the study. The study was conducted according to the principles of the Helsinki Declaration.
Laboratory analysis
Blood samples from the obese children for measurement of glucose, (glucose-6-phosphate dehydrogenase method, Kebo Lab, Stockholm, Sweden), insulin (Pharmacia Diagnostics AB, Uppsala, Sweden), HDL-cholesterol and triglycerides (Boehringer, Mannheim, Germany) were obtained after an over-night fast. Analyses were performed at a certified laboratory (Department of Clinical Chemistry, Karolinska University Hospital). The control subjects were not fasting when the blood samples were obtained. Therefore insulin and glucose were measured only in the obese cohort. Insulin resistance was estimated by homeostasis model of assessment (HOMA-IR) [32]. Insulin sensitivity index representing the effect of insulin to catalyze the clearance of glucose from plasma after an intravenous glucose load were calculated using the Bergman minimal model approach [11], [33]. Acute insulin response reflects the first phase of endogenous secretion in response to glucose infusion and was calculated as area under the curve during the first 10 minutes [11], [34]. Genomic DNA was prepared by standard methods. DNA was extracted from whole blood by using QiaGen MaxiPrep (QiaGen, Germany) at the DNA/RNA Genotyping Lab, SWEGENE Resource Center for Profiling Polygenic Disease, Lund University, Malmö University Hospital, Malmö, Sweden.
Genotyping
SNPs were selected by using data from the HapMap consortium for each of the sequences coding for the selected five genes including an extra 5000 bases upstream and downstream [35]. TagSNPs were then selected using Tagger in the Haploview program for all five genes [36]. Additional coding SNPs were selected from the National Center for Biotechnology Information (NCBI) SNP database (http://www.ncbi.nlm.nih.gov/SNP/). In total, 85 SNPs passed the assay design and were genotyped using the Sequenom platform (MALDI-TOF) at the DNA/RNA Genotyping Lab, SWEGENE Resource Center for Profiling Polygenic Disease, Lund University, Malmö University Hospital, Malmö, Sweden. 24 SNPs failed genotyping and Hardy Weinberg equilibrium. These SNPs were removed from further analysis leaving a total of 61 SNPs for analysis (Table S1 and Figures S1, S2, S3, S4, S5). A selection of SNPs were re-analyzed in a subset of 283 patients using the TaqMan allelic discrimination method on the ABI 7900HT according to manufacturers' recommendations (Applied Biosystems). Success rate was 98.6%.
Statistical analysis
Logistic regression with age and gender as covariates were used for estimating the genotype association. Linear multiple regressions were performed in order to test for SNP effects on obesity and insulin resistance (HOMA-IR) as quantitative traits. All traits were log transformed for normal distribution. These analyses were adjusted for age and gender. Also, the obesity analysis was adjusted for insulin resistance and vice versa insulin resistance analysis for obesity. All p-values are based on additive models for the genetic variants. Data are presented as median with interquartile range within brackets [25th–75th] or odds ratio (OR) with 95% confidence interval (CI). All statistical calculations were performed using PLINK (http://pngu.mgh.harvard.edu/~purcell/plink/index.shtml) [37]. Furthermore, the power to detect an additive OR of 1.2 in this material when the minor allele frequency (MAF) is 0.05 is 17% and 53% for a MAF of 0.5 when α is set at 0.05.
Supporting Information
Hardy Weinberg equilibrium (HWE) for genetic variants analyzed in the Adiponutrin gene family.
(0.12 MB DOC)
Variants in the five genes in the Adiponutrin gene family and the association with obesity using logistic regression analyses.
(0.12 MB DOC)
Graphical overview of the patatin-like phospholipase 1 (PNPLA1) gene and linkage disequilibrium obtained from HapMap (http://www.hapmap.org/). SNPs successfully genotyped by MALDI-TOF MS are marked with a black square.
(0.62 MB PNG)
Graphical overview of the patatin-like phospholipase 2 (PNPLA2) gene and linkage disequilibrium obtained from HapMap (http://www.hapmap.org/). SNPs successfully genotyped by MALDI-TOF MS are marked with a black square. One SNP, the rs1138693, is not included since it was not present in the HapMap database at the time of data extraction. It was included in the study because it is a coding SNP.
(0.01 MB PNG)
Graphical overview of the patatin-like phospholipase 3 (PNPLA3) gene and linkage disequilibrium obtained from HapMap (http://www.hapmap.org/). SNPs successfully genotyped by MALDI-TOF MS are marked with a black square.
(0.26 MB PNG)
Graphical overview of the patatin-like phospholipase 4 (PNPLA4) gene and linkage disequilibrium obtained from HapMap (http://www.hapmap.org/). SNPs successfully genotyped by MALDI-TOF MS are marked with a black square.
(0.06 MB PNG)
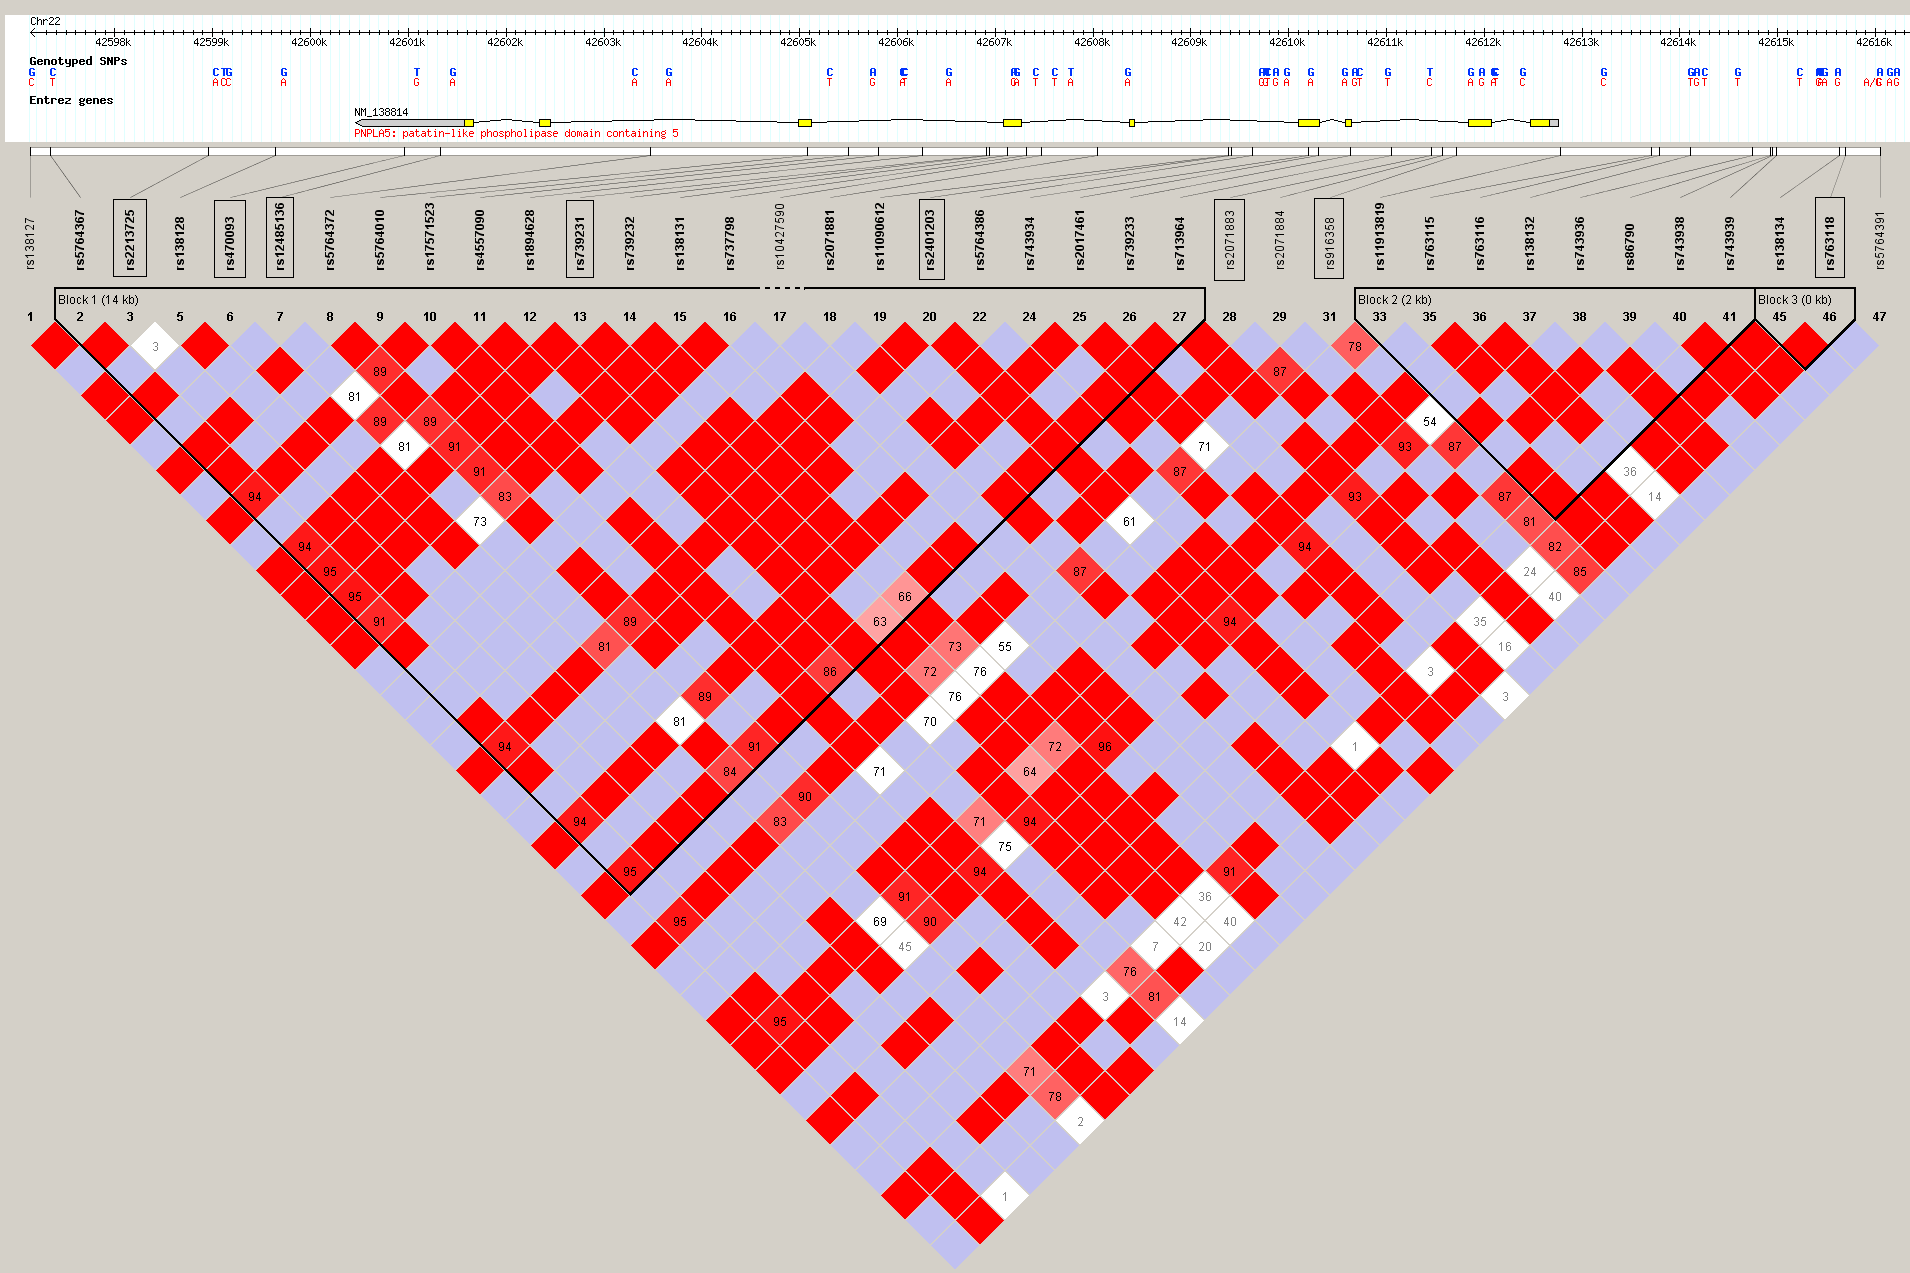
Graphical overview of the patatin-like phospholipase 5 (PNPLA5) gene and linkage disequilibrium obtained from HapMap (http://www.hapmap.org/). SNPs successfully genotyped by MALDI-TOF MS are marked with a black square.
(0.17 MB PNG)
Footnotes
Competing Interests: The authors have declared that no competing interests exist.
Funding: This study was supported by the Swedish Research Council (CM and MR), Region Skane, AFA, Stockholm County, Karolinska Institutet Foundations, Capio, and the following foundations: Bergvall, Crafoord, Freemasons in Stockholm Foundation for Children's Welfare, Novo Nordisk, Hierta, Pahlsson, Thuring, University Hospital MAS, and Zoegas. Diabetesforeningen and Knut & Alice Wallenbergs stiftelse. The funders had no role in study design, data collection and analysis, decision to publish, or preparation of the manuscript.
References
- 1.Jenkins CM, Mancuso DJ, Yan W, Sims HF, Gibson B, et al. Identification, cloning, expression, and purification of three novel human calcium-independent phospholipase A2 family members possessing triacylglycerol lipase and acylglycerol transacylase activities. J Biol Chem. 2004;279:48968–48975. doi: 10.1074/jbc.M407841200. [DOI] [PubMed] [Google Scholar]
- 2.Lake AC, Sun Y, Li JL, Kim JE, Johnson JW, et al. Expression, regulation, and triglyceride hydrolase activity of Adiponutrin family members. J Lipid Res. 2005;46:2477–2487. doi: 10.1194/jlr.M500290-JLR200. [DOI] [PubMed] [Google Scholar]
- 3.Wilson PA, Gardner SD, Lambie NM, Commans SA, Crowther DJ. Characterization of the human patatin-like phospholipase family. J Lipid Res. 2006;47:1940–1949. doi: 10.1194/jlr.M600185-JLR200. [DOI] [PubMed] [Google Scholar]
- 4.Osuga J, Ishibashi S, Oka T, Yagyu H, Tozawa R, et al. Targeted disruption of hormone-sensitive lipase results in male sterility and adipocyte hypertrophy, but not in obesity. Proc Natl Acad Sci U S A. 2000;97:787–792. doi: 10.1073/pnas.97.2.787. [DOI] [PMC free article] [PubMed] [Google Scholar]
- 5.Mulder H, Sorhede-Winzell M, Contreras JA, Fex M, Strom K, et al. Hormone-sensitive lipase null mice exhibit signs of impaired insulin sensitivity whereas insulin secretion is intact. J Biol Chem. 2003;278:36380–36388. doi: 10.1074/jbc.M213032200. [DOI] [PubMed] [Google Scholar]
- 6.Wang SP, Laurin N, Himms-Hagen J, Rudnicki MA, Levy E, et al. The adipose tissue phenotype of hormone-sensitive lipase deficiency in mice. Obes Res. 2001;9:119–128. doi: 10.1038/oby.2001.15. [DOI] [PubMed] [Google Scholar]
- 7.Wolf G. The mechanism and regulation of fat mobilization from adipose tissue: desnutrin, a newly discovered lipolytic enzyme. Nutr Rev. 2005;63:166–170. doi: 10.1111/j.1753-4887.2005.tb00134.x. [DOI] [PubMed] [Google Scholar]
- 8.Johansson LE, Hoffstedt J, Parikh H, Carlsson E, Wabitsch M, et al. Variation in the adiponutrin gene influences its expression and associates with obesity. Diabetes. 2006;55:826–833. doi: 10.2337/diabetes.55.03.06.db05-1075. [DOI] [PubMed] [Google Scholar]
- 9.Schoenborn V, Heid IM, Vollmert C, Lingenhel A, Adams TD, et al. The ATGL gene is associated with free fatty acids, triglycerides, and type 2 diabetes. Diabetes. 2006;55:1270–1275. doi: 10.2337/db05-1498. [DOI] [PubMed] [Google Scholar]
- 10.Johansson LE, Lindblad U, Larsson CA, Rastam L, Ridderstrale M. Polymorphisms in the adiponutrin gene are associated with increased insulin secretion and obesity. Eur J Endocrinol. 2008;159:577–583. doi: 10.1530/EJE-08-0426. [DOI] [PubMed] [Google Scholar]
- 11.Jacobsson JA, Danielsson P, Svensson V, Klovins J, Gyllensten U, et al. Major gender difference in association of FTO gene variant among severely obese children with obesity and obesity related phenotypes. Biochem Biophys Res Commun. 2008;368:476–482. doi: 10.1016/j.bbrc.2008.01.087. [DOI] [PubMed] [Google Scholar]
- 12.Baker JL, Olsen LW, Sorensen TI. Childhood body-mass index and the risk of coronary heart disease in adulthood. N Engl J Med. 2007;357:2329–2337. doi: 10.1056/NEJMoa072515. [DOI] [PMC free article] [PubMed] [Google Scholar]
- 13.Fontaine KR, Redden DT, Wang C, Westfall AO, Allison DB. Years of life lost due to obesity. JAMA. 2003;289:187–193. doi: 10.1001/jama.289.2.187. [DOI] [PubMed] [Google Scholar]
- 14.Mossberg HO. 40-year follow-up of overweight children. Lancet. 1989;2:491–493. doi: 10.1016/s0140-6736(89)92098-9. [DOI] [PubMed] [Google Scholar]
- 15.Loos RJ, Lindgren CM, Li S, Wheeler E, Zhao JH, et al. Common variants near MC4R are associated with fat mass, weight and risk of obesity. Nat Genet. 2008;40:768–775. doi: 10.1038/ng.140. [DOI] [PMC free article] [PubMed] [Google Scholar]
- 16.Chambers JC, Elliott P, Zabaneh D, Zhang W, Li Y, et al. Common genetic variation near MC4R is associated with waist circumference and insulin resistance. Nat Genet. 2008;40:716–718. doi: 10.1038/ng.156. [DOI] [PubMed] [Google Scholar]
- 17.Frayling TM, Timpson NJ, Weedon MN, Zeggini E, Freathy RM, et al. A common variant in the FTO gene is associated with body mass index and predisposes to childhood and adult obesity. Science. 2007;316:889–894. doi: 10.1126/science.1141634. [DOI] [PMC free article] [PubMed] [Google Scholar]
- 18.Dina C, Meyre D, Gallina S, Durand E, Korner A, et al. Variation in FTO contributes to childhood obesity and severe adult obesity. Nat Genet. 2007;39:724–726. doi: 10.1038/ng2048. [DOI] [PubMed] [Google Scholar]
- 19.Frayn KN. Adipose tissue as a buffer for daily lipid flux. Diabetologia. 2002;45:1201–1210. doi: 10.1007/s00125-002-0873-y. [DOI] [PubMed] [Google Scholar]
- 20.Klannemark M, Orho M, Langin D, Laurell H, Holm C, et al. The putative role of the hormone-sensitive lipase gene in the pathogenesis of Type II diabetes mellitus and abdominal obesity. Diabetologia. 1998;41:1516–1522. doi: 10.1007/s001250051099. [DOI] [PubMed] [Google Scholar]
- 21.Magre J, Laurell H, Fizames C, Antoine PJ, Dib C, et al. Human hormone-sensitive lipase: genetic mapping, identification of a new dinucleotide repeat, and association with obesity and NIDDM. Diabetes. 1998;47:284–286. doi: 10.2337/diab.47.2.284. [DOI] [PubMed] [Google Scholar]
- 22.Qi L, Shen H, Larson I, Barnard JR, Schaefer EJ, et al. Genetic variation at the hormone sensitive lipase: gender-specific association with plasma lipid and glucose concentrations. Clin Genet. 2004;65:93–100. doi: 10.1111/j.0009-9163.2004.00196.x. [DOI] [PubMed] [Google Scholar]
- 23.Lavebratt C, Ryden M, Schalling M, Sengul S, Ahlberg S, et al. The hormone-sensitive lipase i6 gene polymorphism and body fat accumulation. Eur J Clin Invest. 2002;32:938–942. doi: 10.1046/j.1365-2362.2002.01075.x. [DOI] [PubMed] [Google Scholar]
- 24.Hoffstedt J, Arner P, Schalling M, Pedersen NL, Sengul S, et al. A common hormone-sensitive lipase i6 gene polymorphism is associated with decreased human adipocyte lipolytic function. Diabetes. 2001;50:2410–2413. doi: 10.2337/diabetes.50.10.2410. [DOI] [PubMed] [Google Scholar]
- 25.Garenc C, Perusse L, Chagnon YC, Rankinen T, Gagnon J, et al. The hormone-sensitive lipase gene and body composition: the HERITAGE Family Study. Int J Obes Relat Metab Disord. 2002;26:220–227. doi: 10.1038/sj.ijo.0801872. [DOI] [PubMed] [Google Scholar]
- 26.Fischer J, Lefevre C, Morava E, Mussini JM, Laforet P, et al. The gene encoding adipose triglyceride lipase (PNPLA2) is mutated in neutral lipid storage disease with myopathy. Nat Genet. 2007;39:28–30. doi: 10.1038/ng1951. [DOI] [PubMed] [Google Scholar]
- 27.Rössner SM, Neovius M, Montgomery SM, Marcus C, Norgren S. Alternative Methods of Insulin Sensitivity Assessment in Obese Children and Adolescents Diabetes Care. 2008. 2008;31:802–804. doi: 10.2337/dc07-1655. [DOI] [PubMed] [Google Scholar]
- 28.Morinder G, Larsson UE, Norgren S, Marcus C. Insulin sensitivity, VO2max and body composition in severely obese Swedish children and adolescents. Acta Paediatr. 2009;98:132–138. doi: 10.1111/j.1651-2227.2008.01030.x. [DOI] [PubMed] [Google Scholar]
- 29.Baulande S, Lasnier F, Lucas M, Pairault J. Adiponutrin, a transmembrane protein corresponding to a novel dietary- and obesity-linked mRNA specifically expressed in the adipose lineage. J Biol Chem. 2001;276:33336–33344. doi: 10.1074/jbc.M105193200. [DOI] [PubMed] [Google Scholar]
- 30.Cole TJ, Bellizzi MC, Flegal KM, Dietz WH. Establishing a standard definition for child overweight and obesity worldwide: international survey. BMJ. 2000;320:1240–1243. doi: 10.1136/bmj.320.7244.1240. [DOI] [PMC free article] [PubMed] [Google Scholar]
- 31.Rolland-Cachera MF, Sempe M, Guilloud-Bataille M, Patois E, Pequignot-Guggenbuhl F, et al. Adiposity indices in children. Am J Clin Nutr. 1982;36:178–184. doi: 10.1093/ajcn/36.1.178. [DOI] [PubMed] [Google Scholar]
- 32.Matthews DR, Hosker JP, Rudenski AS, Naylor BA, Treacher DF, et al. Homeostasis model assessment: insulin resistance and beta-cell function from fasting plasma glucose and insulin concentrations in man. Diabetologia. 1985;28:412–419. doi: 10.1007/BF00280883. [DOI] [PubMed] [Google Scholar]
- 33.Bergman RN. Minimal model: perspective from 2005. Horm Res. 2005;64(Suppl 3):8–15. doi: 10.1159/000089312. [DOI] [PubMed] [Google Scholar]
- 34.Bergman RN. Lilly lecture 1989. Toward physiological understanding of glucose tolerance. Minimal-model approach. Diabetes. 1989;38:1512–1527. doi: 10.2337/diab.38.12.1512. [DOI] [PubMed] [Google Scholar]
- 35.The International HapMap Project. Nature. 2003;426:789–796. doi: 10.1038/nature02168. [DOI] [PubMed] [Google Scholar]
- 36.Barrett JC, Fry B, Maller J, Daly MJ. Haploview: analysis and visualization of LD and haplotype maps. Bioinformatics. 2005;21:263–265. doi: 10.1093/bioinformatics/bth457. [DOI] [PubMed] [Google Scholar]
- 37.Purcell S, Neale B, Todd-Brown K, Thomas L, Ferreira MA, et al. PLINK: a tool set for whole-genome association and population-based linkage analyses. Am J Hum Genet. 2007;81:559–575. doi: 10.1086/519795. [DOI] [PMC free article] [PubMed] [Google Scholar]
Associated Data
This section collects any data citations, data availability statements, or supplementary materials included in this article.
Supplementary Materials
Hardy Weinberg equilibrium (HWE) for genetic variants analyzed in the Adiponutrin gene family.
(0.12 MB DOC)
Variants in the five genes in the Adiponutrin gene family and the association with obesity using logistic regression analyses.
(0.12 MB DOC)
Graphical overview of the patatin-like phospholipase 1 (PNPLA1) gene and linkage disequilibrium obtained from HapMap (http://www.hapmap.org/). SNPs successfully genotyped by MALDI-TOF MS are marked with a black square.
(0.62 MB PNG)
Graphical overview of the patatin-like phospholipase 2 (PNPLA2) gene and linkage disequilibrium obtained from HapMap (http://www.hapmap.org/). SNPs successfully genotyped by MALDI-TOF MS are marked with a black square. One SNP, the rs1138693, is not included since it was not present in the HapMap database at the time of data extraction. It was included in the study because it is a coding SNP.
(0.01 MB PNG)
Graphical overview of the patatin-like phospholipase 3 (PNPLA3) gene and linkage disequilibrium obtained from HapMap (http://www.hapmap.org/). SNPs successfully genotyped by MALDI-TOF MS are marked with a black square.
(0.26 MB PNG)
Graphical overview of the patatin-like phospholipase 4 (PNPLA4) gene and linkage disequilibrium obtained from HapMap (http://www.hapmap.org/). SNPs successfully genotyped by MALDI-TOF MS are marked with a black square.
(0.06 MB PNG)
Graphical overview of the patatin-like phospholipase 5 (PNPLA5) gene and linkage disequilibrium obtained from HapMap (http://www.hapmap.org/). SNPs successfully genotyped by MALDI-TOF MS are marked with a black square.
(0.17 MB PNG)