

Abstract
A highly sensitive and selective method using liquid chromatography coupled with tandem mass spectrometry (LC/MS/MS) was developed and validated for the measurement of three antiretroviral agents, efavirenz, lopinavir and ritonavir, in human hair. Hair samples from adherent HIV-infected patients on antiretroviral therapies were cut into about 1 mm length segments and drugs were extracted by first shaking the samples with methanol in a 37°C water bath overnight (>14 h), followed by methyl tert-butyl ether/ethyl acetate (1:1) extraction under weak alkaline conditions. The extracted lopinavir and ritonavir were separated by reversed-phase chromatography and detected by tandem mass spectrometry in electrospray positive ionization mode with multiple reaction monitoring (MRM), while efavirenz was monitored in negative ionization MRM mode. This method was validated from 0.01 to 4.0 ng/mg hair for ritonavir and 0.05–20 ng/mg hair for lopinavir and efavirenz by using 2 mg of a human hair sample. The interday and intraday assay precision (coefficients of variation, CV) for spiked quality control (QC) samples at low, medium and high concentrations were within 15% and accuracy ranged from 89% to 110%. Assay reproducibility was also demonstrated by analysis of incurred hair QC samples (CV <14%). No significant matrix ionization suppression was observed. This developed method allowed for the monitoring of these target medications in the hair samples of HIV-infected women on antiretroviral therapy in an observational study using small amounts of hair.
The measurement of antiretroviral drug exposure is important for monitoring the response to HIV therapy, especially since adherence measures only partially predict treatment outcomes.1,2 Adherence measures are imperfect surrogates of exposure since drug levels are influenced not only by medication compliance, but by inter-individual variability in drug bioavailability and metabolism.1,2 Suboptimal antiretroviral (ARV) drug levels may contribute to virologic failure and/or development of resistance, while super-therapeutic ARV exposure may contribute to adverse events in HIV-infected patients on therapy.3–5 Therapeutic drug monitoring (TDM) using ARV plasma drug concentrations has been advocated for optimizing responses to highly active antiretroviral therapies (HAART).1,2
The high intra-individual variability in ARV drug concentrations may limit the utility of single plasma levels for TDM.6,7 Plasma drug concentrations usually reflect only a short-term (hours to days) assessment of exposure to a medication within an individual so a single level for TDM may provide only a ‘snap shot’ observation of drug exposure.8 Monitoring of drug exposure over a longer time period (weeks to months) may be more predictive of treatment outcomes, including efficacy and toxicities, on HIV therapy. Hair specimens are easy to collect and store without biohazardous precautions and could trace the history and extent of drug exposure for a period of weeks to months.8–10 The drug in hair comes from blood as well as sweat and sebum. There are several factors, such as the drug’s physicochemical properties, serum drug levels, hair color, hair growth rate and hair cosmetic procedures, that may influence the levels of drug in hair.9–11
Although analyses of drugs in hair have mainly been used in the forensic field, hair has recently been examined as an alternative specimen for TDM.9–11 Another group reported that levels of an HIV protease inhibitor (indinavir) in hair was associated with virological outcomes in patients receiving HAART.12–14 However, the high-performance liquid chromatography (HPLC) method of hair drug level testing in these reports required collection of large quantities of hair that may not be perceived as acceptable in the clinical setting. To further investigate whether hair levels of ARVs can be used for TDM in HIV-positive patients on therapy, we report here the development of a highly sensitive liquid chromatography/tandem mass spectrometry (LC/MS/MS) method for the analysis of one non-nucleoside reverse transcriptase inhibitor (NNRTI) – efavirenz– and two protease inhibitors (PIs) – lopinavir and ritonavir – in human hair using very small amounts of hair (~10–30 strands).
EXPERIMENTAL
Materials
Efavirenz, lopinavir and ritonavir reference compounds, and internal standards (IS), ritonavir-d6 and celecoxib, were obtained from Toronto Research Chemicals (Toronto, Canada). Proteinase K was purchased from Sigma™. Acetonitrile, methanol and other solvents or reagents were HPLC grade or analytical grade. Human hair samples were obtained from patients on lopinavir/ritonavir or efavirenz–based HAART in the Women’s Interagency HIV Study (WIHS). Blank human hair samples were obtained from healthy volunteers to serve as negative controls.
Standard solutions
The drug and IS stock solutions were prepared at 1 mg/mL in 100% methanol (for lopinavir, ritonavir, and ritonavir-d6) or 50% methanol (for efavirenz and celecoxib) and stored at −70°C. The drug stock solutions were stable for at least 4 months. The high working solutions containing 4 μg/mL of efavirenz and lopinavir and 0.8 μg/mL of ritonavir were prepared by combining each drug stock solution and diluted with 50% methanol. The low working solutions containing 0.1 μg/mL of efavirenz and lopinavir and 0.02 μg/mL of ritonavir were diluted from the high working solutions described above with 50% methanol. The working solutions were stored at 4°C. The drug stock and high working solutions were compared with another set of independent solutions by HPLC or LC/MS/MS. The IS working solution containing 0.1 μg/mL of ritonavir-d6 and 1 μg/mL of celecoxib was diluted from the IS stock solutions with 50% methanol and stored at 4°C.
Drug extraction conditions test for hair samples
Various conditions for hair pulverization and drug extraction were tested to optimize reproducibility and accuracy of the method, and those conditions are described below. We first tested a variety of conditions for hair chopping to maximize the efficiency of extraction. Human hair samples from maximally adherent and virologically suppressed patients on lopinavir/ritonavir or efavirenz-based ARV regimens were divided. One portion was pulverized to a fine powder by Frozen Mill™ (6750 model, SPEX CertiPrep, Inc., NJ, USA) grinding; the other portion was cut into 1 mm long segments by hand with scissors. About 2 mg of hair powder or cut (1 mm) hair samples were placed into test tubes. Two different methods of drug extraction were then tested on these divided samples. Under the first condition of organic solvent extraction, 1 mL of methanol was added to each tube; under the second condition of enzymatic digestion, 0.3 mL of 0.2 M sodium phosphate buffer (pH 7.4) with 0.2 mL of proteinase K (75 U/mL in water) was added to each tube. The samples were then incubated at 37°C overnight (~14 h) by shaking in a water bath. Samples in the methanol extraction tubes were evaporated by nitrogen (N2) gas at room temperature, after which 1 mL of 50 mM ammonium acetate (pH 8.5) and 20 μL of IS solution (10 μg/mL of ritonavir-d6 for lopinavir/ritonavir and 5 μg/mL of celecoxib for efavirenz) were added. The samples in the proteinase digestion tubes were mixed with 0.5 mL of 50 mM ammonium acetate (pH 8.5) and 20 μL of IS solution. To all of these samples, 3 mL of methyl tert-butyl ether (MTBE)/ethyl acetate (EA) (1:1) was then added and the tubes were vortexed three times for 1 min each, followed by centrifugation at 3000 rpm for 10 min. The tubes were then frozen in a methanol/dry ice bath and the organic solvent was poured into another test tube. The organic solvent was then evaporated by N2 gas. The evaporated samples were reconstituted with 0.2 mL of 50% methanol and 10 μL was injected into the LC/MS/MS systems for drug analysis.
Liquid chromatography/tandem mass spectrometry
The LC/MS/MS system in the laboratory consists of Shimadzu LC-10 ADvp pumps, a Waters Intelligent Sample Processor 717 Plus autosampler, and either an Applied Biosystems/Sciex API-4000 or Micromass Quattro Ultima triple quadruple tandem mass spectrometer. The mass spectrometer was set to electrospray ionization in positive ion mode for lopinavir/ritonavir and negative ionization mode for efavirenz. Compared with the Micromass Ultima, the API-4000 has shown a better sensitivity for these drugs. The main working parameters for the API-4000 are shown in Table 1. For the lopinavir/ritonavir assay, the multiple reaction monitoring (MRM) mode was set at m/z 721.3>140.1 for ritonavir, m/z 629.3>447.1 for lopinavir and m/z 727.2>302.2 for ritonavir-d6 (IS). The column was a BDS-C18 (100 × 4.6 mm) from Hypersil-Keystone™, with the mobile phase composed of acetontrile/water/acetic acid (55:45:0.15) (v/v/v) with 4 mM ammonium acetate. The flow rate was set at 0.8 mL/min. The run time for lopinavir and ritonavir was 5.0 min.
Table 1.
Main mass spectrometry parameters for assaying ritonavir, lopinavir and efavirenz
| Parameter | Ritonavir | Lopinavir | Ritonavir-d6 (IS)* | Efavirenz | Celecoxib (IS)** |
|---|---|---|---|---|---|
| Declustering potential (DP), V | 26 | 76 | 60 | −75 | −125 |
| Entrance potential (EP), V | 10 | 10 | 10 | −10 | −10 |
| Collision energy (CE), eV | 91 | 25 | 40 | −52 | −52 |
| Collision cell exit potential (CXP), V | 8 | 15 | 15 | −5 | −5 |
| CAD gas, psi | 7 | 7 | 7 | 6 | 6 |
| Curtain gas, psi | 10 | 10 | 10 | 14 | 14 |
| GS1, psi | 50 | 50 | 50 | 30 | 30 |
| GS2, psi | 50 | 50 | 50 | 30 | 30 |
| Ion spray voltage, V | 5500 | 5500 | 5500 | −4500 | −4500 |
| Probe temperature, °C | 600 | 600 | 600 | 400 | 400 |
| Q1>Q3, m/z | 721.3>140.1 | 629.3>447.1 | 727.2>302.2 | 314.2>69.0 | 379.9>68.9 |
| Dwell, ms | 150 | 150 | 150 | 200 | 200 |
Ritonavir-d6 was used as IS for ritoanavir and lopinavir.
Celecoxib was used as IS for efavirenz.
For the efavirenz assay, the MRM mode was set at m/z 314.2>69.0 for efavirenz and m/z 379.9>68.9 for celecoxib (IS). The column was a BDS-C18 (50 × 4.6 mm) from Hypersil-Keystone™, with the mobile phase composed of acetontrile/water (65:35) (v/v). The flow rate was set at 0.8 mL/min. The run time for efavirenz was 2.5 min. Data processing was performed using Analyst 1.41 software. The calibration curves were obtained with linear regression of analyte/IS peak area ratio versus 1/X weighted drug concentration.
Method validation
Standard curve and quality control (QC) samples
The calibration curves were prepared as follows: 2 mg of blank human cut hair samples (about 1 mm length segments) were placed into different borosilicate glass tubes (16 × 125 mm), and 1 mL of methanol and standard drugs were added. The final standard drug concentrations were 0.05, 0.1, 0.2, 0.5, 1.0, 2.0 4.0, 10 and 20 ng/mg hair for lopinavir and efavirenz and 0, 0.01, 0.02, 0.04, 0.1, 0.2, 0.4, 0.8, 2.0 and 4.0 ng/mg hair for ritonavir. To each test tube, 20 μL of IS working solution containing 0.1 μg/mL of ritonavir-d6 and 1 μg/mL of celecoxib was added and the sample was vortexed for 1 min. Samples were incubated at 37°C with shaking in a water bath overnight (>14 h), then evaporated by N2 gas. Then 1 mL of 50 mM ammonium acetate (pH 8.5) was added, the tubes were vortexed for 1 min, and 3 mL of MTBE/EA (1:1) was then added. The tubes were vortexed three times for 1 min each followed by centrifugation at 3000 rpm for 10 min. The aqueous layer was frozen in a methanol/dry-ice bath and the organic layer was poured into another tube and the sample evaporated by N2 gas. The residues were reconstituted with 0.2 mL of 50% acetonitrile, and 10 μL was injected into the LC/MS/MS system for analysis.
The spiked hair QC samples were prepared using blank cut hair samples (2 mg) spiked with drugs at low (3 × lower limit of quantitation (LLOQ)), medium (middle of the standard curve range) and high (70% of highest standard curve point) concentrations, and then processed in the same way as the standard curve samples. The authentic hair QC samples were prepared as follows: Two pooled human hair samples were obtained from two HIV-positive patients on antiretroviral therapy (one was on lopinavir/ritonavir based HAART, the other was on efavirenz–based HAART). Each pooled hair sample was cut into 1 mm length segments and placed into separate brown glass bottles. Each bottle was then shaken to mix the sample well. These cut hair samples served as authentic QC samples and were stored at room temperature. During the validation procedures, about 2 mg of the authentic QC samples were aliquoted into pre-weighed test tubes and the tubes were re-weighed to obtain exact hair weights. Subsequently, 1 mL of methanol and 20 μL of IS working solution were added to these incurred hair QC samples and they were subjected to the same extraction procedures as for the standard curve and spiked QC samples described above.
Accuracies were calculated as the measured value divided by the spiked (nominal) value for drug concentration. Precision was expressed as the percentage coefficient of variation (CV%) of individual measured values. Accuracy and precision evaluations were performed for within (intra) day and between (inter) day determinations.
Specificity
Blank human hair samples from six different healthy volunteers were cut into 1 mm length segments, extracted with methanol and MTBE/EA as described above, and analyzed in tandem with the LLOQ samples. A significant endogenous interfering peak was defined as a noise peak at the same retention time as the analyte with a peak area greater than 1/5 of the peak area of the LLOQ.
Matrix effect and recovery
The matrix ionization suppression or enhancement was evaluated by measuring the matrix factor (MF) and IS-normalized MF as recommended by a recent FDA/AAPS white paper.15 The MF is defined as the peak response in the presence of matrix ions versus the peak response in the absence of matrix ions. The biological matrix samples were prepared by spiking drug to the medium QC concentration of a post-extracted blank hair sample. The control samples were the same concentration of drug in pure solution (50% CH3CN). The IS-normalized MF was the analyte/IS peak area ratio in the presence of matrix ions versus the analyte/IS peak area ratio in the absence of matrix ions.
The recovery of spiked hair samples was performed by comparing the concentration of drug in spiked hair samples which underwent the extraction procedure compared to drug concentrations in unextracted samples. The spiked hair samples were prepared as follows: 2 mg of blank cut hair samples were placed into different test tubes, 50 μL of 50% methanol was added, and the sample was then spiked with drugs at low, medium and high QC concentrations. The tubes were kept at 4°C for 35 h and then dried by N2 gas. The dried hair samples were then extracted with methanol (1 mL) at 37°C overnight, followed by MTBE/EA extraction as described above. The residues were reconstituted with 180 μL of 50% acetonitrile and 20 μL of IS working solution. The unextracted samples were prepared as follows: 2 mg of blank cut hair samples were extracted in the same way as above. The residues were then reconstituted with IS and drugs at low, medium and high concentrations. The final volumes of extracted and unextracted samples were the same (200 μL). The samples at each concentration were generated in duplicate. Recovery was calculated by dividing the mean drug/IS peak area ratio of the extracted samples with the mean drug/IS peak area ratio of the unextracted samples.
To evaluate the extraction efficiency of this method for incurred hair samples, the authentic hair residues, after undergoing the extraction process under the current conditions (methanol and MTBE/EA), were re-extracted with either 1 mL of 100% methanol, 50% methanol, or 50% methanol containing 1% TFA at 37°C in a water bath for 20 h. Each sample then underwent MTBE/EA extraction as above. The drug concentrations in the first extract and the second extract were measured by LC/MS/MS and compared.
Clinical hair sample analysis
Human hair samples from WIHS patients were collected from the occipital portion of the scalp (as close to the scalp as possible) and stored in tin foil at room temperature. The proximal section of the hair sample (about 1 cm) was cut into 1 mm length segments with scissors and placed in a pre-weighed glass test tube. The tube was then re-weighed to obtain the exact weight of the cut hair sample (~2 mg for each sample). The cut hair samples were added with 1 mL of methanol and IS, and then processed in the same way as the calibration curve samples and QC samples described above.
RESULTS
Hair extraction test and method development
In pilot studies for the development of these methods, human hair samples were ground to powder with the Frozen Mill after liquid nitrogen freezing, followed by extraction with an organic solvent.12,13 We found that the Frozen Mill method is more suited to larger amounts of hair (>20 mg), since a portion of the hair powder is unavoidably wasted by stacking on the grinding tube. In order the enhance the clinical acceptability of this method of determining anti-retroviral exposure, hair samples were collected from HIV-infected patients in very small amounts, on the order of 10–50 strands. For effective grinding in the Frozen Mill, therefore, blank hair was required to add to the bulk of the clinical hair sample. Another limitation to this method was that Frozen Mill grinding of hair samples is time-consuming given that the hair samples must be frozen with liquid nitrogen prior to grinding. Given these shortcomings of the grinding method, we considered alternative methods for crushing the hair to increase the surface area for extraction.
We compared the extraction efficiency of incurred hair powder samples with methanol extraction of cut hair samples (1 mm length segments) using either the methanol extraction or the enzyme digestion method for all three drugs. As Fig. 1 shows, methanol extraction shows a higher extraction ratio than the proteinase digestion method for cut hair. However, there was no significant difference between the hair powder or cut hair in terms of the efficiency of methanol extraction, which indicated that hair cut into 1 mm segments by scissors could be extracted with methanol as efficiently as the powdered hair. The extraction ratios for the method using methanol as an organic solvent were significantly higher than the ratios using enzymatic digestion for all three drugs (p <0.01 by t-test).
Figure 1.

Comparison of the extraction methods for assaying lopinavir/ritonavir and efavirenz in samples incurred from human hair. The methanol and enzyme digestion were carried out at 37°C with shaking in a water bath for 14 h. Data are represented by mean ± standard deviation (SD) (n = 4). *p <0.01, compared with cut hair/MeOH by t-test.
The methanol extraction conditions for cut hair were further optimized at 37°C by testing incubation of incurred hair samples for different periods of time. As shown in Fig. 2, all three drugs could be maximally extracted from 1 mm segments of cut hair by 14 h of incubation. Further incubation time (e.g. up to 24 h) did not significantly increase the extraction ratios, indicating that a longer duration of incubation was not necessary for maximum extraction efficiency. Therefore, the hair extraction conditions were chosen as methanol extraction of cut hair at 37°C by shaking in a water bath overnight (>14 h). All three drugs in methanol solution were stable at 37°C overnight.
Figure 2.
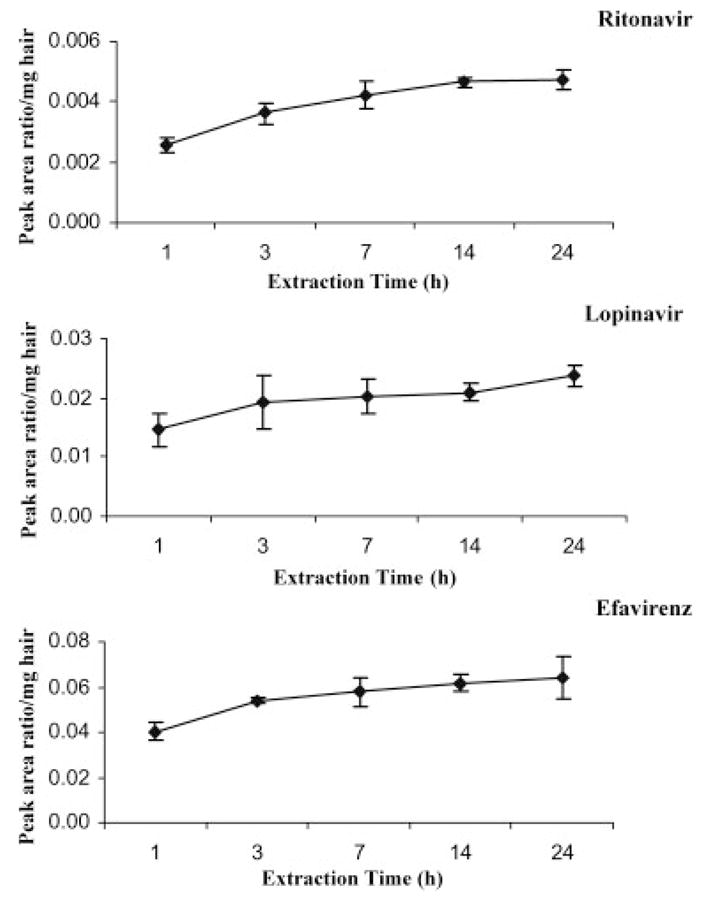
Time course for extraction of ritonavir, lopinavir and efavirenz from samples incurred from cut hair (1 mm length segments) in methanol at 37°C with shaking in a water bath. After the methanol extraction, the samples were then subjected to MTBE/EA (1:1) extraction and analyzed by LC/MS/MS. Each point represents mean ± SD (n = 4).
Figures 3 and 4 show the LC/MS/MS chromatograms for assaying lopinavir/ritonavir and efavirenz in human hair samples. Using 2 mg of cut hair, lopinavir, ritonavir and efavirenz were selectively and sensitively detected. The ritonavir level in hair was about 5 times lower than the lopinavir level in hair, which correlates with their relative dosing amounts in the lopinavir/ritonavir combination tablet and relative plasma drug concentrations in other studies.16 Efavirenz was found to show much higher sensitivity in negative ionization mode, while lopinavir and ritonavir were found to have a higher sensitivity in positive ionization mode. To achieve the highest sensitivity for each drug, efavirenz and lopinavir/ritonavir were analyzed in different chromatographic runs with the same sample preparation.
Figure 3.

LC/MS/MS chromatograms for measuring ritonavir and lopinavir in positive ionization MRM mode: (A) blank hair; (B) blank hair spiked with ritonavir/lopinavir at low QC concentration (lopinavir, 0.15 ng/mg, ritonavir, 0.03 ng/mg); and (C) authentic hair sample from a patient on HAART (lopinavir, 3.0 ng/mg, ritonavir, 0.70 ng/mg). The detailed LC/MS/MS conditions are described in the text.
Figure 4.

LC/MS/MS chromatograms for measuring efavirenz in negative ionization MRM mode: (A) blank hair; (B) blank hair spiked with efavirenz at low QC concentration (efavirenz, 0.15 ng/mg); and (C) authentic hair sample from a patient on HAART (efavirenz, 5.3 ng/mg). The detailed LC/MS/MS conditions are described in the text.
Method validation
Good linearities of spiked drug concentrations from 0.01 to 4.0 ng/mg hair for ritonavir and 0.05 to 20 ng/mg hair for lopinavir and efavirenz versus the drug IS peak area ratios were obtained. The regression coefficients (r) were greater than 0.99. Using 2.0 mg of human cut hair, the LLOQ was 0.01 ng/mg hair for ritonavir (with a signal-to-noise (S/N) ratio >5), and 0.05 ng/mg hair for both lopinavir and efavirenz (both S/N ratios >10). The LLOQ accuracies for all three drugs were within 80–120% with CV <20%. No significant interference peaks were observed for these drugs in blank human hair samples from six healthy volunteers, which indicates that this method is highly specific.
The intraday and interday accuracy and precision for the spiked QC samples are summarized in Table 2. The accuracies of low, medium and high concentrations for the three drugs were 89–110% with CVs within 15%. Since the spiked hair QC samples may not completely mimic the incurred hair samples, pooled hair samples from patients receiving antiretroviral therapy were cut into 1 mm length segments and mixed well to test the assay reproducibility for authentic hair samples. These incurred hair samples were then aliquotted and analyzed on different days. As shown in Table 2, the intraday and interday CVs for analyzing efavirenz, lopinavir and ritonavir in authentic hair QC samples were less than 14%. These results indicate that this method has a good reproducibility in measuring antiretroviral concentrations in authentic human hair samples.
Table 2.
Accuracy and precision for analysis of spiked QC samples and authentic hair QC samples
| Sample type |
Spiked QC |
Authentic hair QC samples* |
|||||||||
|---|---|---|---|---|---|---|---|---|---|---|---|
| Intraday |
Interday |
Intraday |
Interday |
||||||||
| Drug | Concentration/Patient ID | L | M | H | L | M | H | A | B | A | B |
| Efavirenz | Spiked Conc. (ng/mg hair) | 0.150 | 1.00 | 14.0 | 0.150 | 1.00 | 14.0 | ||||
| Measured Conc. (ng/mg hair) | 0.149 | 1.05 | 12.4 | 0.164 | 1.05 | 13.9 | 11 | 9.8 | |||
| Accuracy (%) | 99.1 | 105 | 88.6 | 110 | 105 | 99.4 | |||||
| CV (%) | 5.4 | 8.1 | 9.6 | 12 | 6.5 | 11 | 4.3 | 7.7 | |||
| n | 6 | 6 | 6 | 12 | 12 | 12 | 5 | 16 | |||
|
| |||||||||||
| Lopinavir | Spiked Conc. (ng/mg hair) | 0.150 | 1.00 | 14.0 | 0.150 | 1.00 | 14.0 | ||||
| Measured Conc. (ng/mg hair) | 0.149 | 1.00 | 13.7 | 0.165 | 1.09 | 13.5 | 3.1 | 3.0 | |||
| Accuracy (%) | 99.1 | 99.8 | 97.9 | 110 | 109 | 96.3 | |||||
| CV (%) | 4.3 | 2.8 | 5.5 | 15 | 11 | 9.2 | 13 | 9.8 | |||
| n | 6 | 6 | 6 | 12 | 12 | 12 | 6 | 16 | |||
|
| |||||||||||
| Ritonavir | Spiked Conc. (ng/mg hair) | 0.0300 | 0.200 | 2.80 | 0.0300 | 0.200 | 2.80 | ||||
| Measured Conc. (ng/mg hair) | 0.0294 | 0.188 | 2.72 | 0.0312 | 0.196 | 2.79 | 0.62 | 0.66 | |||
| Accuracy (%) | 98.0 | 93.8 | 97.0 | 104 | 97.8 | 99.6 | |||||
| CV (%) | 6.1 | 3.1 | 3.6 | 12 | 5.8 | 4.3 | 9.2 | 8.9 | |||
| n | 6 | 6 | 6 | 12 | 12 | 12 | 6 | 16 | |||
Authentic hair QC samples were prepared from pooled human hair samples from patients receiving antiretroviral therapy.
The mean recoveries of the spiked hair samples at low, medium and high concentrations were 91% for efavirenz (low, 84%, medium, 94%, high, 95%), 89% for lopinavir (low, 79%, medium, 95%, high, 94%), and 92% for ritonavir (low, 87%, medium, 97%, high, 92%), respectively. However, it should be noted that the drug recovery from the spiked hair samples may not completely represent the recovery from incurred hair samples because spiking blank hair with drugs cannot completely mimic the process of drug incorporation into hair from the systemic circulation. Since the true value of drug concentrations in actual patient hair samples is unknown, it is very difficult to determine the exact extraction recovery of authentic hair samples. To evaluate the extraction efficiency of this method for the incurred hair samples, we tested how much drug still remained in the hair residues after being extracted under current conditions. About 5% of efavirenz, 28% of lopinavir and 34% of ritonavir were detected in the 2nd extract, by which we estimate that the extraction yields of efavirenz, lopinavir and ritonavir from the authentic hair samples are 95%, 72% and 66%, respectively.
The matrix ionization suppression or enhancement of these drug levels was assessed by measuring the MF. The mean absolute MFs at the medium concentration from six lots of hair samples were 0.97, 1.0 and 0.97 for efavirenz, lopinavir and ritonavir, respectively (Table 3). The CVs of absolute MF and IS-normalized MF from six lots of hair samples were <10%. These results indicate that the assay has no significant matrix ionization suppression or enhancement.
Table 3.
Matrix factors for analyzing lopinavir, ritonavir and efavirenz in human hair
| Matrix factor |
IS normalized matrix factor |
|||||
|---|---|---|---|---|---|---|
| Hair matrix | Lopinavir | Ritonavir | Efavirenz | Lopinavir | Ritonavir | Efavirenz |
| Lot A | 0.91 | 0.82 | 0.97 | 0.99 | 0.97 | 0.95 |
| Lot B | 1.02 | 0.96 | 0.91 | 0.99 | 0.95 | 0.94 |
| Lot C | 1.05 | 1.05 | 1.00 | 0.99 | 0.94 | 0.97 |
| Lot D | 1.00 | 0.91 | 1.00 | 0.92 | 0.93 | 0.92 |
| Lot E | 0.98 | 1.02 | 0.93 | 0.92 | 0.91 | 0.86 |
| Lot G | 1.06 | 1.06 | 1.02 | 0.95 | 0.93 | 0.96 |
| Mean | 1.00 | 0.97 | 0.97 | 0.96 | 0.94 | 0.93 |
| SD | 0.051 | 0.083 | 0.037 | 0.030 | 0.020 | 0.035 |
| CV(%) | 5.1 | 8.6 | 3.9 | 3.1 | 2.1 | 3.8 |
The matrix factor (MF) was measured for each lot of hair samples at medium concentration in duplicate.
MF = (the analyte peak area in hair matrix)/(the analyte peak area in pure solution).
IS normalized MF = (the analyte vs IS peak area ratio in hair matrix)/(the analyte vs IS peak area ratio in pure solution).
Hair samples after processing stored at 4°C were stable for at least 5 days. The drugs in pooled incurred hair samples stored at room temperature were found to be stable for at least 4 months.
Clinical applications
We have applied this method to analyze 70 hair samples from WIHS patients on lopinavir/ritonavir-based HAART and 68 hair samples from WIHS patients on efavirenz-based HAART.19 The hair lopinavir median level in the responders (n = 52) was 1.6 ng/mg, which is significantly higher than the median level (0.3 ng/mg) in the non-responders (n = 18) (p <0.001, by Mann-Whitney test). The median efavirenz level in hair in the responders (3.4 ng/mg) (n = 54) was also significantly higher than the median level (0.68 ng/mg) in the non-responders (n = 14) (p <0.01, by Mann-Whitney test). The details of how hair antiretroviral levels are correlated with virologic response on therapy in WIHS participants will be reported elsewhere.20
DISCUSSION
There are several methods for extracting drug from human hair samples described in the literature, including: (1) Extraction with methanol or other organic solvents; (2) Extraction in strong acidic aqueous solutions, e.g., 0.1–0.6 M HCl; (3) Extraction under strong basic conditions, e.g., 1 M NaOH; and (4) Enzymatic digestion of hair, e.g., with proteinase digestion.9,17 Since efavirenz is unstable in strong acidic and basic aqueous solutions,18 these conditions were not suitable for efavirenz extraction. When comparing methanol extraction and enzyme digestion methods for efavirenz, lopinavir and ritonavir in human hair samples, we found that methanol extraction displayed a higher extraction efficiency. In addition, extraction was achieved efficiently from cut hair segments (1 mm) and grinding the hair into powder did not significantly improve the efficiency of drug extraction. Furthermore, cut hair has several advantages over hair powder: Cutting does not require special grinding equipment, which makes it more suitable for international settings; hair cutting is more rapid than hair grinding for hair sample preparation; finally, and more importantly, hair cutting is suitable for handling small amounts of hair.
Using 2 mg of cut hair, an LLOQ for ritonavir of 0.01 ng/mg hair can be obtained, while the LLOQs of lopinavir and efavirenz were set at 0.05 ng/mg hair, because the lopinavir and efavirenz hair levels were higher than the ritonavir hair level. These sensitivities are adequate to monitor these target medications in the hair of HIV-positive patients on antiretroviral therapy using very small amounts of hair (~10–30 strands). No interference peaks were observed for the three analytes in the blank human hair samples obtained from six drug-free volunteers. These results indicate that this method is not only highly sensitive, but also highly selective. Good intra- and interday accuracy and precision for the spiked QC samples have been obtained. The assay reproducibility was also demonstrated by analyzing the pooled incurred hair samples from patients who received antiretroviral therapy. No matrix ionization suppression or enhancement was observed. This method has been successfully applied to analyze more than 138 clinical hair samples for monitoring antiretroviral drug exposure in an observational cohort of HIV-infected women.
In conclusion, a highly sensitive and specific LC/MS/MS method has been developed and validated for analyses of the HIV medications, efavirenz, lopinavir and ritonavir, in human hair that reqires only small specimens of hair (~2 mg). This method may be also suitable for assaying other PIs and NNRTIs in human hair and methods are under development for these antiretrovirals in our laboratory.
Acknowledgments
Contract/grant sponsor: NIH; contract/grant number: R01 AI 65233-01.
We thank Quinn Yang and Diane Song for help in some sample preparations. This study is supported by NIH Grant R01 AI 65233-01.
References
- 1.Back D, Gibbons S, Khoo S. Ther Drug Monit. 2006;28:468. doi: 10.1097/01.ftd.0000211825.57984.41. [DOI] [PubMed] [Google Scholar]
- 2.Khoo SH, Lloyd J, Dalton M, et al. J Acquir Immune Defic Syndr. 2006;41:461. doi: 10.1097/01.qai.0000218345.65434.21. [DOI] [PubMed] [Google Scholar]
- 3.Vanhove GF, Schapiro JM, Winters MA, et al. J Am Med Assn. 1996;276:1955. [PubMed] [Google Scholar]
- 4.Condra JH, Schleif WA, Blahy OM, et al. Nature. 1995;374:569. doi: 10.1038/374569a0. [DOI] [PubMed] [Google Scholar]
- 5.Burger DM, Hugen PW, Aarnoutse RE, et al. Ther Drug Monit. 2003;25:73. doi: 10.1097/00007691-200302000-00011. [DOI] [PubMed] [Google Scholar]
- 6.Clevenbergh P, Garraffo R, Durant J, et al. AIDS. 2002;16:2311. doi: 10.1097/00002030-200211220-00011. [DOI] [PubMed] [Google Scholar]
- 7.Nettles RE, Kieffer TL, Parsons T, et al. Clin Infect Dis. 2006;42:1189. doi: 10.1086/501458. [DOI] [PubMed] [Google Scholar]
- 8.Gandhi M, Greenblatt RM. Ann Intern Med. 2002;137:696. doi: 10.7326/0003-4819-137-8-200210150-00016. [DOI] [PubMed] [Google Scholar]
- 9.Nakahara Y. J Chromatogr B Biomed Sci Appl. 1999;733:161. doi: 10.1016/s0378-4347(99)00059-6. [DOI] [PubMed] [Google Scholar]
- 10.Uematsu T. Clin Pharmacokin. 1993;25:83. doi: 10.2165/00003088-199325020-00001. [DOI] [PubMed] [Google Scholar]
- 11.Beumer JH, Bosman IJ, Maes RA. Int J Clin Pract. 2001;55:353. [PubMed] [Google Scholar]
- 12.Bernard L, Vuagnat A, Peytavin G, et al. Ann Intern Med. 2002;137:656. doi: 10.7326/0003-4819-137-8-200210150-00009. [DOI] [PubMed] [Google Scholar]
- 13.Servais J, Peytavin G, Arendt V, et al. AIDS. 2001;15:941. doi: 10.1097/00002030-200105040-00019. [DOI] [PubMed] [Google Scholar]
- 14.Duval X, Peytavin G, Breton G, et al. AIDS. 2007;21:106. doi: 10.1097/QAD.0b013e3280118486. [DOI] [PubMed] [Google Scholar]
- 15.Viswanathan CT, Bansal S, Booth B, et al. AAPS J. 2007;9:E30. [Google Scholar]
- 16.Alexander CS, Montaner JS, Asselin JJ, et al. Ther Drug Monit. 2004;26:516. doi: 10.1097/00007691-200410000-00009. [DOI] [PubMed] [Google Scholar]
- 17.Jurado C, Sachs H. Forensic Sci Int. 2003;133:175. doi: 10.1016/s0379-0738(03)00065-3. [DOI] [PubMed] [Google Scholar]
- 18.Maurin MB, Rowe SM, Blom K, et al. Pharm Res. 2002;19:517. doi: 10.1023/a:1015160132290. [DOI] [PubMed] [Google Scholar]
- 19.Gandhi M, Ameli N, Bacchetti P, et al. Concentrations of lopinavir and ritonavir in hair are strongly correlated with virologic success. Proc. 14th Conf. Retroviral and Opportunistic Infections; Los Angeles, California. 2007. [Google Scholar]
- 20.Gandhi M, Niloufar A, Bacchetti P, et al. Lancet. 2008 manuscript submitted. [Google Scholar]