

Abstract
Numerous cases of primary hypophysitis have been described over the past 25 years with, however, little insight into the cause(s) of this disease. In order to guide treatment, a better understanding of the pathogenesis is needed. We studied the pathogenesis of primary hypophysitis by analysing systematically the immune response at the pituitary tissue level of consecutive cases of ‘lymphocytic’ hypophysitis who underwent pituitary biopsy. In order to investigate further the pathogenesis of their diseases we characterized two cases at clinical, cellular and molecular levels. We show here, for the first time, that lymphocytic hypophysitis probably encompasses at least two separate entities. One entity, in agreement with the classical description of lymphocytic hypophysitis, demonstrates an autoimmune process with T helper 17 cell dominance and lack of T regulatory cells. The other entity represents a process in which T regulatory cells seem to control the immune response, which may not be self- but foreign-targeted. Our data suggest that it may be necessary to biopsy suspected primary hypophysitis and to analyse pituitary tissue with immune markers to guide treatment. Based on our results, hypophysitis driven by an immune homeostatic process should not be treated with immunosuppression, while autoimmune-defined hypophysitis may benefit from it. We show here for the first time two different pathogenic processes classified under one disease type and how to distinguish them. Because of our findings, changes in current diagnostic and therapeutic approaches may need to be considered.
Keywords: hypophysitis, granulomatous, lymphocytic
Introduction
Many hypotheses can be found in the literature regarding the pathogenesis of primary hypophysitis. Some suggest that primary hypophysitis includes three distinct histopathological subtypes (lymphocytic, granulomatous and xanthomatous). Others propose that hypophysitis comprises a spectrum of only one disease, lymphocytic hypophysitis (LYH). Still others describe an identical immunopathogenic profile, whatever the histopathological subtype [1–5]. Furthermore, although autoimmune pathogenesis is the most-cited mechanism of disease, there has never been a specific target antigen identified and anti-pituitary antibodies have been detected only in a minority of patients [6,7].
If autoimmunity were to be involved in LYH, lack of immune tolerance would be needed as a prerequisite. Four subsets of helper T cells, Th1, Th2, Th17, and T regulatory cells (Tregs) have been implicated in immune modulation and peripheral tolerance [8,9]. Specifically, Th17 has been associated with autoimmunity [8]. Tregs, on the other hand, seem to regulate immune homeostasis in lymphoid tissue and can be found at the site of inflammation. Tregs use their suppressive mechanisms to control the inflammatory processes, down-regulate autoimmunity and are involved in tolerance to chronic infections [9,10]. Identifying these particular subsets of T cells in the target tissue may provide further insight into the pathogenesis of primary hypophysitis. Moreover, treatment options may be better guided. Currently, for a minority of patients the disease will resolve spontaneously, but some seem to benefit from transient immunosuppressive therapy (steroids). However, for many there is eventual destruction of the pituitary acinar cells, and a chronic need for various hormone replacements whether or not treatment has been used [6].
We encountered two consecutive cases of hypophysitis with dramatically different presentations, both diagnosed as LYH on post-biopsy pathology. In order to define further the pathogenic characteristics of this disease, we studied clinical and immunocytological features comprehensively from these two cases, focusing specifically on immunomodulatory markers.
Subjects, materials and methods
Patient A
Patient A is a 29-year-old female who presented 2 years postpartum with acute onset of heachache (HA), diabetes insipidus (DI), menstrual irregularities and galactorrhoea. Magnetic resonance imaging (MRI) showed lack of a pituitary ‘bright spot’ and a diffuse heterogeneous enhancing mass within the pituitary gland involving the anterior and posterior lobes with additional extension into the pituitary stalk (Table 1). Work-up of infiltrative disease processes such as histiocytosis X and sarcoidosis was negative. Because aetiology of the mass was still not definitive, the patient underwent transsphenoidal biopsy of the sellar mass. Histopathology revealed LYH. The patient was started on prednisone, with resolution of her HA, galactorrhoea, menstrual irregularities and improvement of her DI symptoms. She did not require hormone replacement; however, with discontinuation of the high-dose steroids her HA and DI symptoms returned. Because she did not want to remain on high-dose steroids long-term, and her HA was unrelenting over 1 year, she underwent a complete transsphenodial hypophysectomy. Histopathology of this second specimen was, as the first specimen, consistent with LYH. She now has relief of her HA, but requires replacement of all her pituitary hormones.
Table 1.
Clinical, histopathological and immunological characteristics of patients.
| Patient A | Patient B | P-value | |
|---|---|---|---|
| Gender | Female | Male | |
| Age | 29 | 52 | |
| Onset of symptoms | Subacute with stability over 2 years | Acute with worsening over 4 months | |
| Symptoms | Headache, polyuria, polydipsia, decreased libido, galactorrhea, menstrual irregularities | Headache, fatigue, weakness, polyruia, polydipisia, decreased libido | |
| Associated medical condition | 2 years post-partum | NONE | |
| MRI description |
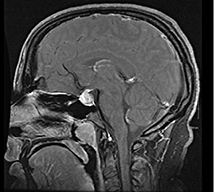 Diffuse heterogeneous enhancing mass involving anterior, posterior, and stalk with loss of pituitary bright spot Diffuse heterogeneous enhancing mass involving anterior, posterior, and stalk with loss of pituitary bright spot |
 Well defined, enhancing sellar mass displacing optic chiasm Well defined, enhancing sellar mass displacing optic chiasm |
|
| TSH (0·5–4·7) µIU/mL | 1·66 | < 0·06 | |
| Free T4 (0·7–1·8) ng/dL | 0·8 | 0·5 | |
| 8am Cortisol (6–24) mcg/dL | 23·9 | 2·0 | |
| Total testosterone (28–110) ng/dL | NA | < 2 | |
| Free testosterone (0·2–1·0) nmol/L / (47–244) pg/mL | 0·9 | 10 | |
| FSH (1·4–18·1) mIU/mL | 4·2 | 2 | |
| LH (1·5–9·3) mIU/mL | 3·6 | 0·1 | |
| IGF-1 (117–329) ng/mL / (87–225) ng/mL | 177 | 105 | |
| Prolactin (2·1–17·7) ng/mL / (2·1–47·6) g/mL | 36·3 | 10 | |
| Histopathology report | Lymphocytic hypophysitis. The excised tissue reveals pituitary with some fibrosis noted in between the acini and varying degrees of inflammatory cell infiltration. The inflammatory cells consist mostly of lymphocytes, the preponderance of which are T cells as well as a small population of B cells. Plasma cells and eosinophils are also identified in the tissue. An adenoma is not seen. | Lymphocytic hypophysitis with multinucleated giant cells. Intense inflammatory cell infiltration consisting mostly of lymphocytes with some plasma cells, neutrophils and eosinophils. Often, the lymphocytic infiltrate reveals a germinal matrix of B cells and T cells which constitute the larger part of the inflammatory infiltrate formation. Many foci of intense infiltration contain multinucleated giant cells with some having blue-staining material consistent with so-called Schaumann bodies. There is no microorganism identified with GMS or acid-fast bacillus stains. No granulomatous features are seen. | |
| CD3 cells/field | 359·10 | 1046·95 | < 0·001 |
| CD20 cells/field | 69·54 | 286·40 | < 0·001 |
| CD4 cells/field | 30·96 | 8·60 | < 0·001 |
| CD8 cells/field | 17·64 | 11·76 | 0·113 |
| INF-γ cells/field | 32·71 | 13·29 | < 0·05 |
| IL-4 cells/field | 26·80 | 8·46 | < 0·001 |
| MAST cells/field | 53·60 | 56·90 | 0·598 |
| Neutrophil cells/field | 13·10 | 15·15 | 0·58 |
| CD68 cells/field | 19·24 | 16·42 | 0·55 |
| MAC-1 cells/field | 50·78 | 27·63 | < 0·05 |
| IL-17 cells/field | 98·45 | 219·10 | 0·095 |
| FoxP3 cells/field | 5·57 | 138·40 | < 0·001 |
FoxP3, forkhead box P3; GMS, Gomori methenamine silver; IL, interleukin; INF, interferon; MRI, magnetic resonance imaging; NA, not available.
Patient B
Patient B is a 52-year-old overall healthy male until he presented with chronic HA followed by fatigue, weakness, polyuria and polydipsia. MRI of the pituitary identified a well-defined enhancing sellar mass superiorly displacing the optic chiasm (Table 1). The mass was interpreted as a macroadenoma. Biochemical analysis was consistent with hypogonadotrophic hypogonadism, central hypothyroidism, central hypoadrenalism and DI. After hormone replacement was initiated, the patient underwent pituitary resection (transsphenoidal approach). Histopathological examination of the entire specimen revealed LYH. No areas of granuloma formation were found but giant cells were seen multi-focally. Post-operatively, the patient's HA resolved, but he continued to require hormone replacement.
Histology, immunohistochemisty and immunofluorescence
Paraffin-embedded sections were prepared from the biopsy samples fixed previously in 10% buffered formalin. Haematoxylin and eosin staining was used for basic histology and for correlation with specific immunohistochemistry.
Immunohistochemistry was used to characterize the cellular composition of the pituitary inflammation. Anti-CD20 for identification of B cell lineage and anti-CD3 (both 1:100 from BD Pharmingen, San Jose, CA, USA) for T cell lineage were used as primary antibodies. Secondary species-specific horseradish peroxidase-linked antibodies were developed with commercial substrate (Vector, Burlingame, CA, USA). A histomorphometric microscope study was performed in 17 or more randomly selected fields [11]. Briefly, the number of cells labelling positive within regions were determined by counting the number of positive cells per equivalent microscopic field, at a magnification of 20×, using a light microscope. In every slide, at least 17 fields were examined, and the mean count of these fields was expressed as cell count per microscopic field. The cell counting was performed by two investigators independently with slides blinded by code.
Immunofluorescence was performed on deparaffinized sections pretreated for antigen retrieval with Retrivagen (BD Pharmingen) at 90°C for 10 min. Endogenous peroxidase activity was quenched with 0·3% H2O2 for 10 min in phosphate-buffered saline. For reduction of background staining, the sections were treated for 1 h with 5% normal serum from the same species as the labelled antibody used. The samples were incubated with primary antibody in a humid chamber at 4°C overnight. Primary antibodies used were: anti-human CD4, CD8, CD68 (1:100) (BD Pharmingen); interferon (IFN)-γ, interleukin (IL)-4 (1:50) (Serotec, Raleigh, NC, USA); IL-17 (H-132) (1:200) (Santa Cruz Inc., Santa Cruz, CA, USA); CD11b/Mac-1 (1:100) (Vector); and forkhead box P3 (FoxP3) (1:200) (Abcam, Cambridge, UK). Secondary monoclonal antibodies, biotinylated and species-specific, were followed by avidin–fluorescein (Vector) staining. For counterstaining, cells were labelled with the nuclear stain TO-PRO 3 (Molecular Probe, Eugene, OR, USA). Negative control was incubated with secondary antibody but not primary antibody. All immunofluorescence images were collected using a laser scanning confocal microscope.
Statistics
Two-tailed P-values smaller than 0·05 were considered statistically significant.
Results
Clinically different presentations with the same imaging and histopathological diagnosis
Both patients A and B were given the similar imaging description and the same pathological diagnosis of LYH; however, the patients showed dramatic differences in demographic characteristics and clinical presentation, as follows (Table 1).
With regard to demographics, patient A is a young female 2 years postpartum with a presentation similar to the classically described cases of LYH, while patient B is an otherwise healthy middle-aged man (Table 1).
Clinically, patient A had mass effect symptoms of HA and disruption of her pituitary stalk resulting in DI and galactorrhoea. She did not require hormone replacement. Similarly, patient B had both mass effect symptoms of HA and DI; however, he required full replacement of pituitary hormones upon presentation (Table 1).
Detailed histopathological analysis reveals unexpected differences
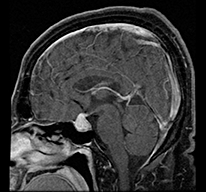
Although both patients had the same histopathological diagnosis of LYH, haematoxylin and eosin staining revealed that patient A had more disperse lymphocytic infiltrate while in patient B the lymphocytic infiltration appeared more organized in structures resembling lymph-node germinal centres (Fig. 1). These germinal centres consisted of CD20-positive B cells located centrally with peripheral CD3-positive T cells (Fig. 2). As described in the original histopathological report (Table 1), giant cells were noted. However, no granulomatous features were observed.
Fig. 1.
Haematoxylin and eosin staining of pituitary of patient A (left) and patient B (right) reveals that patient A has more disperse lymphocytic infiltrate, while in patient B the infiltrate is more organized, resembling a lymph node with a germinal centre. Low (5×) and high magnifications (20×) are shown.
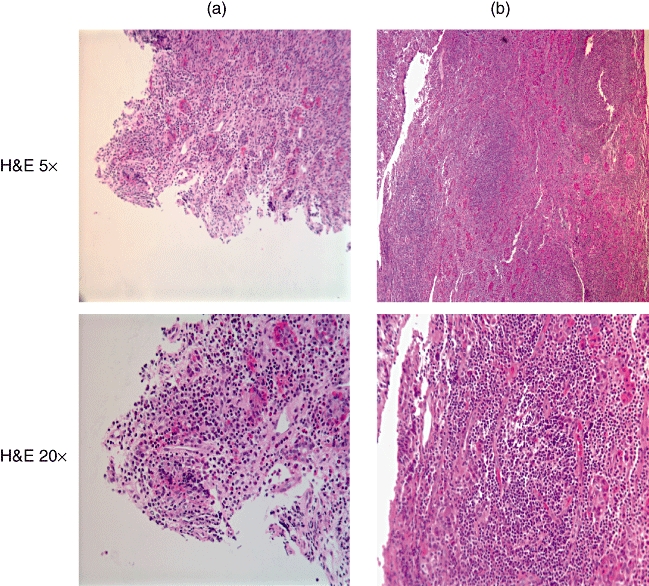
Fig. 2.
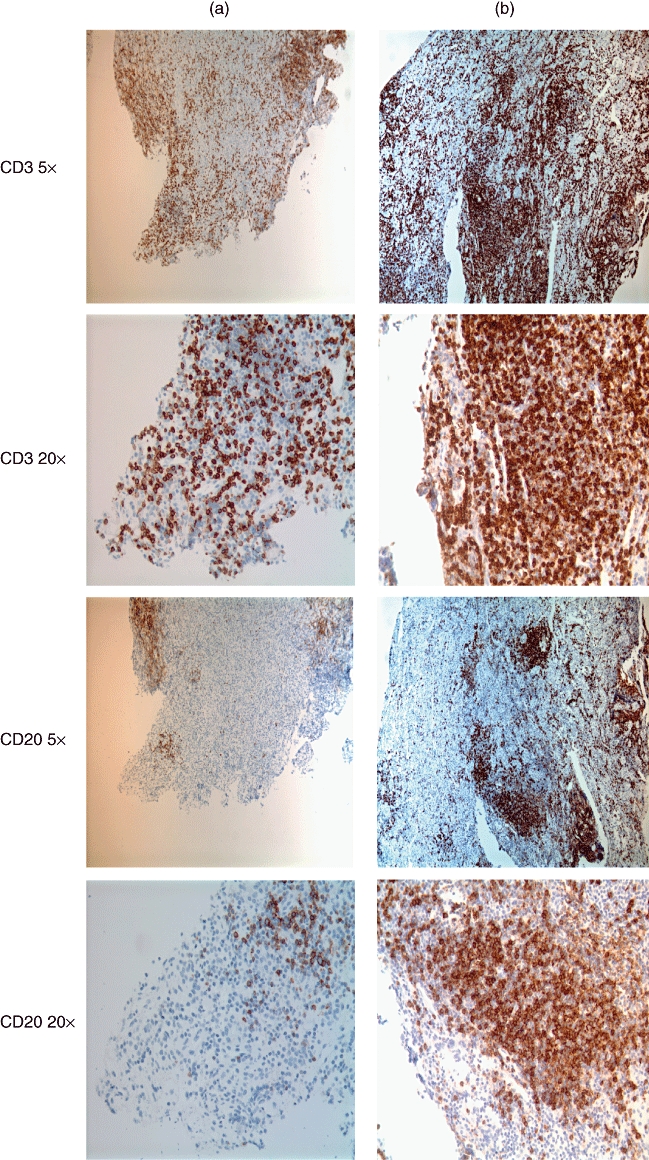
Immunohistochemistry with anti-CD3 (top four pictures) and anti-CD20 (bottom four pictures) antibodies on serial sections of pituitary at 20 µm intervals of patient A (left) and patient B (right). Low (5×) and high (20×) magnifications are shown. Most of the lymphocytes seen in both patients label with CD3 antibody (classified as T lymphocytes). Although B lymphocytes (CD20-labelled) are less numerous in both patients, patient A has only a fraction of the B lymphocytes found in patient B. Note the germinal centre consisting of CD20-positive B cells and peripheral CD3-positive T cells in patient B, right.
Anti-CD20 and -CD3 are used routinely to classify lymphocytes. Most of the lymphocytes seen in both patients’ specimens stained for CD3 representing T lymphocytes (Fig. 2). They were three times more abundant in patient B than in patient A (Table 1). Anti-CD20 stains B lymphocytes. Although B lymphocytes were less numerous in both patients compared with T lymphocytes, patient A had only a fraction of the B lymphocytes found in patient B (Fig. 2 and Table 1). In patient B most of the CD3 positive cells also labelled for CD8 rather than CD4 (CD4/CD8 ratio of 0·73), while in patient A most of the CD3-positive cells labelled for CD4 and not CD8 (CD4/CD8 ratio 1·76) (Fig. 3 and Table 1). The difference in CD4 counts between the patients was statistically significant. Also statistically significant was the difference in expression of IL-4 and IFN-γ. Both were more than two times more prevalent in patient A, as might be expected, given the CD4 dominance.
Fig. 3.
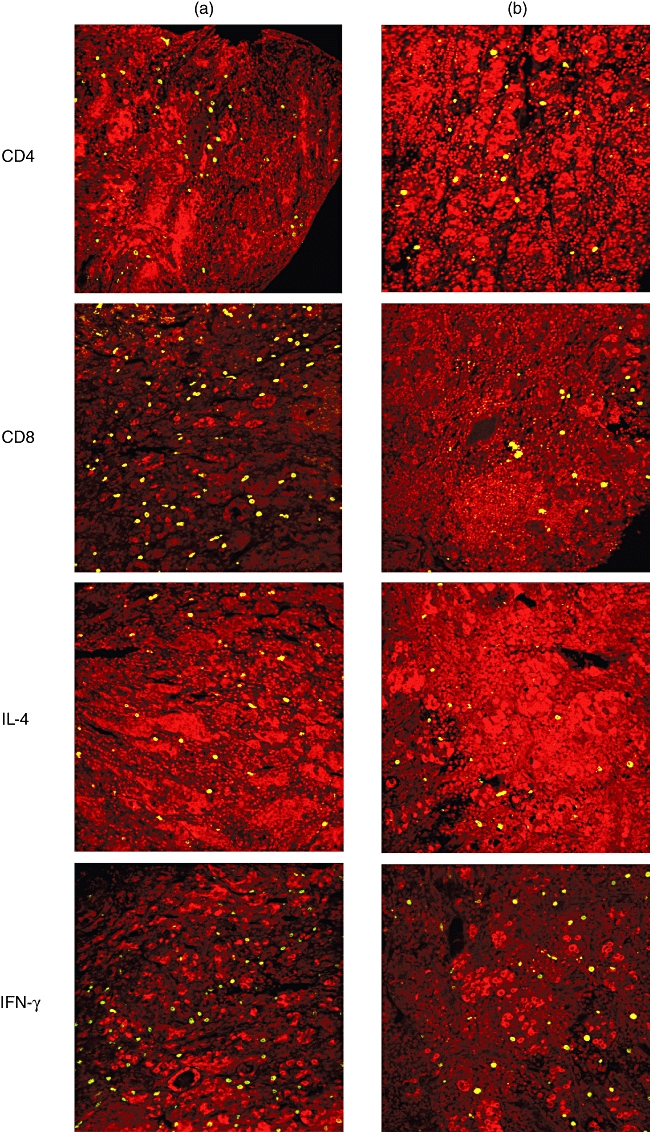
Immunofluorescence of pituitary with anti- (from top to bottom) CD4, CD8, interleukin (IL)-4 and interferon (IFN)-γ of patient A (left) and patient B (right). In patient A most of the CD3-positive cells fluoresce for CD4 not CD8 (CD4/CD8 ratio 1·76). In patient B, however, most of the CD3 positive cells fluoresce for CD8 rather than CD4 (CD4/CD8 ratio of 0·73). The difference in CD4 counts between the patients is statistically significant, as well as the difference in expression of IL-4 and IFN-γ (P < 0·05). All images are confocal with nuclei fluorescing red.
The macrophage marker CD68 was expressed equally in both patients, while MAC-1 (CD11b), a marker for macrophages, monocytes, granulocytes and natural killer (NK) cells, was significantly higher in patient A compared with patient B (Fig. 4 and Table 1). Both patients had similar numbers of mast cells and neutrophils (Table 1).
Fig. 4.
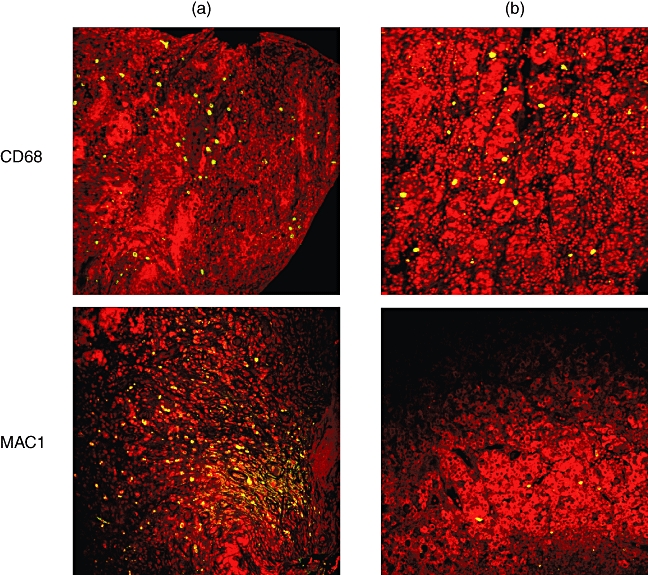
Immunofluorescence of pituitary of patient A (left) and patient B (right). Macrophage anti-CD68 fluorescence is expressed equally in both patients, while anti-MAC-1 (CD11b), a marker for macrophages, monocytes, granulocytes and natural killer (NK) cells, is significantly higher in patient A compared with patient B. All images are confocal with nuclei fluorescing red.
The IL-17 expression, which is now thought to identify another subset of helper T cells known as Th17 cells [8], was slightly more numerous in patient B, but this difference was not statistically significant and can be accounted for by the difference in amount of T cells in each patient (Fig. 5 and Table 1).
Fig. 5.
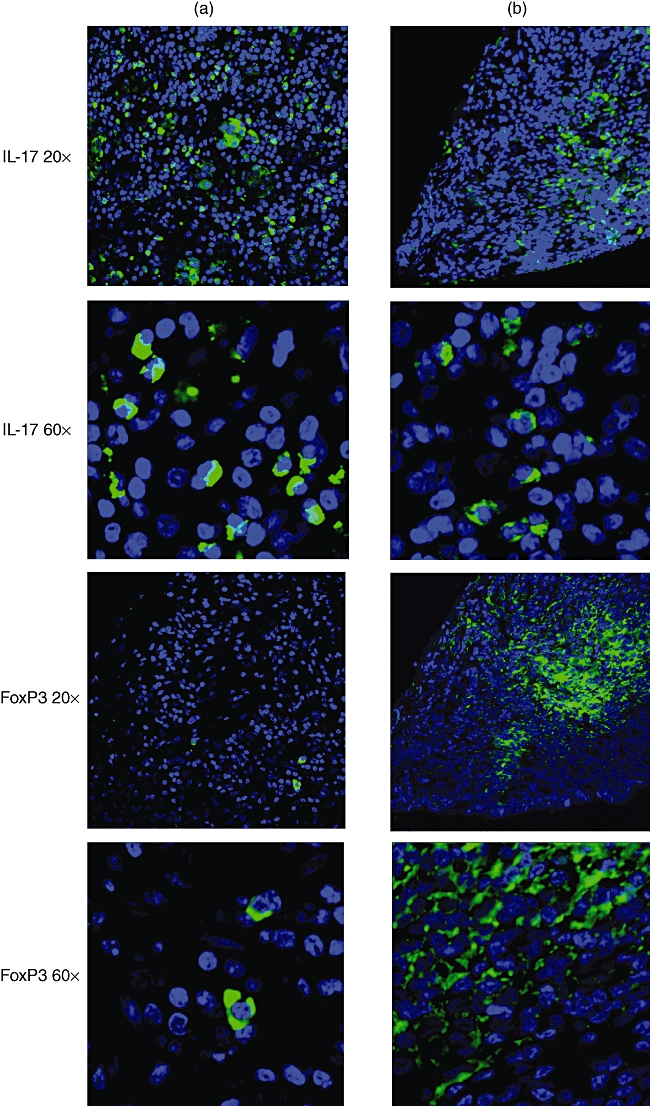
Immunofluorescence of serial sections of pituitary at 20 µm intervals of patient A (left) and patient B (right). At lower (20×) and higher (60×) magnifications confocal microscope views of anti-interleukin (IL)-17 (top four pictures) and anti-forkhead box P3 (FoxP3) (bottom four pictures)-labelled specimens are shown. Nuclei fluoresce blue. Note the more abundant and dispersed distribution of IL-17 in patient A than in B. Anti-FoxP3 (Tregs) labelling is present almost exclusively in patient B, with a central germinal centre distribution.
The most striking difference in T cell markers between the two patients was FoxP3. FoxP3 is a marker for Tregs[10]. It was 20 times more numerous in patient B, while scarce in patient A (Fig. 5 and Table 1).
Discussion
A literature review suggests that primary hypophysitis is one clinical entity with several histological subtypes [1–5]. Furthermore, it has been suggested that all subtypes of hypophysitis exhibit almost identical immunohistological and pathogenic profiles [1]. We have encountered two consecutive cases of hypophysitis that challenge this unifying hypothesis. We report here important differences that may lead to better understanding of the underlying pathogenesis of disease and provide evidence for separate disease processes versus a spectrum of the same disease.
From the clinical scenarios of these two consecutive patients to the histology and immunofluorescence/histochemical analysis, numerous differences arise. Whether one patient represents classic LYH and the other the subtype of granulomatous hypophysitis without true granuloma formation may, in fact, be speculated. However, our data suggest that whatever the histopathological classification, these two disease processes are distinct, and probably not part of a spectrum but are, perhaps, single entities.
Paramount to our hypothesis is the difference in Tregs seen in the two patients’ specimens. Patient A has virtually no Tregs, but a clear abundance of IL-17-positive cells. This would favour a classical autoimmune aetiology of the disease process. The lack of Tregs is often seen in autoimmune diseases such as multiple sclerosis, rheumatoid arthritis and juvenile rheumatoid arthritis [12]. Murine knock-out models for CD4+CD25+ T cells (mainly Tregs) also develop autoimmune diseases [12]. Clearly, Tregs play an important role in the control of autoimmune processes. Furthermore, IL-17 has received a great deal of attention recently and has been implicated in autoimmune disease processes such as rheumatiod arthritis, systemic lupus erythematous and multiple sclerosis [8]. The lack of Tregs and the abundance of IL-17 make an autoimmune process highly probable in patient A. Adding more support to this assumption is the CD4/CD8 ratio. In comparison, although having cells staining positive for IL-17, Patient B had an overwhelming Treg response. Clearly, Treg cells are playing an important role in this patient's disease process.
The Tregs have been found in granuloma-forming diseases. They accumulate in vast numbers in areas infected by Mycobacterium tuberculosis and suppress immune responses to persistent chronic infections such as those caused by Helicobacter pylori, Listeria monocytogenes, hepatitis C virus and human immunodeficiency virus [13,14]. In patients with sarcoidosis, Tregs are found within the granuloma, in peripheral blood and in bronchoalveolar lavage fluids [15]. Because of the ability of Tregs to down-regulate but not completely suppress immunity in sarcoidosis, investigators [15] propose that Treg cell amplification is not enough to control local sarcoid inflammation, but may account for the patients’ state of anergy. This could also explain some of the findings in patient B. Perhaps Tregs control local inflammation, thus allowing a more chronic process of pituitary infiltration. Patient B, however, did not have evidence of other systemic infectious disease, with a normal chest X-ray and no microorganisms identified with Gomori methenamine silver or acid-fast bacillus stains at the tissue level.
The IFN-γ and IL-4 are cytokines that influence the phenotype of helper T cells at time of activation. IFN-γ drives cells directly and indirectly by inhibiting the function of IL-4 towards a Th1 response, while IL-4 drives the helper T cell response towards Th2 [9]. The Th1 response promotes cellular immunity, thus cytotoxic CD8+ cells and macrophages dominate. The Th2 response promotes humoral immunity and antibody production [9]. Neither patient had classic IFN-γ or IL-4 patterns towards a specific Th1 or Th2 response. This might be explained by the fact that IL-17 was found in abundance in both patients. Patient A's immune response may be characterized as a Th17 helper type of response, while patient B's immune response, although with an IL-17 presence, demonstrates an overpowering Treg dominance compared with patient A (IL-17/FoxP3 ratio of 0·05 for patient A versus 0·65 for patient B).
As conducted previously by Vidal and colleagues [16], we studied mast cell localization in these cases of LYH. We also found an abundance of mast cells in both our patients [16]. Mast cell markers were essentially equal for both patients. Mast cells play a role in allergies and anaphylaxis, wound healing and attack against pathogens. Because the immune response in both patients is probably not driven by an allergen, we speculate that the mast cell is behaving more as an innate immunity component by secreting cytokines and other inflammatory mediators.
More support for a possible autoimmune aetiology in patient A may be found in the difference in macrophage markers. Macrophages are involved in the immune response by their ability to phagocyte invasive pathogens and stimulate lymphocytes and other immune cells. They also play a role in granuloma formation. Two markers were used to identify macrophages, CD68 and CD11b (MAC-1). In patient A, there was a discrepancy between the two markers with CD11b staining for more than twice as many cells, while patient B had essentially equal amounts of cells co-staining for the two markers (co-staining not shown). Both CD68 and CD11b recognize macrophages, monocytes and granulocytes, but in addition CD11b also recognizes NK cells. The difference in cell count between the two markers in patient A probably represents NK cells. NK cells are part of the innate immune system, but these cells have also been implicated in autoimmunity in multiple sclerosis and in the development of diabetes in mouse models [17–19]. The NK cells in patient A may be playing a role in the autoimmune process.
Other investigators have accounted previously for some of the immune cells described in our study. However, the role of IL-17 and Treg cells has never been characterized in primary hypophysitis. Our results would indicate that although both patients were diagnosed initially with LYH, upon comprehensive comparison of clinical presentation, histology, immunohistochemistry, immunofluorescence studies and outcome their disease processes are distinct. Patient A clearly has an autoimmune process of the pituitary causing her symptoms. Patient A's histology and clinical course reflect the classical description of LYH, often referred to as autoimmune hypophysitis. Our results confirm this as the correct terminology, as it reflects the pathogenesis of the disease. Patient B's case, however, does not correspond with classical autoimmune pathology. Patient B's pathogenesis may more probably reflect a homeostatic immune process of either infectious or infiltrative aetiology.
With our use of new markers, these processes can now be distinguished. Pituitary biopsy, although invasive, is currently the only option we have to determine the exact pathogenesis and may be warranted in order to provide correct treatment. Investigators have found a strong presence of Tregs in peripheral blood in diseases known to have rich populations of Tregs at tissue sites [15]. Although we did not explore for the presence of peripheral Tregs, their identification may help to diagnose and/or distinguish different forms of hypophysitis. It seems essential to make this distinction because of its potential to guide treatment decisions. Patients with an autoimmune-driven hypophysitis would benefit from steroids or other immunosuppression treatment, whereas immunosuppression may exacerbate conditions that are not autoimmune.
Acknowledgments
We would like to thank Drs Roger Kulstad and John Kuo for their referral of the two cases. This work was funded in part by NIH and VA grants (J. C. J.).
References
- 1.Gutenberg A, Buslei R, Fahlbusch R, et al. Immunopathology of primary hypophysitis: implications for pathogenesis. Am J Surg Pathol. 2005;29:329–38. doi: 10.1097/01.pas.0000149707.12335.8e. [DOI] [PubMed] [Google Scholar]
- 2.Gutenberg A, Hans V, Puchner M, et al. Primary hypophysitis: clinical–pathological correlations. Eur J Endocrinol. 2006;155:101–7. doi: 10.1530/eje.1.02183. [DOI] [PubMed] [Google Scholar]
- 3.McKeel DW. Primary hypothyroidism and hypopituitarism in a young woman. Am J Med. 1984;77:319–30. doi: 10.1016/0002-9343(84)90710-1. [DOI] [PubMed] [Google Scholar]
- 4.Tashiro T, Sano T, Xu B, et al. Spectrum of different types of hypophysitis: a clinicopathologic study of hypophysitis in 31 cases. Endocr Pathol. 2002;13:183–95. doi: 10.1385/ep:13:3:183. [DOI] [PubMed] [Google Scholar]
- 5.Rivera JA. Lymphocytic hypophysitis: disease spectrum and approach to diagnosis and therapy. Pituitary. 2006;9:35–45. doi: 10.1007/s11102-006-6598-z. [DOI] [PubMed] [Google Scholar]
- 6.Caturegli P, Newschaffer C, Olivi A, et al. Autoimmune hypophysitis. Endocr Rev. 2005;26:599–614. doi: 10.1210/er.2004-0011. [DOI] [PubMed] [Google Scholar]
- 7.Caturegli P. Autoimmune hypophysitis: an underestimated disease in search of its autoantigen(s) J Clin Endocrinol Metab. 2007;92:2038–40. doi: 10.1210/jc.2007-0808. [DOI] [PubMed] [Google Scholar]
- 8.Betteli E, Oukka M, Kuchroo VK. TH-17 cells in the circle of immunity and autoimmunity. Nat Immunol. 2007;8:345–50. doi: 10.1038/ni0407-345. [DOI] [PubMed] [Google Scholar]
- 9.Jaume JC. Endocrine autoimmunity. In: Gardner DG, Shoback DM, editors. Greenspan's basic and clinical endocrinology. 8th edn. New York: McGraw-Hill; 2007. pp. 59–79. [Google Scholar]
- 10.Tang Q, Bluestone JA. The Foxp3+ regulatory T cell: a jack of all trades, master of regulation. Nat Immunol. 2008;9:239–44. doi: 10.1038/ni1572. [DOI] [PMC free article] [PubMed] [Google Scholar]
- 11.Vrolijk JM, Kwekkeboom J, Janssen HL, et al. Pretreatment intrahepatic CD8+ cell count correlates with virological response to antiviral therapy in chronic hepatitis C virus infection. J Infect Dis. 2003;188:1528–32. doi: 10.1086/379334. [DOI] [PubMed] [Google Scholar]
- 12.Afzali B, Lombardi G, Lechler RI, et al. The role of T helper 17 (Th17) and regulatory T cells (Treg) in human organ transplantation and autoimmune disease. Clin Exp Immunol. 2007;148:32–46. doi: 10.1111/j.1365-2249.2007.03356.x. [DOI] [PMC free article] [PubMed] [Google Scholar]
- 13.Scott-Browne JP, Shafiani S, Tucker-Heard G, et al. Expansion and function of Foxp3-expressing T regulatory cells during tuberculosis. J Exp Med. 2007;204:2159–69. doi: 10.1084/jem.20062105. [DOI] [PMC free article] [PubMed] [Google Scholar]
- 14.Belkaid Y, Rouse BT. Natural regulatory T cells in infectious disease. Nat Immunol. 2005;6:353–60. doi: 10.1038/ni1181. [DOI] [PubMed] [Google Scholar]
- 15.Miyara M, Amoura Z, Parizot C, et al. The immune paradox of sarcoidosis and regulatory T cells. J Exp Med. 2006;203:359–70. doi: 10.1084/jem.20050648. [DOI] [PMC free article] [PubMed] [Google Scholar]
- 16.Vidal S, Rotondo F, Horvath E, et al. Innunocytochemical localization of mast cells in lymphocytic hypophysitis. Am J Clin Pathol. 2002;117:478–83. doi: 10.1309/A7N5-08DQ-RHET-N57H. [DOI] [PubMed] [Google Scholar]
- 17.Alba A, Planas R, Clemente X, et al. Natural killer cells are required for accelerated type 1 diabetes driven by interferon-beta. Clin Exp Immunol. 2008;151:467–75. doi: 10.1111/j.1365-2249.2007.03580.x. [DOI] [PMC free article] [PubMed] [Google Scholar]
- 18.Morandi B, Bramanti P, Bonaccorsi I, et al. Role of natural killer cells in the pathogenesis and progression of multiple sclerosis. Pharmacol Res. 2008;57:1–5. doi: 10.1016/j.phrs.2007.11.003. [DOI] [PubMed] [Google Scholar]
- 19.Elagin RB, Balijepalli SY, Diacovo MJ, Baekkeskov S, Jaume JC. Antigen specific insulitis in ‘humanized’ transgenic mice. Program of the 89th Annual Meeting of the Endocrine Society, Toronto, Canada 2007 (June 2–5), OR1-3 p75.