

Abstract
The search for genetic factors associated with disease is complicated by the complexity of the biological pathways linking genotype and phenotype. This analytical complexity is particularly concerning in diseases historically lacking reliable diagnostic biological markers, such as schizophrenia and other mental disorders. We investigate the use of functional magnetic resonance imaging (fMRI) as an intermediate phenotype (endophenotype) to identify physiogenomic associations to schizophrenia. We screened 99 subjects, 30 subjects diagnosed with schizophrenia, 13 unaffected relatives of schizophrenia patients, and 56 unrelated controls, for gene polymorphisms associated with fMRI activation patterns at two locations in temporal and frontal lobes previously implied in schizophrenia. A total of 22 single nucleotide polymorphisms (SNPs) in 15 genes from the dopamine and serotonin neurotransmission pathways were genotyped in all subjects. We identified three SNPs in genes that are significantly associated with fMRI activity. SNPs of the dopamine beta-hydroxylase (DBH) gene and of the dopamine receptor D4 (DRD4) were associated with activity in the temporal and frontal lobes, respectively. One SNP of serotonin-3A receptor (HTR3A) was associated with temporal lobe activity. The results of this study support the physiogenomic analysis of neuroimaging data to discover associations between genotype and disease-related phenotypes.
Keywords: Schizophrenia, Genetics, Auditory oddball, Functional MRI, Physiogenomics, Biomarkers, Endophenotypes, Dopamine receptors, Serotonin receptors
INTRODUCTION
Brain imaging techniques such as positron emission tomography, magnetic resonance imaging (MRI), magneto-encephalography, and electro-encephalography are being applied increasingly to study the structure, function, and psychopathology of the human brain.94,95,97,101,110 For psychiatric disorders, the correct phenotype for study has traditionally been based on clinician observation supplemented by the patient’s subjective report of mental state. More recently, some have argued that biological factors such as electrophysiologic measures, or brain structural or functional determinations associated with the illness should be added to the conventional disease phenotype.106 Such biologically based measures that are reliably associated with the illness have been termed “biomarkers.”80,102 When such biomarkers are identified with greater frequency in unaffected, close relatives of persons with the illness than in the general population, they have been termed intermediate phenotypes or “endophenotypes.”47 Genetics has also been of considerable interest in the study of schizophrenia, which has been shown to have a strong inherited component in twin studies54; several candidate risk genes have been identified.40
Recent results suggest that in schizophrenia disturbances in working memory and associated prefrontal cortex activation may be two genetically influenced markers for vulnerability to schizophrenia8,35,68,93 that may be endophenotypes as well as biomarkers.13 Multiple studies report that certain brain regions such as anterior cingulate cortex and prefrontal cortex may be closely related to specific dysfunctions seen in schizophrenia.1,44 However, relatively little is known about the genetics of these dysfunctions, although their potential in the search for genetic associations has been recognized.34,69,108
There is substantial evidence that schizophrenia is likely to be a complex genetic disorder, with multiple risk genes of individually weak effect.79 Therefore, a multivariate approach, capable of extracting hidden cross-information from a larger number of genes, has the potential to uncover influences of multiple genetic factors on the functions of both healthy and disordered brains. Most genetic risk studies focus on particular genes or polymorphisms of interest and examine the univariate relationship between a genotype and a phenotype. For example, the association of the G72/G30 locus with schizophrenia and bipolar disorder has been reported in several studies.22,36 Other genes and polymorphisms studied in schizophrenia include a brain-derived neurotrophic factor (BDNF) prodomain polymorphism,2,41,72 Catechol-O-methyl-transferase (COMT),42,71,75 gamma aminobutyric acid (GABA),38,55,59,112 histidine triad nucleotide-binding protein (HINT1) and cytosolic malate dehydrogenase (MDH1).3,16,109 Some researchers have presented data derived from multimodal imaging or combined data from both imaging and other modalities, including genomic imaging).31,39 Further developments to extend and implement multimodal aspects of the disease are needed.
The recent availability of the human genome sequence53 and its variability96,107 together with the development of massively parallel genotyping has led to a rush to search for genetic determinants of physiological variability, especially as it pertains to human diseases. Typically, a population of patients is assessed for the trait of interest and compared to a control cohort, and DNA samples are taken for genotyping. The samples are genotyped at selected single nucleotide polymorphisms (SNPs) and statistical analysis is performed to determine if the genotypes are significantly associated with the trait.
The results of these population studies have been inconsistent. Often, results are published that do not later replicate in other studies.14,19,23,32,82,91 There are multiple factors that render it difficult for these studies to produce reliable results, such as the high rate of false positives due to multiple testing,73 population structure, 64 and the presence of confounding factors or limitations in the clinical data.
We have recently developed a biomedical engineering approach, termed “physiogenomics,”43,89 to address the inherent limitations of genetic associations. Physiogenomics is a medical application of sensitivity analysis. Sensitivity analysis is the study of how variation of system components contributes to variation in output response to a given input.92 Physiogenomics utilizes the variability in genes as system components, measured by SNPs, and determines how the SNP frequency among individuals relates to the variability in physiologic characteristics, the output. Physiogenomics recognizes that in most cases no single polymorphism will provide useful information about a phenotype of interest, and advances the concept of ensembles of SNP markers that together with a predictive algorithm can explain a large part of the variation in response. Physiogenomic analysis takes advantage of the concept of systems biology by including biomarkers in the analysis to bridge the gulf of complexity between gene polymorphisms and clinical observations. In this study, we focus on the use of biomarkers as endophenotpyes, while applying standard methods for SNP association testing.
We used neuronal activity measured by functional magnetic resonance imaging (fMRI) during the performance of an auditory oddball task, already shown to be pertinent to schizophrenia pathophysiology,10,50 as a biomarker. In this task, infrequent novel target stimuli must be detected among both novel and frequent standard background stimuli. Electrophysiologic event-related potentials (ERP) have been used to study aspects of the orienting response in for many years. There, the novel stimuli are associated with a sequence of electrical components the most prominent of which is a large broadly distributed positive wave termed the ‘P3’ or ‘P300.’ The P3 elicited by novel and target stimuli likely represent processes involving attention capture, allocation of cognitive resources, and contextual updating. These are all components of the orienting response, which is abnormal in schizophrenia.65
Event-related fMRI has made it possible to measure the hemodynamic response for distinct events.50,77,84 Prior investigators have performed such studies of brain activity associated with processing low-probability sensory stimuli. McCarthy et al. found that oddball visual stimuli elicited activation in the middle frontal gyrus, inferior parietal lobule (IPL), and posterior singulate cortex (PCC).66 Menon et al. found that auditory target stimuli generated activity in IPL,67 and a large-scale study of auditory oddball processing in healthy controls50 illuminated a large-scale circuit including the previously mentioned regions. Several recent fMRI studies attempt to elucidate brain activity elicited by stimuli producing the P3b,9,15,48,49,58,66,67,78,100 which implicates multiple heteromodal cortical and other brain regions. The auditory oddball fMRI probe is thus attractive as a general activator of a widespread network, requiring little effort from schizophrenia patients, whose task performance accuracy is generally unimpaired, but where task-related activation is abnormal.33 Thus, the task is now well explored in patients (and their relatives) as a putative biological marker and endophenotype.11,12
In addition to dynamic techniques such as ERP and fMRI, MRI-derived structural endophenotypes have also been studied. While several reviews have been optimistic, e.g., Keshavan et al.,46 other recent publications have yielded disappointing results, e.g., Goldman et al.37 Thus, we focus here on functional MRI as an event-related methodology that can also provide information regarding functional connectivity among distant brain regions.
Our goal was to discover physiogenomic associations between genes related to dopamine and serotonin neurotransmission and fMRI of locations in temporal and frontal lobes previously associated with schizophrenia, 11,56 as a demonstration of the potential of our method to illuminate the genetic basis of this multigenic disease.
METHODS AND MATERIALS
Participants
Participants were recruited via advertisement, presentations at local universities and clinics and by word-of-mouth. A total of 99 participants, including 30 patients with schizophrenia, 13 unaffected first-degree relatives of patients with schizophrenia, and 56 healthy controls were involved. Prior to inclusion in the study, control participants were screened to ensure they were free from DSMIV Axis I or Axis II psychopathology (assessed using the SCID98) and also interviewed to determine that there was no history of major mental illness in any first-degree relatives. Patients met criteria for schizophrenia in the DSM-IV on the basis of a structured clinical interview28 and review of the case file. None of the subjects met criteria for alcohol/drug abuse or dependence. The study was approved by the Hartford Hospital IRB and all subjects gave written informed consent.
There was no significant between-group difference in age (controls, 47 ± 16 years, range 21–84; patients, 41 ± 10 years, range 20–55; relatives, 49 ± 19 years, range 20–87). There were 30 female and 26 male participants in the 56 healthy controls, 7 female and 23 male patients, and 5 female and 8 male relatives. A total of 80 subjects described themselves as Caucasian, 10 as African American, 4 as Hispanic, 2 as Asian, 2 as mixed, and 1 was unspecified. Full scale IQ scores for the groups evaluated from the National Adult Reading Test (NART)6,7 were 109.8 ± 7.5 for controls, 101.8 ± 11.3 for patients, and 100.9 ± 7.8 for relatives (only 45 controls, 27 patients, and 12 relatives had NART scores recorded).
fMRI Data Collection
The fMRI data were collected during performance of an auditory oddball task,48,49 which consists of detecting an infrequent sound within a series of frequent sounds. Auditory stimuli were presented to each participant by a computer stimulus presentation system via earphones. The standard stimulus was a 500-Hz tone, the target stimulus was a 1000-Hz tone, and the novel stimuli consisted of non-repeating random digital noises (e.g., tone sweeps, whistles). The full description of task design is available elsewhere.51 The participants were instructed to respond as quickly and accurately as possible with their right index finger every time they heard the target stimulus.
Scans were acquired at the Olin Neuropsychiatry Research Center at the Institute of Living on a Siemens Allegra 3T dedicated head MRI scanner equipped with 40mT/m gradients and a standard quadrature head coil. The functional scans were acquired using gradient-echo echo-planar-imaging with the following parameters: repeat time (TR) = 1.50 s, echo time (TE) = 27 ms, field of view = 24 cm, acquisition matrix = 64 × 64, flip angle = 70°, voxel size = 3.75 × 3.75 × 4 mm3, slice thickness = 4 mm, gap = 1 mm, 29 slices, ascending acquisition.
fMRI Data Preprocessing
Six “dummy” scans were performed at the beginning to allow for longitudinal equilibrium, after which the paradigm was automatically triggered to start by the scanner. Images were realigned using INRI-align —a motion correction algorithm unbiased by local signal changes.29 Data were preprocessed using the software package SPM2 (http://www.fil.ion.ucl.ac.uk/spm/). Data were spatially normalized into the standard Montreal Neurological Institute space,30 re-sliced to 3 mm3, and spatially smoothed with a 10 mm3 Gaussian kernel. Data for each participant were analyzed by a multiple regression incorporating regressors for the novel, target, and standard and their temporal derivatives plus an intercept term. The target- vs.- standard contrast images were used in this study.
We defined two large regions of interest based on previous findings of schizophrenia-related abnormalities in the frontal and temporal lobes.11,56 The regions were BA 10/46 in the lateral frontal lobe (dorsolateral prefrontal cortex), and superior and middle temporal gyri (STG/MTG) in the temporal lobe, as defined in the wfu_pickatlas toolbox (http://www.fmri.wfubmc.edu/).62 A voxel-wise two-sample t-test between patients and controls was performed on the target-related contrast images, and the voxel of highest discrimination between patients and controls (maximal voxel) was located in each region. Frontal and temporal endophenotype values were obtained by extracting the PSC for each patient from the respective maximal voxels. Figure 1 shows the location of the two regions and also indicates the maximal voxels which were used to generate the PSC phenotypes.
FIGURE 1.
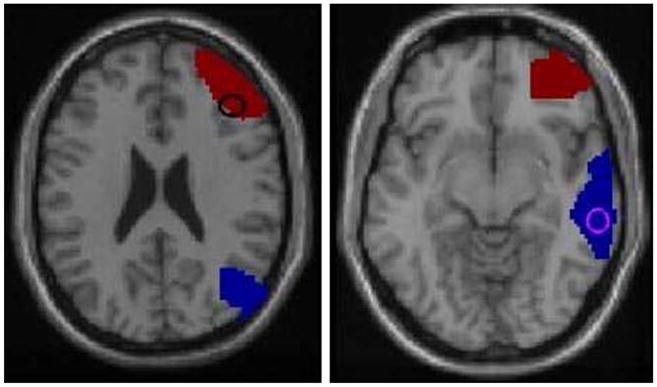
Location of the frontal and temporal lobe regions of interest. The red region in both images is BA 10/46 in the frontal lobe, the blue region is STG/MTG in the temporal lobe. The circles indicate points of maximum discrimination between patients and controls as indicated by the voxel-wise t-test.
Candidate Gene Selection
Table 1 shows the candidate genes selected for this study. The genes were selected from the PG Array, a SNP Array consisting of 384 SNPs from 222 genes that has been designed and tested at Genomas as a product85 and service. The array covers genes from a variety of metabolic processes and neurotransmitter axes. For this study, we focused on 16 genes related to dopaminergic and serotonergic neurotransmission, including dopamine beta-hydroxylase (DBH), dopamine receptors D1, D2, D3, D4, D5, dopamine transporter, 5a-hydroxytryptamine receptors 1A, 1D, 2A, 2C, 3A, 3B, 5A, 6, and 7 and the serotonin transporter solute carrier family 6 A4, which are represented on the array by 24 SNPs.
TABLE 1.
Genes and SNPs analyzed for associations with PSC in the frontal and temporal lobe regions of interest.
| Area | Pathway | SNP | Gene | Type |
|---|---|---|---|---|
| Dopamine system | Metabolism | rs4531 | DBH | exon 5, S304A |
| rs1611115 | DBH | ~1 kb upstream | ||
| Receptor | rs2298122 | DRD1IP | intron 1 | |
| rs1799978 | DRD2 | ~500 bp upstream | ||
| rs2471857 | DRD2 | intron 1 | ||
| rs167771 | DRD3 | intron 3 | ||
| rs167770 | DRD3 | intron 1 | ||
| rs9288993 | DRD3 | intron 3 | ||
| rs4987059 | DRD4 | ~800 bp upstream | ||
| rs2867383 | DRD5 | ~2.3 kb downstream | ||
| Transporter | rs3756450 | SLC6A3 | ~2.5 kb upstream | |
| Serotonin system | Receptor | rs676643 | HTR1D | ~200 bp upstream |
| rs659734 | HTR2A | intron | ||
| rs6312 | HTR2A | ~600 bp upstream | ||
| rs1150226 | HTR3A | ~500 bp upstream | ||
| rs3758987 | HTR3B | ~200 bp upstream | ||
| rs2276307 | HTR3B | intron 6 | ||
| rs1176744 | HTR3B | exon 5, S129Y | ||
| rs1440451 | HTR5A | intron 1 | ||
| rs9659997 | HTR6 | intron 1 | ||
| rs1935349 | HTR7 | intron 1 | ||
| rs1891311 | HTR7 | ~700 bp upstream | ||
| Transporter | rs140700 | SLC6A4 | intron 4 | |
| rs2020933 | SLC6A4 | intron 1 |
Laboratory Analysis
A blood sample was obtained for each subject and DNA extracted. Genotyping was performed using the Illumina BeadArray™ platformand the GoldenGate™ assay.25,76 Table 2 lists the assay information and observed allele frequencies for the SNPs used in this study.
TABLE 2.
Assay DNA sequences for the SNPs analyzed.
| Markers |
HapMap |
|||||||
|---|---|---|---|---|---|---|---|---|
| SNP | Gene | Chr | Maj | Min | Freq | Sequence | CEU | YRI |
| rs4531 | DBH | 9 | T | G | 0.06 | AGGACCCTGGACCCCCGAAGG[A/C]AAGGCCGGCTTCCTCTGGGT | NA | NA |
| rs1611115 | DBH | 9 | T | C | 0.17 | CTCTCCCTCCTGTCCTCTCCC[A/G]CAAGTAGACTGAGGGCAGCT | 0.17 | 0.12 |
| rs2298122 | DRD1IP | 10 | T | G | 0.23 | CTCCCCTCTCAGTTCAGGGCT[A/C]TCTTGGGTCCCTGCCAGCTG | 0.19 | 0.65 |
| rs1799978 | DRD2 | 11 | A | G | 0.11 | CCCAGCCTGCAATCACAGCTT[A/G]TTACTCTGGGTGTGGGTGGG | 0.03 | 0.13 |
| rs2471857 | DRD2 | 11 | A | G | 0.19 | CTTCCCAGTTGCACTAACAGA[A/G]CCTTTGATTCAGTTCAGCAA | 0.17 | 0.17 |
| rs167771 | DRD3 | 3 | A | G | 0.28 | TGCTCCAAAGTCTATCACAAT[A/G]ATCCTCTTTTCCATAAAGCC | 0.17 | 0.87 |
| rs167770 | DRD3 | 3 | A | G | 0.29 | TGGCTTCAGCTTGTAAAGCTT[A/G]GAAACATTCTGAAACAACAT | 0.29 | 0.72 |
| rs9288993 | DRD3 | 3 | A | G | 0.04 | GGCAGGTAATGATATTGTGAC[A/G]TGGAGAATGTGCACTTAGAA | 0.03 | 0.23 |
| rs4987059 | DRD4 | 11 | A | G | 0.04 | TTTGCAAGCACTTTCTCTTCT[A/G]CACGTTTGGAACCTACCCCG | NA | NA |
| rs2867383 | DRD5 | 4 | A | G | 0.28 | GCCTGTGGTCACAGAGCTCCT[A/G]AGTGGCAGAACTCAACTTGA | 0.33 | 0.50 |
| rs3756450 | SLC6A3 | 5 | T | C | 0.11 | CCTAAATGCCAAGTCGGCTTT[A/G]TTATCATTGTGGTTGCTGCT | 0.16 | 0.50 |
| rs676643 | HTR1D | 1 | A | G | 0.14 | AGGTTCATCTTGACGCATCCT[A/G]AGCTACTTAACTTCGGTTCC | 0.16 | 0.22 |
| rs659734 | HTR2A | 13 | T | C | 0.07 | CTGGTAGGAAATTGAACTGAA[A/G]TCATAAACGGAAAGCAGCTA | 0.07 | 0.17 |
| rs6312 | HTR2A | 13 | A | G | 0.06 | AACAAATGTATCTCATGTGTG[A/G]ACCCTGAAGACAAATGTAAG | 0.07 | 0.23 |
| rs1150226 | HTR3A | 11 | T | C | 0.15 | TTATGTCACCCTGGGGAGTAA[A/G]AGAATGGTCTTCCTGCTCCT | 0.07 | 0.37 |
| rs3758987 | HTR3B | 11 | A | G | 0.31 | ACAGCCTTTACCTAAGGCAGT[A/G]CTCTTGCTGACATTCAGGAC | 0.23 | 0.48 |
| rs2276307 | HTR3B | 11 | A | G | 0.16 | CCTTCTCTCTTGGGCCAAGGA[A/G]TTTCTGCTCTATTGCATGTT | 0.17 | 0.08 |
| rs1176744 | HTR3B | 11 | T | G | 0.34 | ATAGTGTGGACATTGAAAGAT[A/C]CCCTGACCTTCCCTATGTTT | 0.25 | 0.43 |
| rs1440451 | HTR5A | 7 | C | G | 0.04 | CTTGTTCATGATGAGATTATA[C/G]CTGATCTGACGTGAGAATGC | 0.01 | 0.54 |
| rs9659997 | HTR6 | 1 | T | C | 0.46 | ACAAATGCTCTGAGTCACCAC[A/G]CTGCGGCTCAGATGCTATGA | 0.41 | 0.57 |
| rs1935349 | HTR7 | 10 | A | G | 0.17 | TTATAGATTGTCCAGACATGA[A/G]CAGATCTATCACCTGACCAC | 0.12 | 0.50 |
| rs1891311 | HTR7 | 10 | A | G | 0.07 | AATGACCGGTTATACTCTTCT[A/G]TAAAGGAATCCTGGAGGTGT | 0.10 | 0.30 |
| rs140700 | SLC6A4 | 17 | A | G | 0.09 | ATCTTTCTGCCACACCACCTC[A/G]CCCTCCTTTCTCAAGGTCTT | 0.10 | 0.04 |
| rs2020933 | SLC6A4 | 17 | A | T | 0.16 | TTTTGTCCAGAAAAGTGAACC[A/T]GGTCAATGGATTATTTATGA | 0.05 | 0.39 |
Also shown are chromosome location of the gene (Chr), sequence of the most common allele (major, Maj), sequence of the least common allele (minor, Min), and frequency of the minor allele in the study population (Freq), and in two HapMap populations (CEU, YRI).41 (NA, not available).
Data Analysis
Statistical analysis utilized the R Statistics Language and Environment.21,27,61,81 Covariates gender, race, age, and group (affected, relative, and unaffected) were analyzed using multiple linear regression, and selected using the stepwise procedure. To test for association with SNPs, a linear regression of the covariate-adjusted residual of the PSC phenotypes was performed. SNP genotype was coded numerically according to carrier status for the minor allele: 0 for non-carriers, 1 for single carriers, and 2 for double carriers. The F-statistic p-value for the SNP variable from the analysis of variance (ANOVA) was used to evaluate the significance of association. To test the validity of the ANOVA p-values, we also performed an independent calculation of the p-values using permutation testing. The ranking of the first three SNPs was identical under permutation and ANOVA analyses (data not shown). To account for the multiple testing of 24 SNPs, we calculated adjusted p-values using Benjamini and Hochberg’s false discovery rate (FDR) procedure.4,5,83
LOESS Representation
To represent the variation in SNP frequency with the response, we used a locally smoothed function of the SNP frequency as it varies with PSC to visually represent the nature of an association. LOcally wEighted Scatterplot Smooth (LOESS) is a method to smooth data using a locally weighted linear regression.17,18,89 At each point in the LOESS curve, a quadratic polynomial is fitted to the data in the vicinity of that point. The data are weighted such that they contribute less if they are further away, according to the tricubic function
where x is the abscissa of the point to be estimated, the xi are the data points in the vicinity, and d(x) is the maximum distance of x to the xi.
RESULTS
Figure 2 depicts the distribution among participants of the percent signal change (PSC) in the frontal and temporal lobe areas. These distributions are approximately normal. Subset distributions are shown for the affected, relative, and unaffected groups. The PSC in both areas are markedly lower in affected vs. unaffected and related subjects. We tested the potential covariates of age, gender, race and group for association with PSC using multiple linear regression. The group variable was strongly associated with PSC both in the temporal (p<0.001, R2 = 18%) and frontal (p<10−5, R2 = 27%) lobe areas. Only one other marginally significant covariate association was found: In the temporal area, male gender was found to be weakly associated with increased PSC (p = 0.04, R2 < 3%). Both of these covariates were adjusted for in the SNP association testing.
FIGURE 2.

Distribution of frontal and temporal lobe PSC for the study group. The vertical axis indicates the number (No.) of subjects observed within a given PSC interval on the horizontal axis.
Table 3 lists the results of the association tests for the frontal and temporal areas. We found that SNPs in DBH (rs4531) and DRD4 (rs4987059) were significantly associated with the PSC in the temporal and frontal areas, respectively. We also found that SNP rs1150226 in HTR3A was significantly associated with the PSC in the temporal area. All remaining genes showed no significant association in either area, and no gene showed significant associations in both.
TABLE 3.
Significance levels of gene SNPs associated with fMRI activity.
| Markers |
p-Values |
SNP |
||||
|---|---|---|---|---|---|---|
| SNP | Gene | Frontal | Temporal | Freq | n | Type |
| rs4531 | DBH | 0.9207 | 0.0188 | 0.06 | 98 | Dopamine beta-hydroxylase (dopamine beta-monooxygenase) |
| rs1611115 | DBH | 0.1008 | 0.2357 | 0.17 | 93 | Dopamine beta-hydroxylase (dopamine beta-monooxygenase) |
| rs2298122 | DRD1IP | 0.6815 | 0.4816 | 0.23 | 96 | Dopamine receptor D1 interacting protein |
| rs1799978 | DRD2 | 0.2300 | 0.5440 | 0.11 | 97 | Dopamine receptor D2 |
| rs2471857 | DRD2 | 0.6141 | 0.4685 | 0.19 | 98 | Dopamine receptor D2 |
| rs167771 | DRD3 | 0.4777 | 0.3505 | 0.28 | 98 | Dopamine receptor D3 |
| rs167770 | DRD3 | 0.2801 | 0.5489 | 0.29 | 98 | Dopamine receptor D3 |
| rs9288993 | DRD3 | 0.5362 | 0.7589 | 0.04 | 98 | Dopamine receptor D3 |
| rs4987059 | DRD4 | 0.0085 | 0.8205 | 0.04 | 97 | Dopamine receptor D4 |
| rs2867383 | DRD5 | 0.6244 | 0.5440 | 0.28 | 93 | Dopamine receptor D5 |
| rs3756450 | SLC6A3 | 0.4102 | 0.5611 | 0.11 | 95 | Solute carrier family 6 (neurotransmitter transporter, dopamine), member 3 |
| rs676643 | HTR1D | 0.6800 | 0.7158 | 0.14 | 98 | 5-hydroxytryptamine (serotonin) receptor 1D |
| rs659734 | HTR2A | 0.4162 | 0.6008 | 0.07 | 98 | 5-hydroxytryptamine (serotonin) receptor 2A |
| rs6312 | HTR2A | 0.3919 | 0.3409 | 0.06 | 97 | 5-hydroxytryptamine (serotonin) receptor 2A |
| rs1150226 | HTR3A | 0.4706 | 0.0307 | 0.15 | 98 | 5-hydroxytryptamine (serotonin) receptor 3A |
| rs3758987 | HTR3B | 0.7606 | 0.7114 | 0.31 | 97 | 5-hydroxytryptamine (serotonin) receptor 3B |
| rs2276307 | HTR3B | 0.8560 | 0.1839 | 0.16 | 98 | 5-hydroxytryptamine (serotonin) receptor 3B |
| rs1176744 | HTR3B | 0.4477 | 0.7495 | 0.34 | 94 | 5-hydroxytryptamine (serotonin) receptor 3B |
| rs1440451 | HTR5A | 0.5304 | 0.2397 | 0.04 | 97 | 5-hydroxytryptamine (serotonin) receptor 5A |
| rs9659997 | HTR6 | 0.6010 | 0.5783 | 0.46 | 98 | 5-hydroxytryptamine (serotonin) receptor 6 |
| rs1935349 | HTR7 | 0.3280 | 0.8064 | 0.17 | 97 | 5-hydroxytryptamine (serotonin) receptor 7 (adenylate cyclase-coupled) |
| rs1891311 | HTR7 | 0.7008 | 0.4963 | 0.07 | 98 | 5-hydroxytryptamine (serotonin) receptor 7 (adenylate cyclase-coupled) |
| rs140700 | SLC6A4 | 0.3058 | 0.6948 | 0.09 | 98 | Solute carrier family 6 (neurotransmitter transporter, serotonin), member 4 |
| rs2020933 | SLC6A4 | 0.4378 | 0.4880 | 0.16 | 98 | Solute carrier family 6 (neurotransmitter transporter, serotonin), member 4 |
Significant p-values (<0.05) are indicated in bold.
Figure 3 shows detailed representations of the physiogenomic analysis for the three significant physiogenomic associations (p<0.05) found for DBH, DRD4, and HTR3A. The overall distribution of PSC is shown along with the individual genotypes and a LOESS fit of the allele frequency as a function of PSC. The bell curve shows the actual distribution of the phenotype in the study population. The circles show the genotype of each subject, with the non-carriers of the minor allele at the bottom, the single-carriers in the middle, and the double-carriers at the top. The position of the circle along the abscissa indicates the PSC observed in a specific participant. The LOESS curve shows the localized frequency of the least common allele for sectors of the distribution. For SNPs with a strong association, the marker frequency will be significantly different between the high and low ends of the distribution. For example, the first panel in Fig. 3 shows the LOESS curve for SNP rs4531 of the DBH gene. The frequency of the minor allele is 5% in subjects with low PSC. In contrast, it is above 10% in subjects with high PSC, which are mostly unaffected by schizophrenia. This finding indicates a physiogenomic association between this SNP and PSC. As the frequency of the minor allele is higher in the high spectrum of PSC, correlated with absence of disease, DBH SNP rs4531 may be considered a potential protective marker for schizophrenia.
FIGURE 3.

Physiogenomic representation of significant physiogenomic associations. Individual subject genotypes (circles) of each SNP are overlaid on the distribution of PSC (thin line). Each circle represents a subject, with the horizontal axis specifying the local neuronal activity, and the vertical axis the carrier status for the minor allele: bottom, non-carriers; middle, single-carriers; top, double-carriers. A LOESS fit of the allele frequency (thick line) as a function of PSC is shown. The ordinate is labeled for the marker frequency (thick line) of the SNP denoted at the top of each panel. The ordinate scale is the same in all three panels. The ordinate scales for the genotypes (circles) and PSC distribution (thin line) are not shown. The abscissa is labeled for neuronal activity in each panel. The abscissa scale is the same in all three panels and applies identically to marker frequency, genotypes, and neuronal activity.
DISCUSSION
The finding that polymorphisms in the DBH and DRD4 genes are associated with schizophrenia-related fMRI phenotypes is consistent with the dopaminergic pathophysiology of the disease.57,60,99 The agreement between our physiogenomic association results and prior genetic studies of the disease validates the endophenotype approach integrating fMRI.
SNP rs4531 codes for an amino acid change (S304A) in exon 5 of the DBH gene. DBH catalyzes the oxidative hydroxylation of dopamine to norepinephrine.52 Plasma DBH activity is highly heritable.103 Polymorphisms in the DBH gene may modulate psychotic symptoms, schizophrenia risk,20,111 and paranoid behaviors.45
SNP rs4987059 is non-coding and is located in the promoter region of the DRD4 gene, a region previously associated with schizophrenia.70 D4dopamine receptors are members of the D2-like dopamine receptor family. Immunologic assays show significant densities of D4 receptors in prefrontal cortex, thalamus, hippocampus, amygdala, and globus pallidus.26,70,74,104,105
SNP rs1150226 is non-coding and is located in the promoter region of the HTR3A gene. The 5-HT3 receptor is a pentameric ligand-gated cation channel located in CNS regions integrating reward and anxiety control as well as emetic and pain processing.24 The physiological role of 5-HT3 receptors encompasses responses to serotonin, dopamine, glutamate, GABA, and substance P. The novel physiogenomic association of HTR3A found here is thus plausible.
The value of the physiogenomic associations to fMRI activity elicited by the auditory oddball stimulus in the temporal and frontal lobes is that these responses themselves are abnormal in many patients with schizophrenia, thus constituting a biomarker for the disorder. The chasm from gene to disease phenotype is thus effectively bridged by fMRI. The brain’s response to task performance in healthy controls activates multiple regions, which evidence deficient activity in patients with schizophrenia.10,50 The advantages of the auditory oddball task include its well-replicated status, ease of translation from the electrophysiological to the fMRI realm, and comparably accurate performance of the task by affected and unaffected subjects. Once the physiogenomic associations to disease are validated clinically, there would not be a need to perform fMRI in response to the oddball stimulus on each individual patient. The fMRI can be superseded in routine clinical practice, but its predictive value retained by means of physiogenomics. The predictive genotypes can then be used in clinical practice without the need to gather fMRI data on patients. The ultimate diagnostic and operational advantage of robust physiogenomic associations but-tressed by an endophenotype is the direct translation of clinical information from DNA to patient management.
This study has various limitations. Due to the modest sample size, none of the associations we observed passes the p<0.05 significance criterion when adjusted for multiple SNP comparisons, either by Bonferroni correction or by FDR.4,5,83 We applied physiogenomics to a phenotype determined by fMRI and computational analysis of only two localized brain regions in frontal and temporal lobes, and only using one particular task. The true promise of endophenotypes for genetic association can only be realized when multiple different endophenotypes are analyzed and the results integrated into a coherent picture of genetic determinants and the pathways leading to their clinical manifestations. Even though we were primarily interested in a particular endophenotype and its genetic underpinnings, future studies should include more detailed clinical data, such as presence or absence of auditory hallucinations. Our recruitment of affected, related, and normal individuals with regard to schizophrenia diagnosis created a cohort with variable responses to the oddball acoustic stimulus. However, the performance of the unaffected relatives resembled that of the healthy controls more than that of the affected individuals, which we attribute to more parents than siblings being recruited to the cohort of related individuals. In the near term, we plan to extend the physiogenomic analysis to case vs. control comparisons using total genome arrays and whole brain scans to approach fMRI endophenotypes from a hypothesis-free perspective.
We had priorly demonstrated the applicability of physiogenomics in human responses to drugs, diet, and exercise.86–90 Physiogenomics has also been successfully applied in rodent animal models by others.63 Here we demonstrated that physiogenomics also applies to sensorial stimuli, specifically acoustic patterns, as exemplified by the oddball task. Consistent with a targeted, hypothesis-driven query, we compared genes involved in dopaminergic and serotonergic neurotransmitter systems and determined a high level of association to DBH and DRD4, which is supported by prior pathophysiological and genetic associations to schizophrenia and uncovered a new association to HTR3A. The results demonstrate the advantage of neuroimaging analysis to discover physiogenomic associations. We believe the interplay of fMRI and physiogenomics opens new vistas for biomedical engineering approaches in neuroscience.
Acknowledgments
This work was supported in part by grants from the National Institutes of Health, under RO1 grants MH60504, MH43775, MH52886, EB000840, EB005846, and an NIMH MERIT award (to GP), as well as SBIR R43 grant MH075481 (to GR).
Footnotes
FINANCIAL DISCLOSURES
Dr. Windemuth, Dr. Ruaño, and Mr. Kocherla report financial interest in Genomas Inc. in the form of salary, stock, and stock options. Dr. Calhoun and Dr. Pearlson report no financial interests in companies or potential conflicts of interest.
References
- 1.Assaf M, Rivkin PR, Kuzu CH, Calhoun VD, Kraut MA, Groth KM, et al. Abnormal object recall and anterior cingulate overactivation correlate with formal thought disorder in schizophrenia. Biol Psychiatry. 2006;59:452–459. doi: 10.1016/j.biopsych.2005.07.039. [DOI] [PubMed] [Google Scholar]
- 2.Bath KG, Lee FS. Variant BDNF (Val66Met) impact on brain structure and function. Cogn Affect Behav Neurosci. 2006;6:79–85. doi: 10.3758/cabn.6.1.79. [DOI] [PubMed] [Google Scholar]
- 3.Beasley CL, Pennington K, Behan A, Wait R, Dunn MJ, Cotter D. Proteomic analysis of the anterior cingulate cortex in the major psychiatric disorders: evidence for disease-associated changes. Proteomics. 2006;6:3414– 3425. doi: 10.1002/pmic.200500069. [DOI] [PubMed] [Google Scholar]
- 4.Benjamini Y, Hochberg Y. Controlling the false discovery rate: a practical and powerful approach to multiple testing. J Roy Stat Soc Ser B. 1995;57:289–300. [Google Scholar]
- 5.Benjamini Y, Hochberg Y. On the adaptive control of the false discovery rate in multiple testing with independent statistics. J Edu Behav Stat. 2000;25:60–83. [Google Scholar]
- 6.Blair J, Spreen O. New Adult Reading Test —Revised Manual. VIC., Canada: University of Victoria; 1989. [Google Scholar]
- 7.Blair J, Spreen O. Predicting premorbid IQ: a revision of the National Adult Reading Test. Clin Neuropsychol. 1989;3:129–136. [Google Scholar]
- 8.Brahmbhatt SB, Haut K, Csernansky JG, Barch DM. Neural correlates of verbal and nonverbal working memory deficits in individuals with schizophrenia and their high-risk siblings. Schizophr Res. 2006;87:191–204. doi: 10.1016/j.schres.2006.05.019. [DOI] [PubMed] [Google Scholar]
- 9.Braver TS, Barch DM, Gray JR, Molfese DL, Snyder A. Anterior cingulate cortex and response conflict: effects of frequency, inhibition and errors. Cereb Cortex. 2001;11:825–836. doi: 10.1093/cercor/11.9.825. [DOI] [PubMed] [Google Scholar]
- 10.Calhoun VD, Adali T, Kiehl KA, Astur R, Pekar JJ, Pearlson GD. A method for multitask fMRI data fusion applied to schizophrenia. Hum Brain Mapp. 2006;27:598–610. doi: 10.1002/hbm.20204. [DOI] [PMC free article] [PubMed] [Google Scholar]
- 11.Calhoun VD, Kiehl KA, Liddle PF, Pearlson GD. Aberrant localization of synchronous hemodynamic activity in auditory cortex reliably characterizes schizophrenia. Biol Psychiatry. 2004;55:842–849. doi: 10.1016/j.biopsych.2004.01.011. [DOI] [PMC free article] [PubMed] [Google Scholar]
- 12.Calhoun VD, Maciejewski PK, Pearlson GD, Kiehl KA. Temporal lobe and “default” hemodynamic brain modes discriminate between schizophrenia and bipolar disorder. Hum Brain Mapp. 2007 doi: 10.1002/hbm.20463. [Epub ahead of print] [DOI] [PMC free article] [PubMed] [Google Scholar]
- 13.Callicott JH. An expanded role for functional neuroimaging in schizophrenia. Curr Opin Neurobiol. 2003;13:256– 260. doi: 10.1016/s0959-4388(03)00041-2. [DOI] [PubMed] [Google Scholar]
- 14.Cardon LR, Bell JI. Association study designs for complex diseases. Nat Rev Genet. 2001;2:91–99. doi: 10.1038/35052543. [DOI] [PubMed] [Google Scholar]
- 15.Casey BJ, Forman SD, Franzen P, Berkowitz A, Braver TS, Nystrom LE, et al. Sensitivity of prefrontal cortex to changes in target probability: a functional MRI study. Hum Brain Mapp. 2001;13:26–33. doi: 10.1002/hbm.1022. [DOI] [PMC free article] [PubMed] [Google Scholar]
- 16.Clark D, Dedova I, Cordwell S, Matsumoto I. A proteome analysis of the anterior cingulate cortex gray matter in schizophrenia. Mol Psychiatry. 2006;11:459–470. 423. doi: 10.1038/sj.mp.4001806. [DOI] [PubMed] [Google Scholar]
- 17.Cleveland WS. Robust locally weighted regression and smoothing scatterplots. J Am Stat Assoc. 1979;74:829–836. [Google Scholar]
- 18.Cleveland WS, Devlin SJ. Locally weighted regression: an approach to regression analysis by local fitting. J Am Stat Assoc. 1988;83:596–610. [Google Scholar]
- 19.Colhoun HM, McKeigue PM, Davey SG. Problems of reporting genetic associations with complex outcomes. Lancet. 2003;361:865–872. doi: 10.1016/s0140-6736(03)12715-8. [DOI] [PubMed] [Google Scholar]
- 20.Cubells JF, Zabetian CP. Human genetics of plasma dopamine beta-hydroxylase activity: applications to research in psychiatry and neurology. Psychopharmacology (Berl) 2004;174:463–476. doi: 10.1007/s00213-004-1840-8. [DOI] [PubMed] [Google Scholar]
- 21.Dalgaard P. Introductory Statistics with R. New York: Springer; 2002. [Google Scholar]
- 22.Detera-Wadleigh SD, McMahon FJ. G72/G30 in schizophrenia and bipolar disorder: review and meta-analysis. Biol Psychiatry. 2006;60:106–114. doi: 10.1016/j.biopsych.2006.01.019. [DOI] [PubMed] [Google Scholar]
- 23.Dupuis J, O’Donnell CJ. Interpreting results of large-scale genetic association studies: separating gold from fool’s gold. JAMA. 2007;297:529–531. doi: 10.1001/jama.297.5.529. [DOI] [PubMed] [Google Scholar]
- 24.Faerber L, Drechsler S, Ladenburger S, Gschaidmeier H, Fischer W. The neuronal 5-HT3 receptor network after 20 years of research-evolving concepts in management of pain and inflammation. Eur J Pharmacol. 2007;560:1–8. doi: 10.1016/j.ejphar.2007.01.028. [DOI] [PubMed] [Google Scholar]
- 25.Fan JB, Oliphant A, Shen R, Kermani BG, Garcia F, Gunderson KL, et al. Highly parallel SNP genotyping. Cold Spring Harb Symp Quant Biol. 2003;68:69– 78. doi: 10.1101/sqb.2003.68.69. [DOI] [PubMed] [Google Scholar]
- 26.Fanous AH, Neale MC, Straub RE, Webb BT, O’Neill AF, Walsh D, et al. Clinical features of psychotic disorders and polymorphisms in HT2A, DRD2, DRD4, SLC6A3 (DAT1), and BDNF: a family based association study. Am J Med Genet B Neuropsychiatr Genet. 2004;125:69–78. doi: 10.1002/ajmg.b.20103. [DOI] [PubMed] [Google Scholar]
- 27.Faraway JJ. Linear Models with R. Boca Raton, FL: Chapman & Hall/CRC; 2004. [Google Scholar]
- 28.First MB, Spitzer RL, Gibbonilliams B. Structured Clinical Interview for DSM-IV Axis I Disorders: Patient Edition (SCID-I/P, Version 2.0) New York: Biometrics Research Department, New York State Psychiatric Institute; 1995. [Google Scholar]
- 29.Freire L, Mangin JF. Motion correction algorithms may create spurious brain activations in the absence of subject motion. Neuroimage. 2001;14:709–722. doi: 10.1006/nimg.2001.0869. [DOI] [PubMed] [Google Scholar]
- 30.Friston JA. Spatial registration and normalization of images. Human Brain Mapp. 1995;3:165–189. [Google Scholar]
- 31.Gallinat J, Heinz A. Combination of multimodal imaging and molecular genetic information to investigate complex psychiatric disorders. Pharmacopsychiatry. 2006;31(Suppl 1):S76–S79. doi: 10.1055/s-2006-931500. [DOI] [PubMed] [Google Scholar]
- 32.Gambaro G, Anglani F, D’Angelo A. Association studies of genetic polymorphisms and complex disease. Lancet. 2000;355:308–311. doi: 10.1016/s0140-6736(99)07202-5. [DOI] [PubMed] [Google Scholar]
- 33.Garrity AG, Pearlson GD, McKiernan K, Lloyd D, Kiehl KA, Calhoun VD. Aberrant “default mode” functional connectivity in schizophrenia. Am J Psychiatry. 2007;164:450–457. doi: 10.1176/ajp.2007.164.3.450. [DOI] [PubMed] [Google Scholar]
- 34.Glahn DC, Bearden CE, Niendam TA, Escamilla MA. The feasibility of neuropsychological endophenotypes in the search for genes associated with bipolar affective disorder. Bipolar Disord. 2004;6:171–182. doi: 10.1111/j.1399-5618.2004.00113.x. [DOI] [PubMed] [Google Scholar]
- 35.Glahn DC, Therman S, Manninen M, Huttunen M, Kaprio J, Lonnqvist J, et al. Spatial working memory as an endophenotype for schizophrenia. Biol Psychiatry. 2003;53:624–626. doi: 10.1016/s0006-3223(02)01641-4. [DOI] [PubMed] [Google Scholar]
- 36.Goldberg TE, Straub RE, Callicott JH, Hariri A, Mattay VS, Bigelow L, et al. The G72/G30 gene complex and cognitive abnormalities in schizophrenia. Neuropsychopharmacology. 2006;31:2022–2032. doi: 10.1038/sj.npp.1301049. [DOI] [PubMed] [Google Scholar]
- 37.Goldman AL, Pezawas L, Mattay VS, Fischl B, Verchinski BA, Zoltick B, et al. Heritability of brain morphology related to schizophrenia: a large-scale automated magnetic resonance imaging segmentation study. Biol Psychiatry. 2007;11:459–470. doi: 10.1016/j.biopsych.2007.06.006. Physiogenomic Analysis of fMRI in Schizophrenia 885. [DOI] [PubMed] [Google Scholar]
- 38.Guidotti A, Auta J, Davis JM, Dong E, Grayson DR, Veldic M, et al. GABAergic dysfunction in schizophrenia: new treatment strategies on the horizon. Psychopharmacology (Berl) 2005;180:191–205. doi: 10.1007/s00213-005-2212-8. [DOI] [PubMed] [Google Scholar]
- 39.Hariri AR, Weinberger DR. Imaging genomics. Br Med Bull. 2003;65:259–270. doi: 10.1093/bmb/65.1.259. [DOI] [PubMed] [Google Scholar]
- 40.Harrison PJ, Weinberger DR. Schizophrenia genes, gene expression, and neuropathology: on the matter of their convergence. Mol Psychiatry. 2005;10:40–68. doi: 10.1038/sj.mp.4001558. [DOI] [PubMed] [Google Scholar]
- 41.Ho BC, Milev P, O’Leary DS, Librant A, Andreasen NC, Wassink TH. Cognitive and magnetic resonance imaging brain morphometric correlates of brain-derived neurotrophic factor Val66Met gene polymorphism in patients with schizophrenia and healthy volunteers. Arch Gen Psychiatry. 2006;63:731–740. doi: 10.1001/archpsyc.63.7.731. [DOI] [PMC free article] [PubMed] [Google Scholar]
- 42.Ho BC, Wassink TH, O’Leary DS, Sheffield VC, Andreasen NC. Catechol-O-methyl transferase Val158Met gene polymorphism in schizophrenia: working memory, frontal lobe MRI morphology and frontal cerebral blood flow. Mol Psychiatry. 2005;10:229, 287–229, 298. doi: 10.1038/sj.mp.4001616. [DOI] [PubMed] [Google Scholar]
- 43.Holford TR, Windemuth A, Ruano G. Designing physiogenomic studies. Pharmacogenomics. 2006;7:157–158. doi: 10.2217/14622416.7.2.157. [DOI] [PubMed] [Google Scholar]
- 44.Johnson MR, Morris NA, Astur RS, Calhoun VD, Mathalon DH, Kiehl KA, et al. A functional magnetic resonance imaging study of working memory abnormalities in schizophrenia. Biol Psychiatry. 2006;60:11–21. doi: 10.1016/j.biopsych.2005.11.012. [DOI] [PubMed] [Google Scholar]
- 45.Kalayasiri R, Sughondhabirom A, Gueorguieva R, Coric V, Lynch WJ, Lappalainen J, et al. Dopamine beta-hydroxylase gene (DbetaH)-1021C->T influences self-reported paranoia during cocaine self-administration. Biol Psychiatry. 2007;61:1310–1313. doi: 10.1016/j.biopsych.2006.08.012. [DOI] [PubMed] [Google Scholar]
- 46.Keshavan MS, Prasad KM, Pearlson G. Are brain structural abnormalities useful as endophenotypes in schizophrenia? Int Rev Psychiatry. 2007;19:397–406. doi: 10.1080/09540260701486233. [DOI] [PubMed] [Google Scholar]
- 47.Keshavan MS, Prasad KM, Pearlson G. Are brain structural abnormalities useful as endophenotypes in schizophrenia? Intl Psychiatr Rev. 2007;19:397–406. doi: 10.1080/09540260701486233. [DOI] [PubMed] [Google Scholar]
- 48.Kiehl KA, Liddle PF. An event-related functional magnetic resonance imaging study of an auditory oddball task in schizophrenia. Schizophr Res. 2001;48:159–171. doi: 10.1016/s0920-9964(00)00117-1. [DOI] [PubMed] [Google Scholar]
- 49.Kiehl KA, Liddle PF. Reproducibility of the hemodynamic response to auditory oddball stimuli: a six-week test–retest study. Hum Brain Mapp. 2003;18:42–52. doi: 10.1002/hbm.10074. [DOI] [PMC free article] [PubMed] [Google Scholar]
- 50.Kiehl KA, Stevens MC, Celone K, Kurtz M, Krystal JH. Abnormal hemodynamics in schizophrenia during an auditory oddball task. Biol Psychiatry. 2005;57:1029– 1040. doi: 10.1016/j.biopsych.2005.01.035. [DOI] [PMC free article] [PubMed] [Google Scholar]
- 51.Kiehl KA, Stevens MC, Laurens KR, Pearlson G, Calhoun VD, Liddle PF. An adaptive reflexive processing model of neurocognitive function: supporting evidence from a large scale (n = 100) fMRI study of an auditory oddball task. Neuroimage. 2005;25:899–915. doi: 10.1016/j.neuroimage.2004.12.035. [DOI] [PubMed] [Google Scholar]
- 52.Kim CH, Zabetian CP, Cubells JF, Cho S, Biaggioni I, Cohen BM, et al. Mutations in the dopamine beta-hydroxylase gene are associated with human norepinephrine deficiency. Am J Med Genet. 2002;108:140–147. [PubMed] [Google Scholar]
- 53.Lander ES, Linton LM, Birren B, Nusbaum C, Zody MC, Baldwin J, et al. Initial sequencing and analysis of the human genome. Nature. 2001;409:860–921. doi: 10.1038/35057062. [DOI] [PubMed] [Google Scholar]
- 54.Lee C, McGlashan TH, Woods SW. Prevention of schizophrenia: can it be achieved? CNS Drugs. 2005;19:193– 206. doi: 10.2165/00023210-200519030-00002. [DOI] [PubMed] [Google Scholar]
- 55.Lewis DA. GABAergic local circuit neurons and prefrontal cortical dysfunction in schizophrenia. Brain Res Brain Res Rev. 2000;31:270–276. doi: 10.1016/s0165-0173(99)00042-9. [DOI] [PubMed] [Google Scholar]
- 56.Liddle PF. Functional imaging-schizophrenia. Br Med Bull. 1996;52:486–494. doi: 10.1093/oxfordjournals.bmb.a011562. [DOI] [PubMed] [Google Scholar]
- 57.Lieberman JA, Sheitman BB, Kinon BJ. Neurochemical sensitization in the pathophysiology of schizophrenia: deficits and dysfunction in neuronal regulation and plasticity. Neuropsychopharmacology. 1997;17:205– 229. doi: 10.1016/S0893-133X(97)00045-6. [DOI] [PubMed] [Google Scholar]
- 58.Linden DE, Prvulovic D, Formisano E, Vollinger M, Zanella FE, Goebel R, et al. The functional neuroanatomy of target detection: an fMRI study of visual and auditory oddball tasks. Cereb Cortex. 1999;9:815–823. doi: 10.1093/cercor/9.8.815. [DOI] [PubMed] [Google Scholar]
- 59.Lo WS, Lau CF, Xuan Z, Chan CF, Feng GY, He L, et al. Association of SNPs and haplotypes in GABAA receptor beta2 gene with schizophrenia. Mol Psychiatry. 2004;9:603–608. doi: 10.1038/sj.mp.4001461. [DOI] [PubMed] [Google Scholar]
- 60.Losoncz MF, Davidson M, Davis KL. The dopamine hypothesis of schizophrenia. In: Eltzer HY, editor. Psychopharmacology: The Third Generation of Progress. New York: Raven Press; 1987. pp. 715–726. [Google Scholar]
- 61.Maindonald J, Braun J. Data Analysis and Graphics Using R. Cambridge: Cambridge University Press; 2003. [Google Scholar]
- 62.Maldjian JA, Laurienti PJ, Kraft RA, Burdette JH. An automated method for neuroanatomic and cytoarchitectonic atlas-based interrogation of fMRI data sets. Neuroimage. 2003;19:1233–1239. doi: 10.1016/s1053-8119(03)00169-1. [DOI] [PubMed] [Google Scholar]
- 63.Malek RL, Wang HY, Kwitek AE, Greene AS, Bhagabati N, Borchardt G, et al. Physiogenomic resources for rat models of heart, lung and blood disorders. Nat Genet. 2006;38:234–239. doi: 10.1038/ng1693. [DOI] [PubMed] [Google Scholar]
- 64.Marchini J, Cardon LR, Phillips MS, Donnelly P. The effects of human population structure on large genetic association studies. Nat Genet. 2004;36:512–517. doi: 10.1038/ng1337. [DOI] [PubMed] [Google Scholar]
- 65.McCarley RW, Shenton ME, O’Donnell BF, Faux SF, Kikinis R, Nestor PG, et al. Auditory P300 abnormalities and left posterior superior temporal gyrus volume reduction in schizophrenia. Arch Gen Psychiatry. 1993;50:190–197. doi: 10.1001/archpsyc.1993.01820150036003. [DOI] [PubMed] [Google Scholar]
- 66.McCarthy G, Luby M, Gore J, Goldman-Rakic P. Infrequent events transiently activate human prefrontal and parietal cortex as measured by functional MRI. J Neurophysiol. 1997;77:1630–1634. doi: 10.1152/jn.1997.77.3.1630. [DOI] [PubMed] [Google Scholar]
- 67.Menon V, Ford JM, Lim KO, Glover GH, Pfefferbaum A. Combined event-related fMRI and EEG evidence for temporal-parietal cortex activation during target detection. Neuroreport. 1997;8:3029–3037. doi: 10.1097/00001756-199709290-00007. [DOI] [PubMed] [Google Scholar]
- 68.Meyer-Lindenberg A, Poline JB, Kohn PD, Holt JL, Egan MF, Weinberger DR, et al. Evidence for abnormal cortical functional connectivity during working memory in schizophrenia. Am J Psychiatry. 2001;158:1809– 1817. doi: 10.1176/appi.ajp.158.11.1809. [DOI] [PubMed] [Google Scholar]
- 69.Meyer-Lindenberg A, Weinberger DR. Intermediate phenotypes and genetic mechanisms of psychiatric disorders. Nat Rev Neurosci. 2006;7:818–827. doi: 10.1038/nrn1993. [DOI] [PubMed] [Google Scholar]
- 70.Nakajima M, Hattori E, Yamada K, Iwayama Y, Toyota T, Iwata Y, et al. Association and synergistic interaction between promoter variants of the DRD4 gene in Japanese schizophrenics. J Hum Genet. 2007;52:86–91. doi: 10.1007/s10038-006-0084-3. [DOI] [PMC free article] [PubMed] [Google Scholar]
- 71.Numata S, Ueno S, Iga J, Yamauchi K, Hongwei S, Kinouchi S, et al. Interaction between catechol-O-methyl-transferase (COMT) Val108/158Met and brain-derived neurotrophic factor (BDNF) Val66Met polymorphisms in age at onset and clinical symptoms in schizophrenia. J Neural Transm. 2007;114:255–259. doi: 10.1007/s00702-006-0543-1. [DOI] [PubMed] [Google Scholar]
- 72.Numata S, Ueno S, Iga J, Yamauchi K, Hongwei S, Ohta K, et al. Brain-derived neurotrophic factor (BDNF) Val66Met polymorphism in schizophrenia is associated with age at onset and symptoms. Neurosci Lett. 2006;401:1–5. doi: 10.1016/j.neulet.2006.02.054. [DOI] [PubMed] [Google Scholar]
- 73.Nyholt DR. Genetic case–control association studies-correcting for multiple testing. Hum Genet. 2001;109:564–567. doi: 10.1007/s00439-001-0611-4. [DOI] [PubMed] [Google Scholar]
- 74.Oak JN, Oldenhof J, Van Tol HH. The dopamine D(4) receptor: one decade of research. Eur J Pharmacol. 2000;405:303–327. doi: 10.1016/s0014-2999(00)00562-8. [DOI] [PubMed] [Google Scholar]
- 75.Ohnishi T, Hashimoto R, Mori T, Nemoto K, Moriguchi Y, Iida H, et al. The association between the Val158Met polymorphism of the catechol-O-methyl transferase gene and morphological abnormalities of the brain in chronic schizophrenia. Brain. 2006;129:399–410. doi: 10.1093/brain/awh702. [DOI] [PubMed] [Google Scholar]
- 76.Oliphant A, Barker DL, Stuelpnagel JR, Chee MS. BeadArray technology: enabling an accurate, cost-effective approach to high-throughput genotyping. Bio-techniques. 2002;(Suppl):56–57. [PubMed] [Google Scholar]
- 77.Oliver Josephs RTKF. Event-related fMRI. Human Brain Mapp. 1997;5:243–248. doi: 10.1002/(SICI)1097-0193(1997)5:4<243::AID-HBM7>3.0.CO;2-3. [DOI] [PubMed] [Google Scholar]
- 78.Opitz B, Mecklinger A, Von Cramon DY, Kruggel F. Combining electrophysiological and hemodynamic measures of the auditory oddball. Psychophysiology. 1999;36:142–147. doi: 10.1017/s0048577299980848. [DOI] [PubMed] [Google Scholar]
- 79.Owen MJ, Craddock N, O’Donovan MC. Schizophrenia: genes at last? Trends Genet. 2005;21:518–525. doi: 10.1016/j.tig.2005.06.011. [DOI] [PubMed] [Google Scholar]
- 80.Pearlson GD, Calhoun V. Structural and functional magnetic resonance imaging in psychiatric disorders. Can J Psychiatry. 2007;52:158–166. doi: 10.1177/070674370705200304. [DOI] [PubMed] [Google Scholar]
- 81.R Core Development Team. A Language and Environment for Statistical Computing. Vienna, Austria: R Foundation for Statistical Computing; 2004. [Google Scholar]
- 82.Redden DT, Allison DB. Nonreplication in genetic association studies of obesity and diabetes research. J Nutr. 2003;133:3323–3326. doi: 10.1093/jn/133.11.3323. [DOI] [PubMed] [Google Scholar]
- 83.Reinere A, Yekutiele D, Benjamini Y. Identifying differentially expressed genes using false discovery rate controlling procedures. Bioinformatics. 2003;19:368–375. doi: 10.1093/bioinformatics/btf877. [DOI] [PubMed] [Google Scholar]
- 84.Rosen BR, Buckner RL, Dale AM. Event-related functional MRI: past, present, and future. Proc Natl Acad Sci USA. 1998;95:773–780. doi: 10.1073/pnas.95.3.773. [DOI] [PMC free article] [PubMed] [Google Scholar]
- 85.Ruano, G. Physiogenomic method for predicting clinical outcomes of treatments in patients. Patent, USPTO # 20060278241. 12-14-2006.
- 86.Ruano G, Goethe JW, Caley C, Woolley S, Holford TR, Kocherla M. Physiogenomic comparison of weight profiles of olanzapine- and risperidone-treated patients. Mol Psychiatry. 2007;12(5):474–482. doi: 10.1038/sj.mp.4001944. [DOI] [PubMed] [Google Scholar]
- 87.Ruano G, Seip RL, Windemuth A, Zollner S, Tsongalis GJ, Ordovas J, et al. Apolipoprotein A1 genotype affects the change in high density lipoprotein cholesterol subfractions with exercise training. Atherosclerosis. 2006;185:65–69. doi: 10.1016/j.atherosclerosis.2005.05.029. [DOI] [PubMed] [Google Scholar]
- 88.Ruano G, Thompson PD, Windemuth A, Smith A, Kocherla M, Holford TR, et al. Physiogenomic analysis links serum creatine kinase activities during statin therapy to vascular smooth muscle homeostasis. Pharmacogenomics. 2005;6:865–872. doi: 10.2217/14622416.6.8.865. [DOI] [PubMed] [Google Scholar]
- 89.Ruano G, Windemuth A, Holford T. Physiogenomics: integrating systems engineering and nanotechnology for personalized medicine. In: Bronzino JD, editor. The Biomedical Engineering Handbook. 3. CRC Press; 2005. pp. 28-1–28-9. [Google Scholar]
- 90.Ruano G, Windemuth A, Kocherla M, Holford T, Fernandez ML, Forsythe CE, et al. Physiogenomic analysis of weight loss induced by dietary carbohydrate restriction. Nutr Metab (Lond) 2006;3:20. doi: 10.1186/1743-7075-3-20. [DOI] [PMC free article] [PubMed] [Google Scholar]
- 91.Salanti G, Sanderson S, Higgins JP. Obstacles and opportunities in meta-analysis of genetic association studies. Genet Med. 2005;7:13–20. doi: 10.1097/01.gim.0000151839.12032.1a. [DOI] [PubMed] [Google Scholar]
- 92.Saltelli A, Chan K, Scott EM. Sensitivity Analysis. Chichester: John Wiley and Sons; 2000. [Google Scholar]
- 93.Saperstein AM, Fuller RL, Avila MT, Adami H, McMahon RP, Thaker GK, et al. Spatial working memory as a cognitive endophenotype of schizophrenia: assessing risk for pathophysiological dysfunction. Schizophr Bull. 2006;32:498–506. doi: 10.1093/schbul/sbj072. [DOI] [PMC free article] [PubMed] [Google Scholar]
- 94.Sarter M, Berntson GG, Cacioppo JT. Brain imaging and cognitive neuroscience. Toward strong inference in attributing function to structure. Am Psychol. 1996;51:13–21. doi: 10.1037//0003-066x.51.1.13. [DOI] [PubMed] [Google Scholar]
- 95.Schroder J, Buchsbaum MS, Siegel BV, Geider FJ, Lohr J, Tang C, et al. Cerebral metabolic activity correlates of subsyndromes in chronic schizophrenia. Schizophr Res. 1996;19:41–53. doi: 10.1016/0920-9964(95)00043-7. [DOI] [PubMed] [Google Scholar]
- 96.Sherry ST, Ward M, Sirotkin K. dbSNP-database for single nucleotide polymorphisms and other classes of minor genetic variation. Genome Res. 1999;9:677– 679. [PubMed] [Google Scholar]
- 97.Soares JC. Contributions from brain imaging to the elucidation of pathophysiology of bipolar disorder. Int J Neuropsychopharmacol. 2003;6:171–180. doi: 10.1017/S1461145703003390. [DOI] [PubMed] [Google Scholar]
- 98.Spitzer RL, Williams JB, Gibbon M. Structured Clinical Interview for DSM-IV: Non-patient Edition (SCID-NP) New York: Biometrics Research Department, New York State Psychiatric Institute; 1996. [Google Scholar]
- 99.Sternberg DE, VanKammen DP, Lerner P, Bunney WE. Schizophrenia: dopamine beta-hydroxylase activity and treatment response. Science. 1982;216:1423–1425. doi: 10.1126/science.6124036. [DOI] [PubMed] [Google Scholar]
- 100.Strange BA, Dolan RJ. Adaptive anterior hippocampal responses to oddball stimuli. Hippocampus. 2001;11:690–698. doi: 10.1002/hipo.1084. [DOI] [PubMed] [Google Scholar]
- 101.Sundgren PC, Dong Q, Gomez-Hassan D, Mukherji SK, Maly P, Welsh R. Diffusion tensor imaging of the brain: review of clinical applications. Neuroradiology. 2004;46:339–350. doi: 10.1007/s00234-003-1114-x. [DOI] [PubMed] [Google Scholar]
- 102.Tamminga CA, Holcomb HH. Phenotype of schizophrenia: a review and formulation. Mol Psychiatry. 2005;10:27–39. doi: 10.1038/sj.mp.4001563. [DOI] [PubMed] [Google Scholar]
- 103.Tang Y, Buxbaum SG, Waldman I, Anderson GM, Zabetian CP, Kohnke MD, et al. A single nucleotide polymorphism at DBH, possibly associated with attention- deficit/hyperactivity disorder, associates with lower plasma dopamine beta-hydroxylase activity and is in linkage disequilibrium with two putative functional single nucleotide polymorphisms. Biol Psychiatry. 2006;60:1034–1038. doi: 10.1016/j.biopsych.2006.02.017. [DOI] [PubMed] [Google Scholar]
- 104.Tarazi FI, Baldessarini RJ. Brain dopamine D(4) receptors: basic and clinical status. Int J Neuropsychopharmcol. 1999;2:41–58. doi: 10.1017/S1461145799001352. Physiogenomic Analysis of fMRI in Schizophrenia 887. [DOI] [PubMed] [Google Scholar]
- 105.Tarazi FI, Baldessarini RJ. Dopamine D4 receptors: significance for molecular psychiatry at the millennium. Mol Psychiatry. 1999;4:529–538. doi: 10.1038/sj.mp.4000674. [DOI] [PubMed] [Google Scholar]
- 106.Thaker GK. Defining the schizophrenia phenotype. Curr Psychiatry Rep. 2000;2:398–403. doi: 10.1007/s11920-000-0022-6. [DOI] [PubMed] [Google Scholar]
- 107.The International HapMap Consortium. A haplotype map of the human genome. Nature. 2005;437:1299–1320. doi: 10.1038/nature04226. [DOI] [PMC free article] [PubMed] [Google Scholar]
- 108.Thompson PM, Cannon TD, Narr KL, van Erp T, Poutanen VP, Huttunen M, et al. Genetic influences on brain structure. Nat Neurosci. 2001;4:1253–1258. doi: 10.1038/nn758. [DOI] [PubMed] [Google Scholar]
- 109.Vawter MP, Shannon WC, Ferran E, Matsumoto M, Overman K, Hyde TM, et al. Gene expression of metabolic enzymes and a protease inhibitor in the prefrontal cortex are decreased in schizophrenia. Neurochem Res. 2004;29:1245–1255. doi: 10.1023/b:nere.0000023611.99452.47. [DOI] [PubMed] [Google Scholar]
- 110.Waldemar G, Hogh P, Paulson OB. Functional brain imaging with single-photon emission computed tomography in the diagnosis of Alzheimer’s disease. Int Psychogeriatr. 1997;9(Suppl 1):223–227. doi: 10.1017/s1041610297004924. [DOI] [PubMed] [Google Scholar]
- 111.Yamamoto K, Cubells JF, Gelernter J, Benkelfat C, Lalonde P, Bloom D, et al. Dopamine beta-hydroxylase (DBH) gene and schizophrenia phenotypic variability: a genetic association study. Am J Med Genet B Neuropsychiatr Genet. 2003;117:33–38. doi: 10.1002/ajmg.b.10011. [DOI] [PubMed] [Google Scholar]
- 112.Yu Z, Chen J, Shi H, Stoeber G, Tsang SY, Xue H. Analysis of GABRB2 association with schizophrenia in German population with DNA sequencing and one-label extension method for SNP genotyping. Clin Biochem. 2006;39:210–218. doi: 10.1016/j.clinbiochem.2006.01.009. [DOI] [PubMed] [Google Scholar]