
Figure 7.
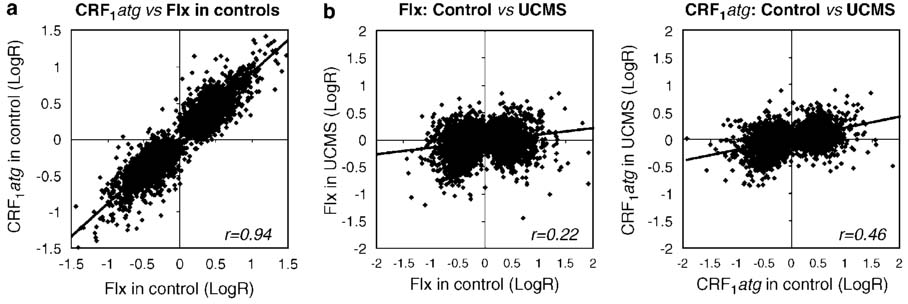
State-dependent effects of fluoxetine and SSR125543 treatments in CC. (a) Chronic drug treatments induced extensive and highly similar transcriptome changes in control non-stressed mice. In total, 3221 genes were significantly affected by fluoxetine and 3004 genes for fluoxetine or SSR125543 with ~60% of genes significantly affected by both treatments (see Supplementary Information). The correlation graph includes a total of 4305 antidepressant-affected genes (r=0.94, slope=0.90). (b) Lower correlations (r=0.22–0.46) and much reduced graph slopes (0.11–0.19) suggest that the same drug has different effects in control and UCMS-treated mice. x–y axes values are log2(UCMS antidepressant-treated/control) for the respective drug treatment; r, Pearson correlation coefficients; Flx, fluoxetine; CRF1atg, SSR125543.