

Abstract
The aminopeptidase from Aeromonas proteolytica (AAP) was titrated with copper, which bound sequentially at two distinct sites. Both the mono- and disubstituted forms of AAP exhibited catalytic hyperactivity relative to the native dizinc enzyme. Monosubstituted AAP exhibited an axial Cu(II) EPR spectrum with slight pH dependence: at pH 6.0 g|| =2.249, g⊥ = 2.055, and A||(63/65Cu) = 1.77 × 10⁻² cm−1, whereas at pH 9.65 g|| = 2.245, g⊥ = 2.056, and A||(63/65Cu) = 1.77 × 10⁻² cm−1. These data indicate oxygen and nitrogen ligation of Cu. AAP further substituted with copper exhibited a complex signal with features around g ~2 and 4. The features at g ~4 were relatively weak in the B0 ⊥ B1 (perpendicular) mode EPR spectrum but were intense in the B0 || B1 (parallel) mode spectrum. The g ~2 region of the perpendicular mode spectrum exhibited two components, one corresponding to mononuclear Cu(II) with g|| = 2.218, g⊥ = 2.023, and A||(63/65Cu) = 1.55 × 10⁻² cm−1 and likely due to adventitious binding of Cu(II) to a site distant from the active site. Excellent simulations were obtained for the second component of the spectrum assuming that two Cu(II) ions experience dipolar coupling corresponding to an inter-copper distance of 5 Å with the two Cu(II) gz directions parallel to each other and at an angle of ~17° to the inter-copper vector (ℋ= βB·gCuA·SCuA + βB·gCuB·SCuB + [S·A·I]CuA + [S·A·I]CuB + [SCuA·J·SCuB]; g||(CuA,CuB) = 2.218, g⊥(CuA,CuB) = 2.060; A||(CuA,CuB)(63/65Cu) = 1.59 × 10⁻² cm−1, Jisotropic = 50 cm−1, rCu–Cu = 4.93 Å, and χ=17°). The exchange coupling between the two copper ions was found to be ferromagnetic as the signals exhibited Curie law temperature dependence. The Cu–Cu distance of ~5 Å indicated by EPR was significantly higher than the inter-zinc distance of 3.5 Å in the native enzyme, and the dicopper species therefore represents a novel dinuclear site capable of catalysis of hydrolysis. In contrast to AAP, the related methionyl aminopeptidase from Escherichia coli (EcMetAP) was found to bind only one Cu(II) ion despite possessing a dinuclear binding site motif. A further difference was the marked pH dependence of the signal in EcMetAP, suggestive of a change in ligation. The structural motifs of these two Cu(II)-substituted aminopeptidases provide important insight into the observed catalytic activity.
Introduction
The leucine aminopeptidase from Aeromonas proteolytica (AAP) is a member of a class of metallohydrolases that requires two divalent metal ion cofactors for catalytic activity. This family of enzymes includes peptidases, nucleases, esterases, and phosphatases, which catalyze the degradation of many key biomolecules such as polypeptides, nucleic acids, antibiotics, and phospholipids.1–4 As a result, they play important roles in tissue repair, protein maturation, hormone level regulation, and cell-cycle control. The importance of understanding the mechanism of action of aminopeptidases is underscored by the recent observation that the naturally occurring peptide analogue inhibitor, bestatin, was shown to significantly decrease HIV viral load in men by inhibiting leucine aminopeptidase activity.5 Recently, the eukaryotic methionyl aminopeptidase (MetAP) was identified as the molecular target for the anti-angiogenesis drugs ovalicin and fumagillin.6–10 The inhibition of aminopeptidase activity in viruses and at malignant tumors is critically important in preventing the growth and proliferation of these types of cells and for this reason has become the subject of intense efforts in inhibitor design.
AAP has been one of the most intensively studied metalloaminopeptidases because it possesses ideal properties for probing hydrolytic reactions catalyzed by dinuclear metal centers. AAP is excreted extracellularly by the bacterium A. proteolytica and is readily purified as a remarkably thermostable 32 kDa monomer containing a (μ-aquo)(μ-carboxylato) dizinc-(II) core. The native Zn(II) ions can be replaced with other metal ions, some of which give highly active forms of the enzyme.11,12 The addition of 1 mol equiv of Co(II), Cu(II), or Ni(II) furnishes the monosubstituted enzyme forms ([Co_(AAP)], [Cu_(AAP)], and [Ni_(AAP)]) that, when compared to the native dizinc enzyme ([ZnZn(AAP)]), exhibit 5-, 10-, and 10-fold hyperactivity, respectively, with the substrate L-alanine-p-nitroanilide (Ala-p-NA). Further addition of divalent metal ions to form nominally disubstituted species [CoCo(AAP)], [CuCu(AAP)], and [NiNi-(AAP)] yields little further increase in activity, although electronic absorption spectrophotometry clearly indicates metal binding into a second site.11 However, addition of Zn(II) to the monosubstituted species furnishes the heterodimetallic species [CoZn(AAP)], [CuZn(AAP)], and [NiZn(AAP)], which are 3-, 40-, and 60-fold hyperactive, respectively. That the metal ions can be sequentially replaced to yield specific heterodimetallic forms of the enzyme has proved extremely useful in mechanistic studies probing the roles of the individual metal ions.13–16 The identity of the native metal ion in MetAPs is less clear, but the evidence is mounting toward MetAPs being Fe(II)-dependent metallohydrolases.17 Fully active forms of MetAP from Escherichia coli, EcMetAP, can be prepared that contain 1 M equiv of Co(II) or Fe(II), and partial activity (30%) can be obtained with 2 equiv of Mn(II). A second Co(II) or Fe(II) is only weakly bound and has no effect on activity; therefore, it appears that only the more tightly bound Co(II) or Fe(II), which binds to the only active site histidine residue, is required for catalysis.17 The addition of 1 or more equiv of either Cu(II), Zn(II), or Cd(II) to apo-EcMetAP provides inactive enzyme.
The mechanisms of action of the metalloaminopeptidases, particularly AAP and the related mammalian bovine lens leucine aminopeptidase, have become clearer in recent years with the application of structural10,15,16,18–25 and spectroscopic13,14,17,26–30 techniques in addition to kinetic studies.11,12,31–34 In AAP, inhibitor-binding studies15,23 indicate that the first binding metal ion is the hydrolytic ion, whereas a likely role of the second metal ion is to stabilize the transition state in catalysis. Electron paramagnetic resonance (EPR) and nuclear magnetic resonance (NMR) spectroscopic studies also indicate that the two metal ions, when paramagnetic, are spin-coupled and thus suggest a further role for the second metal ion in modulating the electronic properties of the first metal ion binding site.13,14,26,27 However, it is not clear from studies to date what the determinants of the catalytic properties of the metal ions are. Specifically, it is not clear whether geometry, Lewis acidity, or both are important for the activities of each metal ion.
The presence of a dinuclear metal binding motif in MetAPs is misleading. EcMetAP binds only one metal ion tightly, with binding constants of around 0.25 μM for Fe(II) and Co(II), while the binding constant for a second metal ion is >2 mM.17 Furthermore, the presence of a second equiv of Co or Fe has no effect on the kinetic parameters of the enzyme. Although the metal ions in [CoCo(EcMetAP)] have been shown to be bridged by a bis(μ-carboxylato)(μ-aquo/hydroxo) structure, only about 5% of the molecules exhibit spin–spin coupling of the Co(II) ions and then only at pH values >9.6 where the enzyme is inactive.18,35 Similarly, no spin–spin interaction in [FeFe(Met-AP)] could be detected by EPR spectroscopy. This is in marked contrast to the EPR-observable spin–spin coupling of the μ-carboxylato-μ-aquo/hydroxo-bridged Co(II) ions in [CoCo(AA-P)] and to the NMR-detected 50 cm−1 exchange interaction in [CuCu(AAP)].26,27 Thus, despite the close structural similarity of the metal-binding active sites in MetAPs and AAP, the electronic structures and catalytic properties of the sites differ markedly.
In an effort to gain insight into the structure and function of the Cu(II)-substituted AAP and EcMetAP enzymes, we have examined the electronic properties of these unusual hydrolytic centers by electronic absorption and EPR spectroscopies. To our knowledge, AAP is one of only a few Zn(II) enzymes that can be fully activated, let alone hyperactivated, by Cu(II). This unusual catalytic behavior has gone essentially unexplored. Cu(II) has many advantages as a structural probe: Cu(II) is a sensitive EPR probe and gives an EPR spectrum consisting of narrow, and therefore intense, lines. The distinctive I = 3/2 63/65Cu hyperfine splittings (hfs), which are sensitive to geometry and ligand atom types, are clearly resolved, and ligand super-hyperfine splittings (shfs) can also sometimes be observed. The EPR spectra of dinuclear copper systems are exquisitely sensitive to dipolar coupling and, thus, to the inter-copper distance, which can be directly determined through computer simulation of EPR spectra. While the spectra are relatively insensitive to the isotropic exchange coupling, the sign of the coupling can be inferred from the temperature dependence of the signals. The combination of the electronic and structural data presented herein provides important insight into the varying degrees of hyperactivity exhibited by the Cu(II)-substituted AAP species [Cu_(AAP)], [CuCu(AAP)], and [CuZn(AAP)], and comparison with [Cu_(MetAP)] provides evidence for geometry being an important determinant of Cu-catalyzed hydrolysis.
Materials and Methods
Protein Expression and Purification
All chemicals used were purchased commercially and were of the highest quality available. AAP was purified from a stock kindly provided by Prof. Céline Schalk. Cultures were grown according to published procedure36 with minor modifications to growth media as described earlier.37 The enzyme was purified, quantified, and assayed as described in detail in earlier work.13,26 Recombinant EcMetAP was expressed and purified as previously described from a stock culture kindly provided by Drs. Brian W. Matthews and W. Todd Lowther.9,38 Purified EcMetAP exhibited a single band on SDS–PAGE and a single symmetrical peak in matrix-assisted laser desorption ionization-time of flight (MALDI-TOF) mass spectrometric analysis indicating Mr = 29 630 ± 10. Protein concentrations were estimated from the absorbance at 280 nm using an extinction coefficient of 16 500 M−1 cm−1.9,38
Metal Substitution
EcMetAP was isolated as the apo-form of the enzyme. Apo-EcMetAP samples were exchanged into 25 mM Hepes, pH 7.5, containing 150 mM KCl (Centricon-10, Millipore Corp.). Apo-EcMetAP samples were incubated anaerobically with CuCl2 for 30 min as previously reported.38 AAP was rendered metal-free by exhaustive dialysis with 1,10-phenanthroline followed by dialysis against Chelex-treated buffer. Substitution of 0.5–1.0 mM samples of AAP with Cu(II) was affected by incubation with CuCl2.13
Spectroscopic Measurements
All electronic absorption spectra were recorded on a Hewlett-Packard 8453 spectrophotometer inside a Coy anaerobic chamber. Samples were placed in a 200-μL, 1-cm path-length microcuvette (QS, Hellma). The absorption spectra of apo-AAP and apo-EcMetAP were subtracted from the corresponding spectra of all metal-substituted samples using Igor Pro (v. 4, Wavemetrics, Inc.). Enzyme concentrations were typically 1 mM. EPR spectra were recorded using 100 kHz field modulation on a Bruker ESP-300E spectrometer equipped with an ER 4116 DM dual-mode X-band resonant cavity operating at either ~9.65 (B1 ⊥ B0) or ~9.40 GHz (B1 || B0). Spectra were recorded at between 4 and 70 K, using an Oxford Instruments ESR-900 helium flow cryostat, and aligned to a magnetic field corresponding to 9.6000 GHz for computer simulation. Spectra recorded at between 293 and 302 K were recorded either using the Bruker instrument configured as described but with no helium flow or else using a Varian E109E spectrometer equipped with a loop–gap resonator; for both spectrometers, samples were prepared in 0.6 mm i.d. glass capillaries (VitroCom, Mountain Lakes, NJ). To facilitate recording spectra in capillaries at both ambient and cryogenic temperatures using the ER 4116 DM cavity, capillaries were mounted inside 3 mm diameter EPR tubes. Ethanol surrounded the capillary to facilitate thermal contact between the sample and the outside of the 3-mm EPR tube during low temperature operation. Simulations of [CuCu(AAP)] were carried out using the program Xsophe (Bruker).39 Xsophe simulations were calculated using matrix diagonalization. The spin Hamiltonian used was ℋ = βB·gCuA·SCuA + βB·gCuB·SCuB + [S·A·I]CuA + [S·A·I]CuB + SCuA·J·SCuB, where CuA and CuB denote the two copper ions. Note that the term SCuA·J·SCuB contains both the isotropic (exchange, Jisotropic) and anisotropic (dipolar) spin–spin coupling components and is calculated from values of Jisotropic, the inter-copper distance (r), and the angles describing the relative orientations of the two g tensors and the inter-copper vector. g-Values obtained via computer simulations were estimated to be ±0.001 for mononuclear species and ±0.003 for dinuclear species. Hyperfine coupling constants were estimated to be ±1.5 × 10⁻⁴ cm−1 for mononuclear species and ±5 × 10⁻⁴ cm−1 for dinuclear species.
Results
Electronic Absorption Spectroscopy
Electronic absorption spectra of [Cu_(AAP)], [CuCu(AAP)], and [Cu_(EcMetAP)] were recorded in Hepes buffer, pH 7.5, and Ches buffer, pH 9.65, and the spectra of [CuCu(AAP)] and [Cu(EcMetAP)] at pH 7.5 are shown in Figure 1. The spectra of both [Cu_(AAP)] and [CuCu(AAP)] at pH 7.5 exhibited a band with λmax = 760 nm, while those of [Cu_(EcMetAP)] and EcMetAP to which 2 equiv of Cu were added exhibited a band at λmax = 560 nm. Adjusting the pH of [CuCu(AAP)] or [Cu_(EcMetAP)] to 9.65 resulted in only small shifts in λmax to 730 and 520 nm, respectively.
Figure 1.
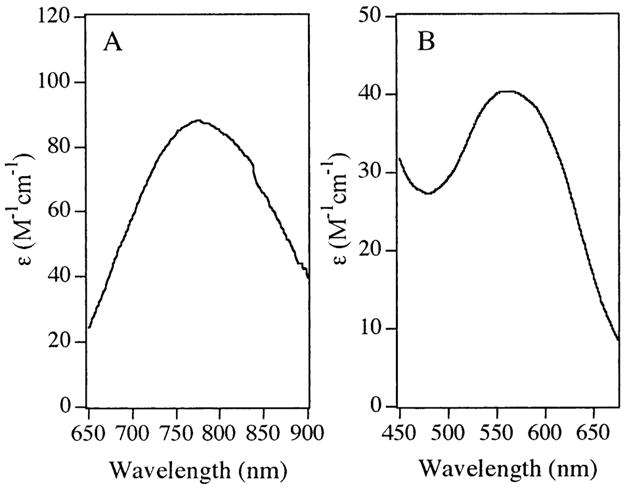
Electronic absorption spectra of (A) [CuCu(AAP)] and (B) [Cu_EcMetAP)] at pH 7.5.
EPR Studies on Cu(II)-Substituted AAP
Upon the addition of 1 equiv of Cu(II) to apo-AAP in 50 mM Mes buffer, pH 6.0, a species corresponding to a single Cu(II) ion was observed (Figure 2A).
Figure 2.

EPR signals from [Cu_(AAP)] and [Cu_(EcMetAP)]. (A) [Cu_(AAP)] at pH 6.0, (B) [Cu_(AAP)] at pH 9.65, (C) [Cu_(EcMetAP)] at pH 6.8, and (D) [Cu_(EcMetAP)] at pH 10.1. Spectra were recorded at 45 K, 2 mW microwave power, and 0.25 mT magnetic field modulation amplitude.
The spin Hamiltonian parameters g|| = 2.249 ± 0.001, g⊥ = 2.055 ± 0.001, and A|| (63/65Cu) = 1.77 × 10⁻² cm−1 ± 1.5 × 10⁻⁴ cm−1 were obtained by computer simulation (not shown). In Ches buffer, pH 9.65, [Cu_(AAP)] exhibited a spectrum (Figure 2B) consisting of a major component with g|| = 2.245 ± 0.001, g⊥ =2.056 ± 0.001, A|| (63/65Cu) = 1.77 × 10⁻² cm−1 ± 1.5 × 10⁻⁴ cm−1, and an uncharacterized minor component. The parameters of the major species are almost indistinguishable from those of the pH 6.0 spectrum, and the main difference in appearance between the spectra at pH 6.0 and that at pH 9.65 is entirely a consequence of narrower line widths of the high pH spectrum, in which the overshoot line is resolved.40
Upon the addition of 2 or more equiv of Cu(II) to apo-AAP, followed by dialysis, the observed EPR spectra changed dramatically (Figure 3). However, the resulting spectra at both pH 6.0 and pH 9.65 are clearly very similar to each other.
Figure 3.

EPR signals from [CuCu(AAP)]. The top two traces show the EPR spectra from [CuCu(AAP)] at pH 6.0, recorded with (A) B1 ⊥ B0 and (B) B1 || B0. The bottom two traces show the EPR spectra from [CuCu-(AAP)] at pH 9.65 recorded with (C) B1 ⊥ B0 and (D) B1 || B0. Traces E–H show high-resolution spectra of A–D, respectively, recorded over the field range indicated by the scales. Spectra A, B, E, and F were recorded at 45 K and 2 mW microwave power, and spectra C, D, G, and H were recorded at 4 K and 0.5 mW microwave power. Spectra A–D were recorded with 1.0 mT magnetic field modulation amplitude and spectra E–H with 0.25 mT magnetic field modulation amplitude. Spectra are shown with normalized intensities.
With B1 ⊥ B0, the spectra (Figure 3, traces A and C) show an intense signal in the g ~2 region attributed to a Cu–Cu dimer superimposed on a signal because of monomeric Cu. Close examination of the spectra in Figure 3, traces A and C also reveals a broad feature at 256 mT assigned to the g|| component of the signal because of the Cu–Cu dimer and avery weak half-field transition around 160 mT. The 160 mT features are shown expanded (Figure 3, traces E and G) and exhibit a well-resolved seven-line hfs pattern. The spectra recorded with B1 || B0 (Figure 3, traces B, D, F, and H) contain contributions from the same features observed with B1 ⊥ B0. However, with B1 || B0, the half-field features at 160 mT were 70 times more intense relative to the features at 298, 336, and 362 mT and, thus, confirm their assignment to an S = 1 system.41–44
The temperature dependencies of the signals were studied, and the data for the high pH B1 ⊥ B0 signal in the g ~2 region at 298 mT and for the B1 || B0 signal at 160 mT are presented in Figure 4. Both signals in their respective modes clearly exhibit good agreement with Curie law behavior. In addition, the forms of the signals were invariant in the range 4–45 K at nonsaturating power (note that the spectra of Figure 3, traces A and B were recorded at 45 K, whereas those of Figure 3, traces C and D were recorded at 4 K). Thus, each of the signals arises from a ground-state transition.
Figure 4.

Temperature dependence of EPR signals from [CuCu(AAP)]. The temperature dependencies of the feature at 298 mT in the B1 ⊥ B0 EPR spectrum (solid circles) and of the feature at 160 mT in the B1 || B0 EPR spectrum (open triangles) of [CuCu(AAP)] at pH 9.65 are shown superimposed on a theoretical Curie law temperature dependence (solid line).
Computer simulations of the B1 ⊥ B0 signals from [CuCu-(AAP)] are shown in Figure 5. Figure 5A shows a region of the spectrum of Figure 3C with the low-field region multiplied by nine and shown above the main trace. Trace 5B is a computer simulation of trace 5A obtained by the addition of the two simulations of traces 5C and 5D. Trace 5C is a computer simulation assuming a dinuclear copper site with the following spin Hamiltonian:
Figure 5.

EPR simulations of the signals from [CuCu(AAP)]. Trace A shows the B1 ⊥ B0 EPR signal from [CuCu(AAP)] at pH 9.65 recorded at 45 K, 2 mW microwave power, and 1.0 mT magnetic field modulation amplitude. The low-field region of the spectrum is shown multiplied by a factor of 9 above the main trace. Trace B shows a simulation obtained by addition of traces C and D. The low-field region of the simulation is shown multiplied by a factor of 9 above the main trace. Trace C is an Xsophe simulation assuming a dinuclear copper system, using the spin Hamiltonian and associated parameters ℋ = βB·gCuA·SCuA + βB·gCuB·SCuB + [S·A·I]CuA + [S·A·I]CuB + [SCuA·J·SCuB]; g||(CuA,CuB) = 2.218 and g⊥(CuA,CuB) = 2.060; A||(CuA,CuB)(63/65Cu) = 1.59 × 10⁻² cm−1 and A⊥(CuA,CuB)(63/65Cu) =2.0 × 10⁻³ cm−1; Jisotropic = 50 cm−1; rCuA–CuB = 4.93 Å and χ= 17°. Trace D is a simulation assuming an isolated Cu(II) ion with g|| = 2.218, g⊥ = 2.023, and A||(63/65Cu) = 1.55 × 10⁻² cm−1. Trace E is a higher resolution spectrum of [CuCu(AAP)] at pH 9.65, recorded at 45 K, 2 mW microwave power, and 0.25 mT magnetic field modulation amplitude. Trace F is an expanded version of trace B over the magnetic field range corresponding to trace E. Trace G is the third derivative (∂3χ″/∂H3) spectrum of [CuCu(AAP)] over a narrow field range. Trace H is the corresponding simulation of G using the parameters for trace C.
The parameters used, given in the legend to Figure 5, correspond to two essentially indistinguishable copper ions with collinear g tensors with g|| = 2.218 ± 0.003 and g⊥ = 2.060 ± 0.003, separated by ~5 Å and with an angle of ~17° between the inter-copper coupling vector and the gz directions.
The simulations, in particular the separation between the two g⊥ features at 298 and 362 mT, were very sensitive to rCuA–CuB, and the effect of varying r upon the simulation is illustrated in traces A–G of Figure 6. While it is clear from Figure 6 that anisotropic couplings corresponding to values of r differing by 0.25 Å are very easily resolved, the correspondence between r and |D|, the zero-field splitting due to the anisotropic interaction, holds only in situations for which the dipolar approximation is valid (i.e., when the anisotropic exchange coupling is negligible). The anisotropic exchange coupling and the dipolar interaction cannot normally be distinguished by studies on frozen solutions, and single-crystal EPR or calculation from a molecular orbital perspective is necessary. However, for those systems analyzed, it does appear to be the case that the anisotropic exchange coupling is small as compared to the dipolar interaction for coupled copper systems45,46 except where the copper ions are very strongly bridged by single atoms such as in some Cu2(N3−)2 complexes.47 In the latter examples |D| is typically much larger than observed in the present study; for the complex [Cu2(4-terbutylpyridine)4(N3)2]2+, |D| = 0.43 cm−1 and a rhombic distortion of |E| = 0.026 cm−1 could be determined,47 whereas for AAP in the present study |D| = 0.016 cm−1. Thus, we can be reasonably confident, on the basis of the small |D| and from comparison with reduced copper-substituted bacterial photo-synthetic reaction centers (|D| = 0.007 cm−1, |E| ~ 0),46 that the anisotropic exchange coupling will be small as compared to the dipolar interaction. Nevertheless, in the absence of any quantitative estimates or limits for the anisotropic exchange coupling, the precision of our distance estimates must be considered to be significantly lower than that suggested by the value (4.93 Å) used to obtain optimum simulations, and we prefer to quote the EPR-derived distance estimate for [CuCu-(AAP)] in Mes and Ches buffers as being 5 Å. We sought to strengthen this distance assignment, and an alternative method of estimating the distance between two spin-coupled S = 1/2 systems, particularly useful at longer distances where the g ~2 region is complicated by overlapping transitions, is by measurement of the intensity of the half-field transition; this method has been successfully applied to Cu(II)–Cu(II) and Cu(II)–nitroxide species.41 From Figure 5, traces A and B it is clear that the ratios of the intensities of the half-field (|1−〉 → |1+〉) transitions and the allowed (|1−〉 → |0〉; |0〉 → |1+〉) transitions in the experimental and simulated spectra are comparable and thus support our distance estimation. Although the simulation (Figure 5F) of the half-field transition (Figure 5E) does not perfectly reproduce the experimental spectrum, the resonance positions are correct, and the discrepancies are likely due to the limited set of orientational parameters that were allowed to vary.
Figure 6.

Calculated spectra assuming two spin-coupled S = 1/2 axial species. The individual species were calculated assuming identical g values for the individual species, g|| = 2.2 and g⊥ = 2.0, with line widths of 3.0 mT. For simplicity, no hyperfine interaction was considered. Spectra A–G illustrate the effect of varying the dipolar coupling as a function of the intercenter distance, r. Spectra were calculated for (A) r = 4.25 Å, (B) 4.50 Å, (C) 4.75 Å, (D) 5.00 Å, (E) 5.25 Å, (F) 5.50 Å, and (G) 6.00 Å. For spectra A–G, Jisotropic = 5 cm−1 and χ= 17°. Spectra H–M illustrate the effect of Jisotropic assuming a fixed dipolar coupling. The values of Jisotropic used were (H) 5 cm−1, (I) 0.5 cm−1, (J) 0.1 cm−1, (K) 5 × 10⁻² cm−1, (L) 1 × 10⁻² cm−1, and (M) 0. For all spectra H–M, r = 5.00 Å and χ= 17°. Spectra N–S illustrate the effect of varying the angle, χ, between the dipolar coupling vector and gz. Spectra were calculated for χ= 90° (N), 60° (O), 45° (P), 30° (Q), 17° (R), and 0° (S). For spectra N – S, r = 5.00 Å and Jisotropic = 5 cm−1.
The simulations were sensitive to g values insofar as the positions of the broad feature at 258 mT and the midpoint between the sharp features at 298 and 362 mT were dependent on the average values (g||(CuA) + g||(CuB))/2 and (g⊥(CuA) + g⊥(CuB))/2, respectively. A||(63/65Cu) was refined by matching the third derivative of the calculated absorption spectrum (Figure 5H) to the low-field g|| feature in the ∂3χ″/∂H3 experimental spectrum (Figure 5G).
The simulations were also sensitive to the orientation of the inter-copper vector with respect to the assumedly mutual gz directions, and calculated spectra for the range χ= 90° to χ= 0 are shown as traces N–S of Figure 6. The best fit was obtained assuming χ= 17°, although the slight intensity discrepancies between the experimental and the simulated spectra of the half-field transition suggest that slight deviations from collinearity of the g tensors may also be present. The magnitude of the exchange interaction, Jisotropic = 50 cm−1, was assumed from an earlier NMR study;27 the precision of the value of Jisotropic obtained by NMR was low, but in fact, EPR simulations were extremely insensitive to Jisotropic except for the cases where J was comparable with the Zeeman term (Figure 6). Examples of the effects of such low values for the isotropic interaction are shown as traces J–M of Figure 6. At higher values of J (≥0.5 cm−1; see Figure 6, traces H and I) the calculated spectra became insensitive to Jisotropic. The component of the spectrum of [CuCu(AAP)] that was not accounted for by the dinuclear species was determined by computer simulation to be due to mononuclear Cu(II), and trace 5D is a simulation assuming an isolated Cu(II) ion with g|| = 2.218, g⊥ = 2.023, and A||(63/65Cu) = 1.55 × 10⁻² cm−1. These parameters indicate Cu binding in a site other than the site occupied in [Cu_(AAP)] and suggest a third binding site distant from the active site and likely adventitious. That this species is not due to a heterodimetallic copper–zinc form of the enzyme was clear from activity measurements, and the EPR parameters of this mononuclear species are distinguishable from those of [Cu_(AAP)]. The sum (Figure 5B) of the two simulations clearly gives a good fit to the experimental data (Figure 5A).
To probe the relationship between Cu(II)-substituted AAP in frozen solution and the active enzyme at ambient temperatures, AAP in 50 mM Tris-HCl buffer, pH 7.0, was incubated with 1, 2, 3, and 4 equiv of Cu(II), and the EPR spectra were recorded at 295 ± 3 K and 12 K; the results are shown in Figure 7. It is immediately clear from Figure 7, traces A and B that the environment of the Cu(II) ion in [Cu_(AAP)] at both temperatures is indistinguishable. Maxima at 280, 297, 314, and 331 mT and an inflection at 337 mT are very close to those observed for [Cu_(AAP)] at pH 9.65 and 6.0 (cf. Figure 2). Additional weak contributions to the spectrum at 307 and 355 mT suggest a small amount of [CuCu(AAP)]. Upon addition of 2 equiv of Cu(II), the major component of the spectra (Figure 7, traces C and D) are the features at 307 and 355 mT, indicative of a triplet state due to two spin-coupled Cu(II) ions. Interestingly, the splitting of these features suggests a slightly longer Cu–Cu distance in Tris buffer, pH 7.0, than under the other buffering systems and may reflect interaction of Tris with Cu2. Comparison with simulations (Figure 6) suggests an inter-copper distance of 5.5 Å rather than 5.0 Å and, in turn, suggests some flexibility of the site, particularly of Cu2; this variation of the inter-copper distance because of chemical effects likely places limits on the degree to which the EPR-derived distances can be interpreted in structural terms. The slight difference between separation of the |1−〉 → |0〉 and |0〉 → |1+〉 lines in the spectra of [CuCu(AAP)] in Tris, pH 7.0 (Figure 7, traces C and D), and those in other buffer systems (Figure 3) in the 300–400 mT region were mirrored by slight differences in the signals because of the |1−〉 → |1+〉 forbidden transitions centered around 160 mT (Figure 7, traces J and K). Upon adding 3 equiv of Cu(II), features that appear at field values between |1−〉 → |0〉 and |0〉 → |1+〉 lines become comparable in intensity with these latter features (Figure 7, traces E and F) and dominate the spectrum upon the addition of further equiv of Cu(II) (Figure 2, traces G and H). The spectrum of excess Cu(II) in the presence of AAP (Figure 7G) clearly indicates Cu(II) present as a low molecular weight species in rapid motion (τc ~ 60 ps) and therefore likely bound by Tris rather than by AAP. In frozen solution, a powder spectrum is observed (Figure 7H). However, this spectrum differs from that of Cu(II) in Tris in the absence of any AAP (Figure 7I). The EPR spectrum of Figure 7I indicates some aggregation of Cu(II) in the absence of AAP and suggests a role of perhaps weak adventitous binding of Cu(II) to surface residues of AAP in preventing Cu aggregation. At ambient temperature, however, it is clear that the excess Cu(II) spends the majority of the time dissociated from AAP.
Figure 7.
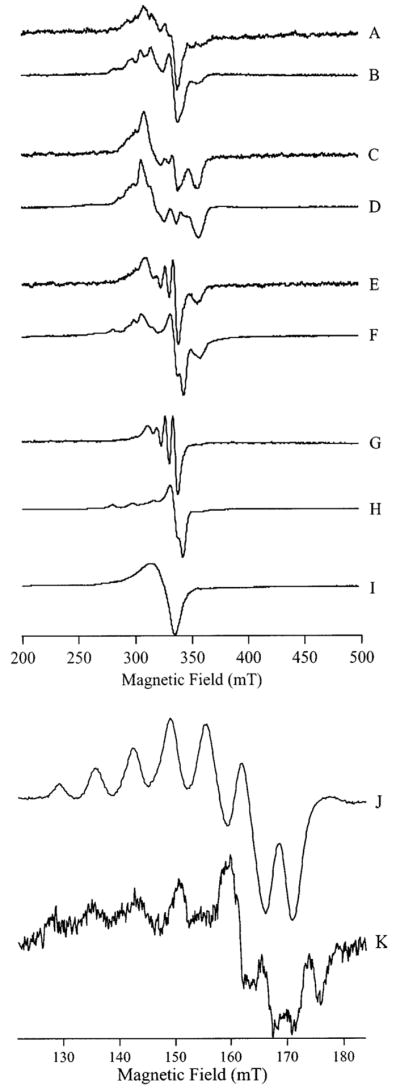
EPR spectra of Cu(II) added to apo-AAP. The traces A–H show spectra from solutions of 50 mM Tris-HCl buffer, pH 7.0, containing AAP and Cu(II) at the following concentrations: (A and B) 2.7 mM AAP, 2.7 mM Cu(II); (C and D) 2.0 mM AAP, 4.0 mM Cu(II); (E and F) 1.6 mM AAP, 4.8 mM Cu(II); and (G and H) 1.3 mM AAP, 5.2 mM Cu(II). Trace I corresponds to 5 mM Cu(II) in the absence of AAP. Trace J corresponds to trace E of Figure 5 and is shown for comparison. Spectrum K is from the same sample as for spectra C and D shown here. Spectra A, C, E, and G were recorded at 295 ± 3 K and 10 mW microwave power. Spectra B, D, F, H, I, and K were recorded at 12 K and 1.0 mW microwave power. All spectra were recorded using a Bruker ER 4116 DM cavity containing a quartz dewar insert and with the sample capillary mounted inside a 3 mm diameter EPR tube containing 100 μL of ethanol to facilitate thermal contact at low temperature. Spectra were recorded with 0.5 mT field modulation amplitude.
EPR Studies on Cu(II)-Substituted EcMetAP
In contrast to AAP, when Cu(II) was added to EcMetAP, only mononuclear Cu species were observed. The spectra in 150 mM KCl and 50 mM Mops, pH 6.8, and 150 mM KCl and 50 mM Caps, pH 10.1 (Figure 2, traces C and D, respectively), are each due to a single species. Good simulations could not be obtained using an axial g tensor, and instead, simulations suggested that at pH 6.8 the spectrum exhibited a very small rhombicity with gz = 2.250 ± 0.001, gy = 2.062 ± 0.001, gx = 2.050 ± 0.001, and Az(63/65Cu) =1.77 × 10⁻² cm−1 ± 1.5 × 10⁻⁴ cm−1. Also in contrast to AAP, the signals from EcMetAP were highly pH dependent, and a markedly different set of parameters for the high pH spectrum (Figure 2D) were obtained: g|| = 2.190 ± 0.001, g⊥ =2.050 ± 0.001, and A||(63/65Cu) = 2.05 × 10⁻² cm−1 ± 1.5 × 10⁻⁴ cm−1. These parameters suggest an additional nitrogen ligand at high pH. Further addition of Cu(II) beyond 1 M equiv yielded a second EPR-detectable species indistinguishable from Cu(II) in buffer solution (not shown). When EcMetAP was incubated with excess Cu(II) and then exchanged into Cu-free buffer, ICP–AES metal analysis indicated only one Cu atom per EcMetAP enzyme molecule. The gx,y region of the low pH spectrum exhibited some resolved structure with an apparent splitting of 1.3 mT. However, fine structure in the gx,y region can be complicated by slight rhombicity and/or the presence of overshoot lines. Because the origin of the gx,y region structure could not be determined at X-band, S-band spectra of [Cu_(EcMetAP)] were recorded and are shown in Figure 8. At S-band, small rhombicities collapse, and the structure in the gx,y region was considerably simplified. Four lines are discernible in the g⊥ region at S-band (Figure 8A) that are further resolved in the ∂2χ″/∂H2 spectrum (Figure 8B). The ∂2χ″/∂H2 spectrum also appears to contain fine structure with an apparent splitting of 1.1 mT in the region 113–118 mT. This structure may constitute evidence for nitrogen ligation of the copper ion, although further work with 15N/63Cu-labeled EcMetAP is needed to unambiguously assign the fine structure.
Figure 8.
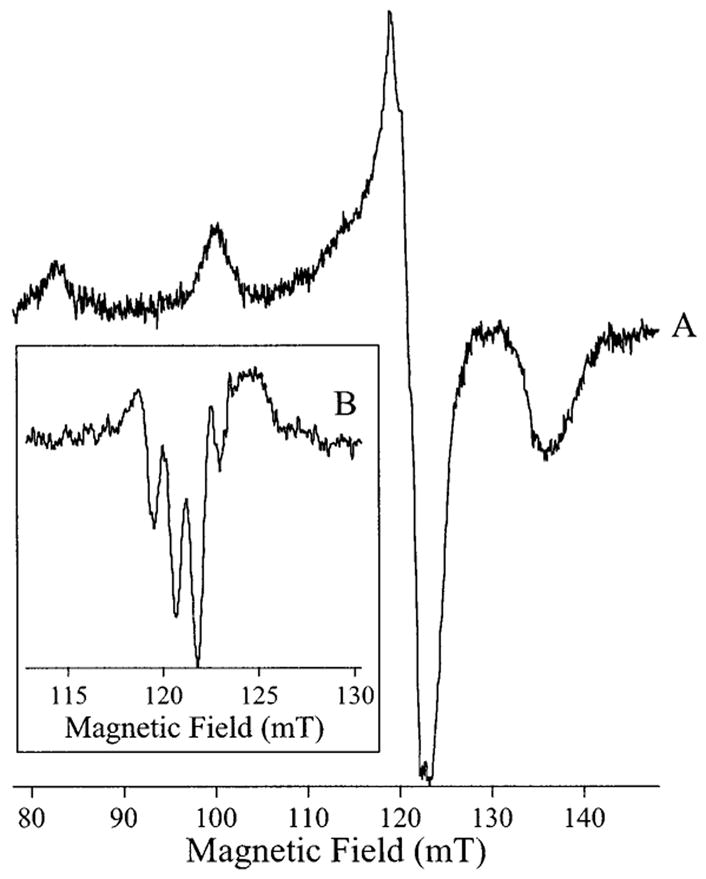
S-Band EPR of [Cu_(MAP)]. (A) EPR spectrum of [Cu_(MAP)] at pH 6.8 recorded at 90 K, 3.43 GHz and 0.4 mT magnetic field modulation amplitude and with 15 dB microwave power attenuation. (B) Second derivative spectrum (∂2χ″/∂H2) of the g⊥ region.
Discussion
Inspection of the observed electronic absorption spectra of [CuCu(AAP)] at pH 7.5 in the 500–900 nm range reveals a single, broad absorption that is characteristic of Cu(II) d→d transitions (a1g→b1g). These data are typical of tetragonally distorted Cu(II) centers found in type-2 copper proteins.48,49 The position of this band for both [Cu_(AAP)] and [CuCu(AAP)] suggests a trigonal bipyramidal (TBP) geometry for each of the Cu(II) ions, although as the ligand field around the Cu(II) ions is determined by both the ligand types and the coordination geometry, the latter cannot be unambiguously determined from the energy of the maximum of the envelope of the d→d transitions.50 Upon raising the pH to 9.65 for [CuCu(AAP)], the position of the single absorption band changes by only 30 nm, from 760 to 730 nm, indicating that the geometries of the Cu(II) centers in AAP are essentially pH independent. This latter conclusion is supported by the EPR spectra, which exhibit very similar parameters at both pH values. However, the EPR spectra have g|| > g⊥ and thus indicate substantial dx2−y2 character of the orbital in which the paramagnetic electron resides. These data therefore indicate square pyramidal (SP)-based geometry for the Cu(II) ions, and the electronic absorption data are perhaps best interpreted as being due to significant distortion of a nominally SP geometry to a geometry intermediate between SP and TBP. It may be relevant that, at high pH, the Co(II) ions in various Co(II)-substituted forms of AAP are also in highly distorted and tightly constrained geometries, as shown by the large rhombic distortion of the axial zero-field splitting and the well-resolved 59Co hyperfine structure, respectively.13,14 The possibility that the apparently contradictory data from EPR and electronic absorption studies was due to the Cu(II) ions adopting different geometries in the fluid and frozen states of the solution was investigated. EPR signals from [Cu_(AAP)] and [CuCu(AAP)] obtained at room temperature and at 10 K were indistinguishable and clearly indicate that the geometries of the Cu(II) ions are temperature independent.
The Cu(II) center in [Cu_(EcMetAP)] exhibits an electronic absorption λmax at 560 nm suggesting that the Cu(II) ion in EcMetAP is best described as a distorted SP and the EPR spectrum is entirely consistent with this description. Increasing the pH of the [Cu_(EcMetAP)] results in a small shift in the λmax value from 560 to 520 nm, indicating that the Cu(II) center in EcMetAP also remains SP at high pH values.
Additional electronic information about the Cu(II)-substituted forms of AAP and EcMetAP were obtained from their EPR spectra. By comparison of the EPR parameters of [Cu_(AAP)] with those of model compounds and other copper-containing proteins, nitrogen coordination can be inferred despite the absence of resolvable 14N shfs in the EPR spectra.51 Indeed, the parameters are closest to those of the type-2 Cu(II) ions in laccase from Rhus vernicifera and ascorbate oxidase from Cucumus sativus, suggesting mixed histidine–nitrogen and carboxylate–oxygen coordination in AAP.52–54 While these data support the binding of Cu(II) to the active site residue His256,15 the lack of resolvable I = 1 14N shfs in the g|| region of the spectrum suggests that perhaps a second peptide nitrogen atom is bound to Cu in [Cu_(AAP)]. The g- and A-values are very similar at pH 6.0 and pH 9.65, and thus, it appears highly unlikely that any major structural or geometric rearrangement occurs over the pH range 6.0–9.65 consistent with the electronic absorption data. Therefore, the EPR spectra suggest binding of Cu(II) to an oxygen- and histidine nitrogen-containing site. The appearance of catalytic activity further suggests that Cu(II) is bound into the histidine and carboxylate site corresponding to that of Zn1 in the native enzyme.
The EPR data obtained for [CuCu(AAP)] suggest some marked differences between [CuCu(AAP)] and native [ZnZn(AAP)]. Most significantly, the inter-zinc distance in the active site of [ZnZn(AAP)], determined from a number of crystallographic studies, ranges between 3.3 and 3.7 Å in marked contrast to the EPR-determined distance of 5 Å for [CuCu(AAP)].15,16,55,56 The EPR simulations have been shown to be very sensitive to the inter-copper distance. Thus, it is clear that the second Cu(II) ion does not bind in an analogous fashion as Zn2 in the native enzyme. Equivalent g-values for the individual copper ions in [CuCu(AAP)] were assumed and provided good simulations. The g|| value of 2.218 ± 0.003 lies outside the range for copper ions liganded solely by oxygen atoms and, instead, suggests perhaps two or three nitrogen ligands for each of the two copper ions.51
A second, major difference between [CuCu(AAP)] and [ZnZn(AAP)] is that in [ZnZn(AAP)], and in the analogous [CoCo(AAP)], the metal ions in the resting enzyme are μ-bridged by the oxygen atom of a water or hydroxyl moiety, whereas the EPR data for [CuCu(AAP)] preclude a single oxygen atom bridge. The EPR data clearly indicate that |Jisotropic| > gβBS. While Jisotropic could not, therefore, be measured by EPR, 1H NMR studies suggested an exchange coupling in the region 10–90 cm−1.27 The Curie law temperature dependence of both the 1H NMR and the EPR spectra of [CuCu(AAP)] clearly indicates that the coupling is ferromagnetic, a finding that is inconsistent with a single Cu–μOH(H)–Cu moiety. The EPR spin Hamiltonian parameters for the dinuclear system at pH 9.65 were indistinguishable from those at pH 6.0 and indicate that the dipolar coupling between the two Cu(II) centers does not change as a function of pH. In contrast, the magnetic coupling between the μOH(H)-bridged metal ions in [CoCo(AAP)] is strongly pH dependent because of ionization of the bridging moiety. These data are entirely consistent with the EPR-determined inter-copper distance of 5 Å in [CuCu(AAP)] and are inconsistent with a μOH or μoxo moiety, which would require a considerably shorter distance.
A combination of the EPR data presented herein with the previously reported27 1H NMR data for [CuCu(AAP)] provides insight into the structural motif of the [CuCu(AAP)] active site. The M–M distance in [CuCu(AAP)] has been found in the present study to be 5 Å, as compared to 3.5 Å for [ZnZn(AAP)]. This Cu–Cu separation is much longer that those found in model complexes that contain doubly bridged and single atom bridged dicopper(II) centers (2.9–4.2 Å).57–61 For example, the Cu–μO–Cu core of the AAP active site model compound Na-[Cu2(CH3HXTA)(Py)2] (HXTA = N, N′-(2-hydroxy-5-methyl-1,3-xylylene)bis(N-carboxymethyl)glycine) exhibits an inter-copper distance of 3.53 Å.62 On the other hand, the Cu–Cu distance is significantly shorter than nonbridged Cu(II) centers (5.8 Å).48 Interestingly, for synthetic model complexes with single carboxylate bridges, M–M distances are routinely observed in the 4–5.5 Å range. Therefore, the 5 Å Cu–Cu distance determined for [CuCu(AAP)] provides good evidence that there is no single atom bridge between the two Cu(II) ions but, rather, a bridging carboxylate, probably Asp117 (Chart 1).
Chart 1.
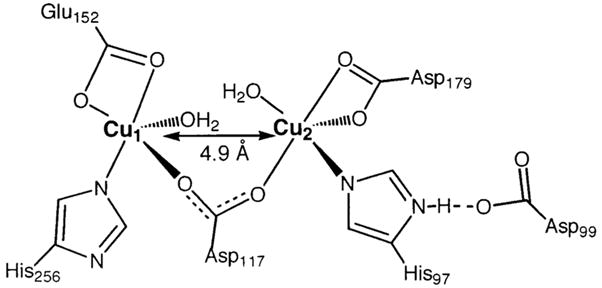
Schematic of the Proposed Structure of the Active Site of [CuCu(AAP)]
The EPR spectrum of Cu(II)-loaded EcMetAP, unlike [CuCu-(AAP)], indicates that only one Cu(II) ion is present in the active site even in the presence of excess Cu(II). This is consistent with kinetic and spectroscopic data for EcMetAP that suggest that the enzyme only binds one divalent metal ion under physiological conditions.17,63 The electronic absorption spectra are consistent with a mononuclear Cu(II) ion residing in a SP environment. Comparison of the EPR spectra of [Cu_(EcMetAP)] at pH 6.8 and [Cu_(AAP)] indicates that both the g|| and A|| values are similar and suggests that the Cu(II) center in EcMetAP is liganded by at least one nitrogen atom at physiological pH. These data are consistent with a single Cu(II) ion being bound to His171 in the active site of EcMetAP (Chart 2).17,63
Chart 2.

Proposed Structure of the Metal Binding Site in [Cu_(EcMetAP)]
Mechanistic Implications and Conclusions
The combination of X-ray crystallographic, kinetic, and spectroscopic data for AAP has allowed a detailed mechanism to be proposed for the native Zn(II) enzyme, which appears to function in an identical manner to the Co(II)-substituted enzyme.16 However, the fact that AAP is hyperactive upon the addition of Cu(II) alone or in combination with Zn(II) toward Ala-p-NA but not Leu-p-NA is not well-understood. Inspection of the previously reported kinetic data for [ZnZn(AAP)], [CuCu(AAP)], [CuZn(AAP)], and [ZnCu(AAP)] toward both Ala-p-NA and Leu-p-NA (Table 1) provides some mechanistic insight into the altered substrate specificity of Cu(II)-substituted AAP in light of the structural data reported herein.
Table 1.
Kinetic Constants for Zn(II)- and Cu(II)-Substituted AAP for Various Substratesa
| substrate | kinetic constants | [ZnZn(AAP)] | [CuCu(AAP)]a | [CuZn(AAP)]a | [ZnCu(AAP)]a |
|---|---|---|---|---|---|
| Ala-p-NA | Km (mM) | 1000 | 36 | 25 | 740 |
| kcat (min−1) | 17.3 | 5.4 | 61.5 | 14.2 | |
| kcat/Km (M−1 min−1) | 1.73 | 15 | 246 | 1.92 | |
| % activation | 100 | 867 | 14 220 | 110 | |
| Leu-p-NA | Km (mM) | 11 | 13 | 15 | 13 |
| kcat (min−1) | 4720 | 240 | 557 | 3270 | |
| kcat/Km (M−1 s−1) | 20 520 | 1850 | 3710 | 25 150 | |
| % activation | 100 | 9 | 18 | 123 |
Data taken from Bayliss and Prescott.32
According to the recently proposed mechanism for AAP, substrate binding to the hydrophobic pocket adjacent to the dinuclear active site is the first step in catalysis.28 When Leu-p-NA binds to the hydrophobic pocket of [CuCu(AAP)], the substrate is likely not positioned properly for catalytic turnover, so the first-order rate constant (kcat/Km) decreases over 10-fold as compared to [ZnZn(AAP)] (Table 1). A possible explanation for this observation is that the nucleophilic hydroxide moiety is not in the proper position to attack the scissile carbonyl carbon of the substrate. This may simply be the result of an SP-based geometry for Cu(II) bound in the first site versus a Td geometry if Zn1 were bound instead. Other factors might include the change in Lewis acidity of Cu(II) versus Zn(II), the lack of participation of the second metal ion in activating the bridging water molecule to a hydroxide, the stabilization of the transition state because of the long Cu–Cu distance (5 Å), and/or the lack of a bridging water/hydroxide. Participation of the second metal ion in the catalytic mechanism is clearly based on the observed 2-fold increase in kcat/Km for [CuZn(AAP)] (Table 1). Interestingly, when Zn(II) is in the first site and Cu(II) is in the second, the resulting AAP enzyme is equally as active as [ZnZn-(AAP)]. The geometry for the first metal binding site is Td so that the substrate and the nucleophile are positioned correctly and that the Lewis acidity is also correct. Since AAP is ~80% active when only a single Zn(II) is present, the Cu(II) ion in [MCu(AAP)] appears to play little or no catalytic role.
Further insight into the catalytic mechanism of Cu(II)-substituted AAP can be gleaned from the alternate substrate Ala-p-NA. Again, the first interaction between the substrate and the enzyme is alanine binding to the hydrophobic pocket;28 however, the methyl group of Ala likely allows more flexibility in the substrate-binding mode as compared to the isopropyl group of Leu. This less rigid substrate-binding mode likely facilitates the proper orientation of the substrate with regard to the nucleophile, allowing hydrolysis to occur. The distorted geometry of Cu(II) must be adventitious for the hydrolysis of Ala-p-NA versus the tetrahedral geometry for Zn(II) since kcat/Km increases nearly 9-fold. Participation of the second metal ion in the catalytic process is obvious from the nearly 17-fold increase in kcat/Km when Zn(II) is placed in the second metal binding site. It appears clear from the EPR results that the second binding site for Cu is not analogous to that of Zn. The proximity of Zn2 to the first metal ion in [MZn(AAP)] facilitates stabilization of the transition state,14 a role that cannot be fulfilled by the more distant Cu2 in [MCu(AAP)]. Not surprisingly, then, when Zn(II) is placed in the first site and Cu(II) in the second, the resulting [ZnCu(AAP)] functions like [Zn_-(AAP)] and [ZnZn(AAP)].
These data, coupled with the fact that AAP can be activated by every first row transition metal ion from Co(II) to Zn(II), suggest that the Lewis acidity of the metal ion bound in the active site of AAP is less important than the coordination geometry that the hydrolytic metal ion, M1, adopts. This finding also provides insight into why [Cu_(EcMetAP)] is inactive. The active site Co(II) or Fe(II) enzymes adopt TBP geometry, but Cu(II) prefers an SP configuration. SP geometry probably does not allow the correct orientation of the nucleophile and the substrate in [M_(EcMetAP)]. The geometrical importance of the catalytic metal ion in AAP and EcMetAP is likely widely applicable to hydrolytic metalloenzymes with both mono- and dinuclear active sites. The fact that the vast majority of these enzymes are active with a wide range of divalent first row transition metals suggests that Lewis acidity is not a strong determinant of activity. In contrast, the geometry that the active site metal ion adopts appears to be very important. Thus, metal ion geometry is critical for the activated substrate and for the nucleophile to be positioned correctly for catalytic turnover to occur.
Acknowledgments
This work was supported by grants to R.C.H. from the National Science Foundation (CHE-9816487) and the National Institutes of Health (GM-56495) and by an NIH Research Resources grant to the National Biomedical EPR Center, Biophysics Research Institute, Medical College of Wisconsin (NIH RR01008). The authors thank Dr. Graeme Hanson, Center for Magnetic Resonance, University of Queen-sland for technical assistance with XSophe. We also thank Dr. Candice Klug of the Medical College of Wisconsin for valuable assistance with experiments using the loop–gap resonator-equipped X-band Varian spectrometer, and we gratefully acknowledge Mr. Amit Kumar and Ms. Andrea Funk for assistance with AAP preparation.
References
- 1.Sträter N, Lipscomb WN, Klabunde T, Krebs B. Angew Chem, Int Ed Engl. 1996;35:2024–2055. [Google Scholar]
- 2.Lipscomb WN, Sträter N. Chem Rev. 1996;96:2375–2433. doi: 10.1021/cr950042j. [DOI] [PubMed] [Google Scholar]
- 3.Wilcox DE. Chem Rev. 1996;96:2435–2458. doi: 10.1021/cr950043b. [DOI] [PubMed] [Google Scholar]
- 4.Dismukes GC. Chem Rev. 1996;96:2909–2926. doi: 10.1021/cr950053c. [DOI] [PubMed] [Google Scholar]
- 5.Pelido-Cejudo G, Conway B, Proulx P, Brown R, Izaguirre CA. Antiviral Res. 1997;36:167–177. doi: 10.1016/S0166-3542(97)00052-1. [DOI] [PMC free article] [PubMed] [Google Scholar]
- 6.Taunton J. Chem Biol. 1997;4:493–496. doi: 10.1016/s1074-5521(97)90320-3. [DOI] [PubMed] [Google Scholar]
- 7.Sin N, Meng L, Wang MQ, Wen JJ, Bormann WG, Crews CM. Proc Natl Acad Sci USA. 1997;94:6099–6103. doi: 10.1073/pnas.94.12.6099. [DOI] [PMC free article] [PubMed] [Google Scholar]
- 8.Griffith EC, Su Z, Turk BE, Chen S, Chang YH, Wu Z, Biemann K, Liu JO. Chem Biol. 1997;4:461–471. doi: 10.1016/s1074-5521(97)90198-8. [DOI] [PubMed] [Google Scholar]
- 9.Lowther WT, McMillen DA, Orville AM, Matthews BM. Proc Natl Acad Sci USA. 1998;95:12153–12157. doi: 10.1073/pnas.95.21.12153. [DOI] [PMC free article] [PubMed] [Google Scholar]
- 10.Liu S, Widom J, Kemp CW, Crews CM, Clardy J. Science. 1998;282:1324–1327. doi: 10.1126/science.282.5392.1324. [DOI] [PubMed] [Google Scholar]
- 11.Prescott JM, Wagner FW, Holmquist B, Vallee BL. Biochemistry. 1985;24:5350–5356. doi: 10.1021/bi00341a012. [DOI] [PubMed] [Google Scholar]
- 12.Bayliss ME, Prescott JM. Biochemistry. 1986;25:8113–8117. doi: 10.1021/bi00372a047. [DOI] [PubMed] [Google Scholar]
- 13.Bennett B, Holz RC. Biochemistry. 1997;36:9837–9846. doi: 10.1021/bi970735p. [DOI] [PubMed] [Google Scholar]
- 14.Bennett B, Holz RC. J Am Chem Soc. 1998;120:12139–12140. [Google Scholar]
- 15.DePaola CC, Bennett B, Holz RC, Ringe D, Petsko GA. Biochemistry. 1999;38:9048–9053. doi: 10.1021/bi9900572. [DOI] [PubMed] [Google Scholar]
- 16.Stamper C, Bennett B, Edwards T, Holz RC, Ringe D, Petsko G. Biochemistry. 2001;40:7035–7046. doi: 10.1021/bi0100891. [DOI] [PubMed] [Google Scholar]
- 17.D’souza VM, Bennett B, Copik AJ, Holz RC. Biochemistry. 2000;39:3817–3826. doi: 10.1021/bi9925827. [DOI] [PubMed] [Google Scholar]
- 18.Lowther WT, Orville AM, Madden DT, Lim S, Rich DH, Matthews BW. Biochemistry. 1999;38:7678–7688. doi: 10.1021/bi990684r. [DOI] [PubMed] [Google Scholar]
- 19.Tahirov TH, Oki H, Tsukihara T, Ogasahara K, Yutani K, Ogata K, Izu Y, Tsunasawa S, Kato I. J Mol Biol. 1998;284:101–124. doi: 10.1006/jmbi.1998.2146. [DOI] [PubMed] [Google Scholar]
- 20.Wilce MC, Bond CS, Dixon NE, Freeman HC, Guss JM, Lilley PE, Wilce JA. Proc Natl Acad Sci USA. 1998;95:3472–3477. doi: 10.1073/pnas.95.7.3472. [DOI] [PMC free article] [PubMed] [Google Scholar]
- 21.Lowther WT, Zhang Y, Sampson PB, Honek JF, Matthews BW. Biochemistry. 1999;38:14810. doi: 10.1021/bi991711g. [DOI] [PubMed] [Google Scholar]
- 22.Gilboa R, Greenblatt HM, Perach M, Spungin-Bialik A, Lessel U, Wohlfahrt G, Schomburg D, Blumberg S, Shoham G. Acta Crystallogr, Sect D. 2000;56:551. doi: 10.1107/s0907444900002420. [DOI] [PubMed] [Google Scholar]
- 23.Strater N, Lipscomb WN. Biochemistry. 1995;34:14792–14800. doi: 10.1021/bi00045a021. [DOI] [PubMed] [Google Scholar]
- 24.Strater N, Lipscomb WN. Biochemistry. 1995;34:9200–9210. doi: 10.1021/bi00028a033. [DOI] [PubMed] [Google Scholar]
- 25.Kim H, Lipscomb WN. Biochemistry. 1993;32:8465–8478. doi: 10.1021/bi00084a011. [DOI] [PubMed] [Google Scholar]
- 26.Bennett B, Holz RC. J Am Chem Soc. 1997;119:1923–1933. [Google Scholar]
- 27.Holz RC, Bennett B, Chen G, Ming LJ. J Am Chem Soc. 1998;120:6329–6335. [Google Scholar]
- 28.Ustynyuk L, Bennett B, Edwards T, Holz RC. Biochemistry. 1999;38:11433–11439. doi: 10.1021/bi991090r. [DOI] [PubMed] [Google Scholar]
- 29.Huntington KM, Bienvenue DL, Wei Y, Bennett B, Holz RC, Pei D. Biochemistry. 1999;38:15587–15596. doi: 10.1021/bi991283e. [DOI] [PubMed] [Google Scholar]
- 30.Bienvenue DL, Bennett B, Holz RC. J Inorg Biochem. 2000;78:43–54. doi: 10.1016/s0162-0134(99)00203-2. [DOI] [PubMed] [Google Scholar]
- 31.Wilkes SH, Prescott JM. J Biol Chem. 1987;262:8621–8625. [PubMed] [Google Scholar]
- 32.Bayliss ME, Prescott JM. Biochemistry. 1986;25:8113–8117. doi: 10.1021/bi00372a047. [DOI] [PubMed] [Google Scholar]
- 33.Wilkes SH, Prescott JM. J Biol Chem. 1985;260:13154–13162. [PubMed] [Google Scholar]
- 34.Baker JO, Prescott JM. Biochem Biophys Res Commun. 1985;130:1154–1160. doi: 10.1016/0006-291x(85)91736-x. [DOI] [PubMed] [Google Scholar]
- 35.Roderick SL, Matthews BW. Biochemistry. 1993;32:3907–3912. doi: 10.1021/bi00066a009. [DOI] [PubMed] [Google Scholar]
- 36.Prescott JM, Wilkes SH. Methods Enzymol. 1976;45B:530–543. doi: 10.1016/s0076-6879(76)45047-4. [DOI] [PubMed] [Google Scholar]
- 37.Chen G, Edwards T, D’souza VM, Holz RC. Biochemistry. 1997;36:4278–4286. doi: 10.1021/bi9618676. [DOI] [PubMed] [Google Scholar]
- 38.D’souza VM, Holz RC. Biochemistry. 1999;38:11079–11085. doi: 10.1021/bi990872h. [DOI] [PubMed] [Google Scholar]
- 39.Wang DM, Hanson GR. J Magn Reson A. 1995;117:1–8. [Google Scholar]
- 40.Vänngård T. In: Biological Applications of Electron Spin Resonance. Swartz HM, Bolton JR, Borg DC, editors. Wiley-Interscience; New York: 1972. p. 411. [Google Scholar]
- 41.Eaton SS, Kundalika MM, Sawant BM, Eaton GR. J Am Chem Soc. 1993;105:6560–6567. [Google Scholar]
- 42.Boas JF, Pilbrow JR, Smith TD. In: ESR of Copper in Biological Systems, in Biological Magnetic Resonance. Berliner LJ, Reuben J, editors. Plenum; New York: 1978. pp. 277–342. [Google Scholar]
- 43.Hendrich MP, Debrunner PG. Biophys J. 1989;56:489–506. doi: 10.1016/S0006-3495(89)82696-7. [DOI] [PMC free article] [PubMed] [Google Scholar]
- 44.Petasis DT, Hendrich MP. J Magn Reson. 1999;136:200–206. doi: 10.1006/jmre.1998.1657. [DOI] [PubMed] [Google Scholar]
- 45.Moriya T. Phys Rev. 1960;120:91–98. [Google Scholar]
- 46.Calvo R, Passeggi MCG, Isaacson RA, Okamura MY, Feher G. Biophys J. 1990;58:149–165. doi: 10.1016/S0006-3495(90)82361-4. [DOI] [PMC free article] [PubMed] [Google Scholar]
- 47.Kahn O, Boillot M-L. In: Biological and Inorganic Copper Chemistry. Karlin KD, Zubieta J, editors. Adenine Press; Guilderland, NY: 1985. pp. 187–208. [Google Scholar]
- 48.Solomon EI, Baldwin MJ, Lowery MD. Chem Rev. 1992;92:521–542. [Google Scholar]
- 49.Solomon EI, Lowery MD, Lacroix LB, Root DE. Methods Enzymol. 1993;266:1–33. doi: 10.1016/0076-6879(93)26003-r. [DOI] [PubMed] [Google Scholar]
- 50.Hathaway BJ, Billing DE. Coord Chem Rev. 1970;5:143–207. [Google Scholar]
- 51.Peisach J, Blumberg WE. Arch Biochem Biophys. 1974;165:691–708. doi: 10.1016/0003-9861(74)90298-7. [DOI] [PubMed] [Google Scholar]
- 52.Malmström BG, Reinhammar B, Vänngard T. Biochim Biophys Acta. 1968;156:67–76. doi: 10.1016/0304-4165(68)90105-0. [DOI] [PubMed] [Google Scholar]
- 53.Nakamura T, Makino N, Ogura Y. J Biochem (Tokyo) 1968;64:189–195. doi: 10.1093/oxfordjournals.jbchem.a128879. [DOI] [PubMed] [Google Scholar]
- 54.Messerschmidt A, Ladenstein R, Huber R, Bolognesi M, Avigliano L, Petruzelli R, Rossi A, Finazzi-Agro A. J Mol Biol. 1992;224:179–205. doi: 10.1016/0022-2836(92)90583-6. [DOI] [PubMed] [Google Scholar]
- 55.Chevrier B, Schalk C, D’Orchymont H, Rondeau JM, Moras D, Tarnus C. Structure. 1994;2:283–291. doi: 10.1016/s0969-2126(00)00030-7. [DOI] [PubMed] [Google Scholar]
- 56.Chevrier B, D’Orchymont H, Schalk C, Tarnus C, Moras D. Eur J Biochem. 1996;237:393–398. doi: 10.1111/j.1432-1033.1996.0393k.x. [DOI] [PubMed] [Google Scholar]
- 57.Nishida Y, Shimo H, Maehara H, Kida S. J Chem Soc, Dalton Trans. 1985;1985:1945–1951. [Google Scholar]
- 58.Berends HP, Stephan DW. Inorg Chim Acta. 1985;99:L53–L56. [Google Scholar]
- 59.Oberhausen KJ, Richardson JF, Buchanan RM, McCusker JK, Hendrickson DN, Latour JM. Inorg Chem. 1991;30:1357–1365. [Google Scholar]
- 60.Holz RC, Brink JM, Gobena FT, O’Connor CJ. Inorg Chem. 1994;33:6086–6092. [Google Scholar]
- 61.Holz RC, Gobena FT. Polyhedron. 1996;15:2179–2185. [Google Scholar]
- 62.Holz RC, Bradshaw JM, Bennett B. Inorg Chem. 1998;37:1219–1225. doi: 10.1021/ic9707873. [DOI] [PubMed] [Google Scholar]
- 63.Cosper NJ, D’souza VM, Scott RA, Holz RC. Biochemistry. 2001;40:13302–13309. doi: 10.1021/bi010837m. [DOI] [PubMed] [Google Scholar]