Abstract
This report introduces a new approach that enhances nonlinear solution magnetic resonance signals from intermolecular dipolar interactions. The resulting signals can theoretically be as large as the full equilibrium magnetization. Simple, readily implemented pulse sequences using square-wave magnetization modulation simultaneously refocus all even order intermolecular multiple quantum coherences, leading to a substantial net signal enhancement, complex nonlinear dynamics, and improved structural sensitivity under realistic conditions.
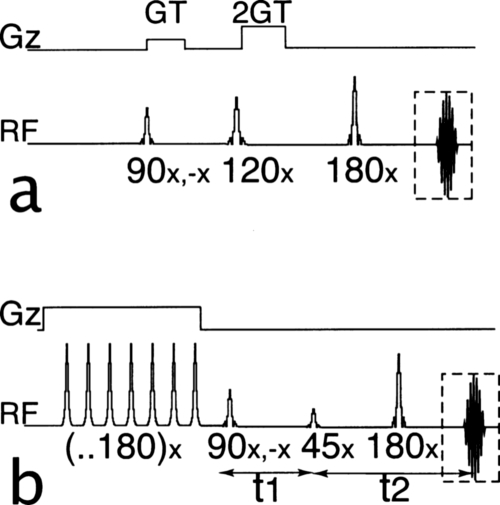
Two of the greatest simplifying tenets of liquid NMR are the linearity of the important spin operators at equilibrium and the linearity of the accompanying dynamics. Yet in recent years, it has become apparent that the exceedingly small dipolar interactions between distant spins in solution can generate macroscopic signals,1, 2, 3, 4, 5, 6 with a wide range of applications in spectroscopy7, 8, 9 and imaging.10, 11 These signals arise as the result of nonlinear dynamics, as described by modified Bloch equations [the classical or distant dipolar field (DDF) picture].4, 5, 6, 12, 13, 14 Alternatively, the dynamics can be linearized by keeping the nonlinear terms in the initial state of the system [the intermolecular multiple quantum coherence (iMQC) picture].7, 8, 9, 10, 11, 15 To date, all practical methods of observing these effects revolve around introducing a sinusoidal modulation in the magnetization via gradient pulses in a 1:n ratio, for example, in so called COSY revamped with asymmetric z-gradient echo detection (CRAZED) sequences [Fig. 1a]. However, these methods inherently select for just the n-quantum component of the signal, contributing to a low signal to noise (SNR) ratio which, under typical imaging conditions, is about an order of magnitude smaller than the full magnetization.
Figure 1.
(a) Standard iDQC-CRAZED pulse sequence. The first gradient pulse is applied to modulate the transverse magnetization. The mixing pulse transfers part of the modulation along the longitudinal axis to create the dipolar field. A second gradient pulse, twice as strong, coordinates with the first one to refocus only +iDQC coherences. (b) ZEBRA sequence. A series of slice selective off-resonance inversion pulses are applied to the longitudinal magnetization to create the characteristic Mz stripes pattern. The excitation pulse transfers this modulation onto the transverse plane. The mixing pulse transfers this modulation back onto the longitudinal axis to create a striped dipolar field. The evolution of the magnetization under the effect of the longitudinal dipolar field refocuses all the iMQC orders.
In this article, we propose and demonstrate a completely new approach to observing these effects [Fig. 1b]. We call this variant of CRAZED a Z-modulation enhanced to binary for self-refocused acquisition (ZEBRA) sequence. The basic strategy is to convert the equilibrium magnetization into stripes (a square wave), instead of the sinusoidal modulation used in CRAZED and similar sequences. The results from such a striping module are nonintuitive, even to those familiar with dipolar field effects. The dipolar couplings in this experiment can generate intermolecular signal after only one pulse or many different types of multiple quantum coherences without the need for selective gradient pulses. While the appearance of multiple quantum echoes is a familiar dipolar field effect, their appearance in the absence of gradients is quite surprising. In addition, the magnitude of this signal can approach that of the full equilibrium signal, completely in the form of intermolecular coherences. To demonstrate the practical advantages of this approach, we show, both experimentally and theoretically, that ZEBRA sequences produce a signal that is significantly larger than that of the best CRAZED experiments.
Stripes are readily achieved in practice in many ways. The simplest method (which we use here) is to turn on a gradient along the z direction and apply a series of adiabatic inversion pulses, offset in center frequency by twice their bandwidth. Unless the stripes are extremely thin, this is limited in practice only by T1 relaxation, which is much longer than T2 in most imaging applications, and thus does not present a limitation. This could be reduced further by using a single composite adiabatic pulse, but gradients are not actually needed; small rf coils could be used as well to get the spatial resolution. We start by explaining the simplest sequence (one pulse after such a striping module) using the DDF picture. After the striping module, magnetization is equally distributed along the z and −z axes; after a further θ pulse along the x direction, transverse magnetization will be equally distributed along the y and −y axis, so the macroscopic signal initially vanishes.
Both of these components will then evolve under the dipolar field created by the remaining longitudinal (z) magnetization. In general, a spatial Fourier component of the magnetization along an arbitrary direction gives a DDF of
| (1) |
In this expression, μ0 is the vacuum permeability, Mz is the z component of the magnetization, and and define the directions of the modulation and the main magnetic field B0, respectively. If all spins have the same resonance frequency, the second term in Bd does not contribute to the evolution and can be ignored. Further, if the z magnetization has only a single spatial component (as in CRAZED experiments), Fourier transformation to real space then shows the effective dipolar field will be
| (2) |
In addition, note that the term is the same for any combination of collinear spatial frequencies. So in fact for any sufficiently strong modulation exclusively along a single axis (including the infinite number of spatial frequencies that describe a square wave), Eq. 2 above holds. If there are nonuniformities in the magnetization density, this relation no longer holds, and that is why dipolar fields give enhanced contrast in images.
This simple linear relation between the dipolar field and the Mz magnetization affects the evolution of transverse magnetization in an intuitive way. After a θ−x pulse, the remaining DDF from residual +Mz magnetization rotates the My layers counterclockwise (for θ<π∕2), while the DDF from −Mz magnetization rotates the −My layers clockwise. These two components evolve in opposite directions until they completely refocus and echo along the x direction, then defocus. In the absence of relaxation, the signal will have a sinusoidal evolution given by the following expression:
| (3) |
For simplicity we introduce τd=(γμ0M0)−1, the dipolar time, which is 70 ms for water at room temperature in a 600 MHz spectrometer. In the limit where θ approaches π∕2, the maximum signal approaches the full magnetization, but slowly; the most rapid rise is obtained for θ=π∕4, in which case the first echo will occur at with an intensity of .
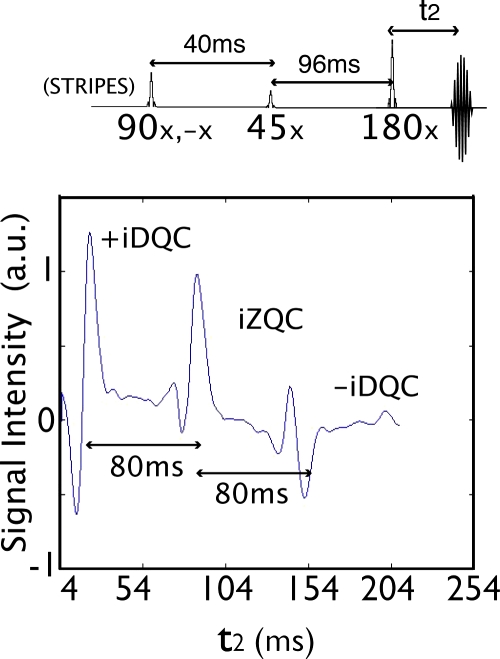
With even a few pulses, the spin dynamics are much richer. Figure 2 shows the results from the ZEBRA sequence in Fig. 1b applied to a sample of water with some inhomogeneous broadening. Three echoes are clearly visible; the center one is independent of the delay t1 and the other two are offset ±2t1 from the center. The presence (and characteristics) of these echoes are best understood by switching back to the iMQC picture. Qualitatively, the initial pulse takes two-spin operators IziIzj from the equilibrium density matrix and converts them into IxiIxj=1∕4(I+iI−j+I−iI+j+I+iI+j+I−iI−j). The first two terms (zero-quantum coherences) have no inhomogeneous evolution during t1 and therefore echo at the expected time. The last two terms [(+2)-quantum coherences and (−2)-quantum coherences] evolve during t1 with twice the inhomogeneous broadening. This causes them to echo earlier and later, respectively, in order to make up for the t1 evolution.
Figure 2.
Acquisition window from the striped experiment on a water sample. The acquisition window shows the echoes from double and zero-quantum coherences. In this case, a relatively long t1 was used (t1=40 ms) to separate the echoes in time. A spoiler gradient after the striping module and a pair of crush gradients right after the mixing pulse and before the acquisition window were used to avoid any radiation damping effects. A long TR of 20 s was used to avoid the refocusing of any stimulated echoes.
In general, n-quantum coherences arise from n-spin (and higher) terms in the equilibrium density matrix and become observable after longer evolution times. Quantitatively, the evolution can be exactly calculated (neglecting relaxation) to be
| (4) |
where ϕ is the relative phase between the excitation pulse and the mixing pulse. The contributions from n-quantum coherences during t1 are easily isolated by their nϕ dependence einϕ.
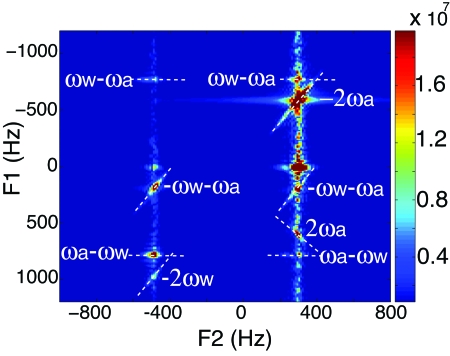
Figure 3 shows a two dimensional experiment on a solution of water and acetone to further clarify the effects. All the major iMQC orders appear with the expected frequency dependence. Cross peaks between water and acetone appear at the characteristic frequencies of zero and double quantum coherences, and the distinctive shapes of the peaks help differentiate the various contributions.
Figure 3.
A two dimensional spectrum using the sequence in Fig. 1b for a water and acetone solution on a Bruker Biospec 300 MHz MRI. The spectrum shows various iDQC and iZQC peaks between the two molecules. The characteristic iZQC and iDQC frequencies along the F1 dimension are marked, where ωw and ωa represent the frequency offsets of water and acetone, respectively.
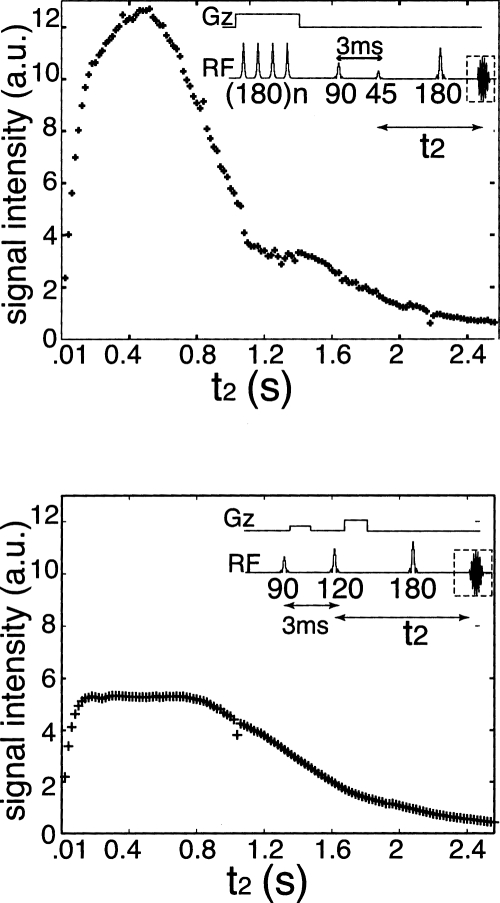
This sequence has clear advantages over the standard CRAZED sequence. In a CRAZED experiment, all n-quantum coherences evolve during t1, but the gradient filter makes only one of these observable (or, in the case of a multi-CRAZED experiment,12, 16 makes only one observable at a time). In this experiment, there are no gradients selecting a particular order of coherence, and all the even orders are simultaneously observable. In the absence of inhomogeneities (or if a π pulse is inserted in the middle of t1) they will all echo at the same time. In an imaging application, this means the contrast will arise from local variations in the magnetization structure, which in turn create spatial Fourier components along axes other than z and decrease the field. Also, the simultaneous refocusing creates a nonlinear signal which is larger than the standard CRAZED signal and can reach almost 100% the value of the transverse magnetization if an appropriate value of ϕ is chosen. For example, for t2∕τd=10.5, θ=π∕2, and ϕ=81°, the nonlinear signal reaches a value of 98% of the equilibrium magnetization. This is a case that can easily be reached with hyperpolarized samples, where the polarization of a concentrated sample can be pushed beyond the Boltzmann distribution. For smaller values of t2∕τd the initial signal rise with t2 is more important, and the value of theta which maximizes this gives a maximum signal of of the equilibrium magnetization, well above the maximum signal attainable with the standard CRAZED sequence (Fig. 4).
Figure 4.
Comparison of the signal intensity generated with the ZEBRA sequence and the iDQC-CRAZED sequence. In both experiments, a short t1=3 ms and an eight step phase cycle on the 90 (x,−x,x,−x,y,−y,y,−y), the mixing pulses (x,−x,−x,x,x,−x,−x,x), and the receiver (x,x,x,x,−x,−x,−x,−x) were used to remove any single- or zero-quantum contaminations from the signal. The evolution time t2 was stepped from 10 ms to 2.5 s.
In addition to having a different maximum, the evolution of the ZEBRA signal is also different. In this case, only even orders of coherence contribute to the signal, since odd orders sum to zero across the sample. Moreover, in the homonuclear case and in the absence of inhomogeneities, frequency offsets, and relaxation, the characteristic Bessel function evolution of a CRAZED experiment is replaced with a sinusoidal signal growth. Mathematically, the sum of all the even orders of Bessel functions reduces to a single sinusoidal function evolution.
The faster signal growth of the ZEBRA experiment is another advantage over the standard CRAZED. In the absence of inhomogeneity and resonance offset, and for t2⪡τd, the signal grows as
| (5) |
For the ZEBRA experiment, this expression depends on ϕ,
| (6) |
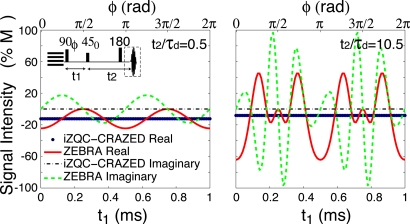
This expression is maximized for ϕ equal to 0 or π. For these values, the signal growth is bigger than the growth for the standard iDQC-CRAZED sequence and is twice as fast as the growth of the most efficient iZQC-CRAZED experiment (the iZQC-CRAZED sequence with ϕ=π∕4). Figure 5 shows this growth for two different values of t2∕τd, as a function of ϕ for very short evolution time t1, or equivalently as a function of the delay t1 between the first two pulses with a small resonance offset (1 kHz) and fixed ϕ=0. Note that the only resonance frequency in this system would correspond to one single sine wave cycle over this x-axis range. Instead, the long- t2 dynamics in particular shows very high frequency modulation and vastly larger signals than conventional sequences.
Figure 5.
Comparison of the signal growth for optimized iZQC-CRAZED and ZEBRA sequences. A resonance offset of 1 kHz is assumed. The calculation is the same for short t1 and variable interpulse phase (ϕ in our case), or for variable t1 and fixed ϕ=0. In the ZEBRA sequence, the signal growth is ϕ dependent. For ϕ=0 and short t1 values the growth is twice as fast as the best iZQC sequence (90-GT-45) and nearly twice as fast as the best iDQC-CRAZED sequence (90-GT-120-2GT). For large values of t2∕τd (readily accessible in samples with strong magnetization) the nonlinear dynamics is very complex and readily produces much larger signals than would be available in iZQC-CRAZED or iDQC CRAZED.
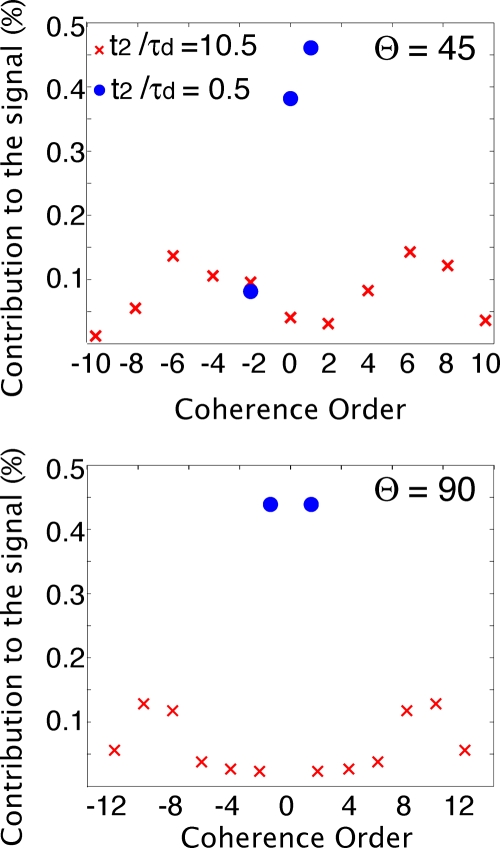
A Fourier transform of Eq. 6 with respect to ϕ will give the n-quantum coherence spectrum of the signal acquired at a given echo time. At any given echo time, the observed signal is composed of some distribution of coherence orders. For small values of t2∕τd, since there is only time for a single dipolar coupling to act, the signal is mainly from ±iDQC for ϕ=π∕2, and ±iDQC and iZQC for ϕ≠π∕2. At larger values of t2∕τd, readily accessible with high fields or hyperpolarized samples, the contribution of higher order intermolecular coherences readily dominates (Fig. 6). This explains the bizarre dynamics in Fig. 5: very high order intermolecular coherences are efficiently pumped and detected. These coherences can be acquired separately, as in a standard CRAZED sequence, or they can be refocused together if a refocusing pulse is placed in the middle of the t1 evolution. These higher order of coherences are much more sensitive to local variations in the dipolar field (due to magnetization density or susceptibility variations) than are the iZQC or iDQC coherences, and thus would likely be useful for enhancing edge effects in imaging applications.
Figure 6.
Fourier transform of the signal from the ZEBRA sequence, 90x−t1−θϕ−t2 for a sample without inhomogeneous broadening, for two different values of t2∕τd and two different values of θ. It is clear that the signal has different components for different values of t2∕τd. For small values of t2∕τd, most of the signal comes from the lower coherence orders, while for larger values of t2∕τd, higher orders become more important.
In conclusion, this article proposes a new approach to generating nonlinear signals from the small dipolar couplings between distant spins. We have experimentally demonstrated signals that are substantially larger than those achievable with the optimal CRAZED experiment, and in principle can be as large as the full equilibrium magnetization. This constitutes a clear advantage, especially because it will extend the use of nonlinear effects in magnetic resonance imaging (MRI).
ACKNOWLEDGMENTS
This work was supported by the NIH R01 EB002122 and NIH F31 EB005979.
References
- Hayden M. E., Baudin E., Tastevin G., and Nacher P. J., Phys. Rev. Lett. 10.1103/PhysRevLett.99.137602 99, 137602 (2007). [DOI] [PubMed] [Google Scholar]
- Ledbetter M. P., Savukov I. M., and Romalis M. V., Phys. Rev. Lett. 10.1103/PhysRevLett.94.060801 94, 060801 (2005). [DOI] [PubMed] [Google Scholar]
- Ledbetter M. P. and Romalis M. V., Phys. Rev. Lett. 10.1103/PhysRevLett.89.287601 89, 287601 (2002). [DOI] [PubMed] [Google Scholar]
- Deville G., Bernier M., and Delrieux J. M., Phys. Rev. B 10.1103/PhysRevB.19.5666 19, 5666 (1979). [DOI] [Google Scholar]
- Einzel D., Eska G., Hirayoshi Y., Kopp T., and Wolfe P., Phys. Rev. Lett. 10.1103/PhysRevLett.53.2312 53, 2312 (1984). [DOI] [Google Scholar]
- Bowtell R., Bowley R. M., and Glover P., J. Magn. Reson. (1969-1992) 10.1016/0022-2364(90)90297-M 88, 643 (1990). [DOI] [Google Scholar]
- He Q., Richter W., Vathyam S., and Warren W. S., J. Chem. Phys. 10.1063/1.464770 98, 6779 (1993). [DOI] [Google Scholar]
- Warren W. S., Richter W., Andreotti A. H., and B. T.FarmerII, Science 10.1126/science.8266096 262, 2005 (1993). [DOI] [PubMed] [Google Scholar]
- Ahn S., Lisitza N., and Warren W. S., J. Magn. Reson. 10.1006/jmre.1998.1461 133, 266 (1998). [DOI] [PubMed] [Google Scholar]
- Richter W., Lee S., Warren W. S., and He Q., Science 10.1126/science.7839140 267, 654 (1995). [DOI] [PubMed] [Google Scholar]
- Warren W. S., Ahn S., Mesher M., Garwood M., Ugurbil K., Richter W., Rizi R. R., Hopkins J., and Leigh J. S., Science 10.1126/science.281.5374.247 281, 247 (1998). [DOI] [PubMed] [Google Scholar]
- Bowtell R., J. Magn. Reson. (1969-1992) 10.1016/0022-2364(92)90361-A 100, 1 (1992). [DOI] [Google Scholar]
- Jeener J., Vlassenbroek A., and Broekaert P., J. Chem. Phys. 10.1063/1.469808 103, 1309 (1995). [DOI] [Google Scholar]
- Vlassenbroek A., Jeener J., and Broekaert P., J. Chem. Phys. 10.1063/1.470468 103, 5886 (1995). [DOI] [Google Scholar]
- Lee S., Richter W., Vathyam S., and Warren W. S., J. Chem. Phys. 10.1063/1.471968 105, 874 (1996). [DOI] [Google Scholar]
- Tang X., Ong H., Shannon K., and Warren W. S., Magn. Reson. Imaging 21, 114 (2003). [DOI] [PubMed] [Google Scholar]


