

Abstract
Combining a modified two-step chemical etch method with equations to predict etch parameters and photon-plasmon phase-matching resulted in single-mode tapered optical fibers (TOFs) to optimize electromagnetic field enhancement. The phase-matching equation was used to identify the angle of incidence near the TOF cutoff radius at which surface plasmon resonance (SPR) is maximized. The axisymmetric Young–Laplace equation was used to predict the angle of incidence from the fabrication of a TOF via chemical etching. An optimal cone angle of 20.0°, angles of incidence averaging (81.6 ± 1.9)°, and tip diameters of (80.0 ± 14.1) nm were achieved through a two-step etching process. These TOF characteristics maximize SPR excitation and field enhancement. The refractive index for optimized SPR excitation in the fabricated TOFs at a wavelength of 650 nm was found to be 1.343.
Introduction
Single-mode tapered optical fibers (TOFs) are important in near-field scanning optical microscopy (NSOM), Raman and IR spectroscopy, and biosensing.1-4 The NSOM diffraction limit is reduced by decreasing the tip diameter of the tapered probe through which an electromagnetic wavelength is transmitted and minimizing the distance from the tip to the sample surface.2,3,5 Lateral resolution in NSOM is as low as 25−50 nm,2,4 whereas in conventional optical microscopy the diffraction limit is 200 nm.4 Coating the TOF probe with metal in spectroscopic applications allows resonant photons incident upon the metal surface to induce collective oscillation of delocalized metal electrons at the dielectric/metal interface, known as surface plasmon polaritons (SPPs).4,6-10 SPPs confined to the interface that propagate toward the apex of the TOF are concentrated, enhancing the resulting electric field and thereby increasing the potential signal-to-noise ratio (SNR) in Raman and IR spectroscopy.10 Applications using SPP-active TOFs for biosensing are in development.2,3
Specifying an appropriate fabrication method for TOFs is key to achieving the desired resolution and SPP induction. Two common ways to fabricate TOFs are CO2 laser-heated pulling1,11 and hydrofluoric (HF)–silicone oil etching.1,12,13 Burgos et al.1 reported that chemical etching yielded larger cone angles of 75−90° and smaller tip diameters of 50−150 nm, compared to laser pulling that produced cone angles of 25−30° and tip diameters of 100−200 nm. The reported effects of TOF tip diameter, length, and cone angle (e.g., angle α in Figure 1) on electric field enhancement and the wavelength of resonant peak enhancement suggest the development of an HF–silicone oil etch method for SPP-active TOFs.14 Sharp tips with a radius of curvature of ≥20 nm increase the charge density and field enhancement15 and provide simple, single-peaked spectra (albeit at 4-fold-lower maximum intensity) relative to that of blunt tips with radii of 50−100 nm for wavelengths of 700−1050 nm.16 Small cone angles preserve the adiabatic geometrical optics approximation (GOA) and exhibit low reflective losses but result in long tapered tips with significant dissipative losses. Increasing cone angle increases reflection, with a possible net effect of increasing the local field enhancement. An electric field enhancement ratio of 17 was reported for a TOF with a 10° cone angle and 10 nm tip diameter.17 SPP field enhancement of up to 2.0 × 10⁴ % relative intensity was reported for a TOF with a 22.6° cone angle and a 40 nm tip diameter compared to an NSOM tip with a 90° cone angle and a 60 nm tip diameter.18 An integrated chemical etch approach was developed to fabricate TOFs that approach the reported optimal values of a 22.6° cone angle and a 40 nm tip diameter.
Figure 1.

Schematic of the contact angle (β) in relation to the tapered tip and meniscus, where the dotted line that forms angle α is the tip produced by etching. With the assumption that the laser is parallel to the fiber length before it reflects off of the critical angle of incidence (θ) under the phase-matching condition, 90 – = θ and θ = 180 – β – φ.19 The line AB is the tangent line at the local slope, dz/dr. Through the geometric relationship, tan−1(dz/dr) is identical to the value of θ within the fiber (schematic not drawn to scale).
Several methods are reported for fabricating TOFs.1,11,12,19 However, no fabrication method has been identified that produces the tip diameter, cone angle, and angle of incidence (e.g., angle θ in Figure 1) in TOFs to optimize SPP excitation for a practical range of adjacent dielectric media. Variations in local angles of incidence of fabricated TOFs have not been rigorously characterized. Optimal excitation of SPPs in TOFs requires precise phase-matching by producing an angle of incidence that maximizes wavelength dependent SPP coupling for specific dielectric constants of selected metal and adjacent dielectrics.
A novel, integrated approach is presented to identify the critical angle for phase matching on a TOF, predict the angle of incidence obtained by fabrication using the Young–Laplace equation, and analyze SEM images of the TOFs to determine the local angle of incidence of etched TOF above the cutoff diameter and the cone angle below the cutoff diameter. Using the mean angle of incidence measured by this method, the value of the refractive index for the adjacent dielectric that satisfies the phase-matching condition near the tip of the TOF to maximize the SPP intensity at the excitation wavelength was determined. Parameters in the Young–Laplace model that may be varied to select an etchant composition to yield a desired angle of incidence were identified. A modified etching procedure from Maruyama et al.11 was used to obtain TOFs that have phase-matching critical angles at an excitation wavelength of 650 nm. Experimentally obtained TOF profiles are compared with model profiles from the Young–Laplace axisymmetric equation. This approach for obtaining the desired critical angle is important in identifying the parameters for optimal SPP excitation near the TOF tip. This maximization of SPP field enhancement allows greater sensitivity of individual TOFs in detection and biosensor applications.
Phase-Matching Criteria
In the tapered region of the optical fiber, propagating photons at a wavelength, λ, within the core dielectric are back-reflected or refracted when they reached the cutoff radius (Rc), where η represents the refractive index, subscript c identifies the fiber core, and subscript s identifies the fiber cladding.20,21 The fabricated tapered fibers have the cladding removed, so ηs is set equal to 1 for air. This results in low detectable transmission levels at the tip. Photons can excite SPP on an external noble metal surface via attenuated total reflection (ATR) prior to Rc. SPP corresponds to exponentially damped electromagnetic waves propagating at the interface of a metal surface and an adjacent dielectric. Optimal excitation of SPP requires a phase-matching condition expressed by
| (1) |
where θ is the critical angle for incident light in degrees (see Figure 1), εm is the wavelength-dependent dielectric constant of Au, and εc is the dielectric constant of the medium surrounding the TOF.19 The dielectric constant is related to the refractive index by εc = η2.
Young–Laplace Modeling of TOF
To select a chemical etch method to produce a TOF with the desired critical angle, we used the Young–Laplace axisymmetric ordinary differential equation to predict the etched fiber radius, ro, and the meniscus height, z, during etching to determine the theoretical shape of the tapered tip13,23,24
| (2) |
where r and z are the radial and axial coordinates, respectively (Figure 1) and r represents the radial displacement of the meniscus from the center of the fiber (center corresponds to r = 0) along the z axis (surface of undisturbed etchant fluid corresponds to z = 0). Δρ is the difference in density between the HF etchant (49% HF in H2O) and silicone oil (Δρ = 204 kg/m3 from MSDS datasheets), g is the gravitational constant (9.8 m/s2), and σ is the surface tension (0.047 N/m for silicone oil/49% HF), which was assumed to be constant by Wong et al.13 Using the angle that occurs between the meniscus at the point it intersects the fiber surface and the r axis, φ (Figure 1), eq 2 is solved with the boundary conditions z ≡ 0 as r → ∞ and dz/dr ≡ −tan φ at r ≡ ro, where ro corresponds to the radial displacement at which the meniscus is in contact with the surface of the fiber. The general form of the Young–Laplace equation is derived to describe the profile of the meniscus curve:
| (3) |
In eq 3, r′ ≡ r/ro is the normalized etched fiber radial displacement, and z′ ≡ z/ ro is the height of the meniscus at ro, the etched radial coordinate. For the case when r′ = 1, the Young–Laplace equation can be used to predict the profile of the fiber by calculating the maximum height of the meniscus as a function of ro:
| (4) |
Equation 4 identifies the vertical meniscus height at the point at which the meniscus intersects the etched surface of the fiber. The radial position of the etched surface of the fiber given by ro at each axial height z decreases during the etch to form a conical tip profile.
In eq 4, ε ≡ ro/lo is the perturbation parameter where lo ≡ (σ/Δρg)0.5 and γ is the Euler constant (0.5772). As the radius of the etched fiber (ro) decreases along the length of the fiber during etching, the surface area of the fiber per unit volume of the surrounding meniscus decreases, resulting in a decrease in the meniscus height. For an etch with a 49% HF and silicone oil overlayer, the observed value of φ was reported by Wong et al. to be 73.0° when the meniscus is attached to the surface of the cylindrically shaped fiber and φ ≤ 90°.13 During etching, it was assumed that tapering of the fiber occurred above the descending meniscus until the cylindrically shaped fiber was etched away and formed the tip of the tapered cone. This assumption by Wong et al. implied that after the tip is formed the meniscus is no longer in contact with the fiber (Figure 1), hence angle φ remains constant.
Experimental Methods
Single-mode optical fibers (F-SA, Newport, Irvine, CA) that consisted of a 3.4 μm i.d. silica (SiO2) core doped with germanium dioxide (GeO2) clad with fused silica with a diameter of 125 ± 1 μm and coated with acrylate buffer to a final outer diameter of 245 ± 12 μm were used for etching. The acrylate buffer was mechanically stripped ∼0.5 cm from the end of the fiber to expose the cladding using a mechanical stripper (T06S13, Thorlabs, Newton, NJ). The first step in the etching procedure was a silicone oil/ HF etch using 49% stock HF and an overlayer of Dow Corning silicone oil for 50 min.13 HF exposure can cause severe burns or death. HF handling requires the use of chemically compatible personal protective equipment (e.g., nonventing chemical safety goggles, face shield, chemical apron, gloves, and a designated ventilation hood). The fibers were washed with deionized water, acetone, and methanol, respectively, followed by a second etch with buffered HF (BHF), which had a volumetric ratio of 4:1:3 (40 wt % NH4F/49% HF/H2O) for 60 min.12 Etching experiments were done under ambient conditions. The fibers were etched using silicone/49% HF in a polypropylene container, as shown in Figure 2. The immersion depth of the fiber at the beginning of etching could not be measured because of the murky appearance of the meniscus. The approximate length of the optical fiber in contact with the HF solution was about 2 mm. During etching, the meniscus height at the interface decreased as the fiber surface area was etched away. This mechanism was the driving force for the tapered geometry of the tip.
Figure 2.

Optical fiber etch in silicone oil/49% HF inside the polypropylene tube. The fiber was supported by threading it through a glass capillary (not drawn to scale). The source of the inset etching schematic is Wong et al.13
High-resolution images for the tip diameters and cone angles of TOFs were obtained by SEM. First, a layer of conductive Au metal was deposited onto the TOF using a Denton Discovery Sputtering System (Denton Vacuum, Moorestown, NJ), with a chamber pressure of 2 × 10⁻⁶ mTorr and a voltage of 50 W. The Au target was presputtered for 1 min, and the sputtering rate was ∼20 nm Au/min. The tapered tips were sputtered for 2 min to yield a 40 ± 10 nm Au film thickness. SEM images of Au-coated TOFs were obtained (Philips XL30 ESEM FEG, FEI, Hillsboro, Oregon) in low vacuum mode. The setting for low vacuum mode was 1−1.4 Torr in vacuum, secondary electron mode with a beam power of 10 kV.
Results
Phase Matching
Table 1 shows calculated values of Rc for optical fibers used herein, which have ηc = 1.466, as a function of photon excitation wavelength, λ, for 550 nm ≤ λ ≤ 750 nm. Wavelength-dependent dielectric constants for Au reported by Innes et al.20 were used to calculate a range of values for θ using eq 1 for 550 nm ≤ λ ≤ 750 nm. Values of θ < 90° satisfy the phase-matching condition and yield physically realizable cone angles, α, given by α = 180−2θ. Table 1 shows that phase-matching generates SPP at λ ≥ 650 nm for the selected optical fibers.
Table 1.
Calculated Values for θ Based on Equation 1a
| operating wavelength (nm) | angle θ (deg) for Au, in water | cone angle for Au film | Rc (μm) |
|---|---|---|---|
| 550 | N/A | N/A | 0.196 |
| 600 | N/A | N/A | 0.214 |
| 650 | 78.3 | 23.4 | 0.232 |
| 700 | 73.6 | 32.8 | 0.250 |
| 750 | 71.6 | 36.8 | 0.268 |
εc = 1.769 for the water medium, and ηc = 1.466. N/A indicates that at that this wavelength and for this medium it is not possible to match the phases for the surface plasmon. The cone angle is calculated to be 180−2θ.
Tip-Angle Analysis
Angles of incidence at the fiber tip were determined from SEM images imported into Matlab 2007a with the image processing toolbox. A ruler size was specified to measure the moving average value of θ, where θ = tan−1(dz/dr), as illustrated in Figure 1. Figure 1 shows that tan(θ) is the local slope of the line AB, whose normal defines the angle of incidence at that point. Four ruler sizes, 0.50 μm (2168 data points), 1.4 μm (3106 data points), 1.7 μm (3092 data points), and 3.0 μm (2862 data points), were used separately to calculate the values of local average θ between the cutoff radius and the radius of the fiber core. The ruler size corresponded to the length of the tapered region of interest, over which data points were fitted to a straight line (e.g., line AB in Figure 1) to obtain the mean value of the local angle of incidence (and cone angle). Values of dz and dr were obtained for the calculation of the value of θ. Each data point in Figure 3 corresponds to the average slope at the midpoint of the segment measured by the ruler. The ruler slid along the tapered region one pixel at a time to obtain the local average values of θ along the tapered tip, yielding smoother output for larger rulers. In comparing the output data, t test results showed that the average values of θ did not vary significantly with different rulers at a confidence interval of 95%.
Figure 3.
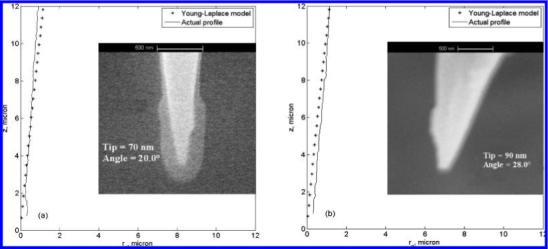
SEM pictures of two TOF samples (a) and (b). Both TOFs had a 50 min first etch and a 60 min second etch in BHF (4:1:3). Tip diameters and approximate cone angles at the tip were measured. The halo feature around the tip in sample a is carbon artifact due to the environment in the SEM chamber. Plot of the actual tip profile with a theoretical prediction based on the Young–Laplace model in which φ = 82°, Δρ = 91.9 kg/m3, and σ = 0.092 N/m were used for eq 4 to account for the second etch.
SEM image analysis of TOFs produced using the same method showed variations in local θ values and average θ values between different tips. The standard deviation of the average θ values from different samples was larger than the deviation from different ruler sizes for the same sample. The average θ value between different TOFs produced by the same method was 81.6 ± 1.9° and varied by ≤ 3.0°. This variance was attributed to the immersion depth of the sample during etching, with a target immersion depth of 2 mm. During etching, the consumption of HF molecules led to a decrease in HF concentration near the fiber surface over time. This reduced the etch rate in proportion to the transport of etch byproducts (silica particle) away from the surface and the diffusion of fresh HF molecules to the surface.25,26 Deeper immersion exposed more material to be etched away than shallow immersion, resulting in a thicker layer of etched silica adjacent to the surface of the fiber acting as a barrier to the diffusion of HF molecules. This decreased the etching rate. For shallow immersion, less material is being etched, and overetching occurred sooner, which increases the cone angle. Therefore, the immersion depth affects the meniscus profile characterized by eq 4 and ultimately the cone angle of the TOF.
Young–Laplace modeling was refined by taking into account that the meniscus was still in contact with the fiber after the formation of the tip. Because of the silica particles accumulated at the surface of the fiber from the acid etch, φ is estimated to be 82° for silica particles at the water–oil meniscus.27 The local surface tension also changed with the high concentration of silica particles on the surface of the fiber. The local surface tension was estimated to be 2 times higher than the original surface tension because of the presence of silica particles in the solution.28 Figure 3a,b shows two of the actual axisymmetric tip profiles obtained by the Matlab program and the model profile using eq 4. Appropriate values of σ (0.092 N/m) and Δρ (91.9 kg/m3) were used in the Young–Laplace model to account for the second etch with BHF. A sensitivity analysis showed that an increase in the surface tension for the second etch resulted in a steeper tip profile than the original Young–Laplace profile. A decrease in Δρ for the buffered etch solution compared to that of the original solution was not a strong factor in the presence of the surface tension increase.
The Young–Laplace profile in Figure 3a is in good agreement with the actual profile; Figure 3b shows that the model profile and the actual profile had fair agreement. Although Figure 3a,b shows the Young–Laplace model to be straight lines on the given scales, the actual tips exhibited slightly convex tapered profiles. The convex tapered region may be due to the diffusion driving force affecting the mass transport and the etch rate along the meniscus height as a function of time. Etching occurred faster near the fiber cladding than at the core because of its lower density. A faster etch rate results in a more rapid drop in the meniscus height. The change in the rate of drop in the meniscus height may be an additional factor in the convex profiles. Cone angle and etching time were varied to determine that the rate of change of the cone angle is minimal after 90 min of etching.
Actual values of θ for two TOF samples from Rc = 0.14 μm to the core radius of 1.70 μm are listed in Table 2. For TOF sample a, the local value of θ ranged from 81.9 ± 0.8° to 83.1 ± 2.4°, whereas in TOF sample b local values of θ ranged from 71.5 ± 9.9° to 81.7 ± 2.9°. The values of the radii in Table 2 correspond to the region along the tapered tip where SPP could occur. Note that for TOF (b), the value of θ at Rc was significantly different from the other values of θ. This can be attributed to the relatively nonuniform film from the Au sputtering required for SEM imaging (Figure 3b) that gave rise to a greater standard deviation. Coating small 3D surfaces evenly using Au sputtering is difficult. We are developing an electroless plating method that would produce a smooth Au film and allow us to distinguish nonuniformities in the film from those that may arise during the etching process.28 The values in Table 2 were mostly in the low 80.0° range with an average of about 82.0°. Phase-matching parameters that correspond to the θ values produced are found from eq 1. This yields a required refractive index of 1.343, which is obtained from a solution of 8.5 wt % glycerol in water. On the basis of the Au dielectric constant at the desired wavelength of SPP excitation, the refractive index of the glycerol solution can be adjusted to yield the desired value of θ by varying the glycerol concentration. Chemical and biological sensors can be made to probe these solutions by detecting minute changes in the refractive index.19,30
Table 2.
Calculation of Actual Local Critical Angle (θ) from TOFs (a) and (b) (Figure 3) Based on SEM Imagesa
| TOF local θ (deg) |
||
|---|---|---|
| radius (μm) | (a) | (b) |
| 1.7 | 82.5 ± 2.4 | 81.3 ± 1.6 |
| 1 | 81.9 ± 0.8 | 79.4 ± 1.5 |
| 0.5 | 82.5 ± 0.9 | 80.0 ± 2.0 |
| 0.3 | 82.3 ± 0.9 | 81.7 ± 2.9 |
| 0.14 | 83.1 ± 2.4 | 71.5 ± 9.9 |
The radius ranged from the cut-off radius (0.14 μm) to the radius of the core (1.7 μm).
Conclusions
The average angle of incidence predicted from the Young–Laplace model was 83.5 ± 0.3°. TOFs with a local cone angle of 20.0° near the tip as shown in Figure 3a were obtained. This was close to the optimal cone angle value for SPP propagation to the apex of the tip reported by Quong et al.18 Results were obtained from this chemical etching method to fabricate six TOFs with local cone angles of 24.0 ± 5.7°. High-resolution SEM on two TOFs showed a tip diameter of 80.0 ± 14.1 nm. Previous experiments determined that the etch rate of 49% HF at the fiber core is about 1.5 μm/min. Using only the first etching procedure overetched the fine tip of the TOF, resulting in tips ranging from 250 nm to 1 μm in diameter. The BHF second etch appeared to facilitate the reduction in tip diameter. BHF was buffered with 40 wt % NH4F solution, and the reported etch rate at the fiber core was ∼100 nm/min.31 The buffered etch was better controlled and not as aggressive as the 49% HF etchant. The axisymmetric profile of TOFs etched with BHF was comparable to that obtained from the Young–Laplace model, but the Young-Laplace prediction accounted for only the initial etch, not the second. Given an operating wavelength of 650 nm, TOFs with an average angle of incidence of 81.6 ± 1.9° near the tip were fabricated. Phase-matching criteria were satisfied by applying the average angle of incidence for θ in eq 3. The resulting refractive index of 1.343 was achieved with a 8.5 wt % glycerol solution. On the basis of the phase-matching equation and the characterization of the angle of incidence, the cone angle and tip diameter for the optimal field enhancement of SPR were obtained for TOFs.
Supplementary Material
Acknowledgment
We thank Benjamin Taylor for contributing the Matlab programming, Analía Dall’ Asén for helpful discussions, Randy Polson at Dixon Laser Institute for technical assistance, and the University of Utah Microfabrication Laboratory for providing essential resources. This work was supported in part by NIH grant EB004886, the National Institute of Biomedical Imaging and Bioengineering, NSF ANN NER grant 58501243, and the University of Utah Seed Grant 51003237.
Footnotes
Supporting Information Available: Low-resolution SEM images of additional TOFs. This material is available free of charge via the Internet at http://pubs.acs.org.
References
- 1.Burgos P, Lu Z, Ianoul A, Hnatovsky C, Viriot M, Johnston LJ, Taylor RS. J. Microsci. 2003;211:37. doi: 10.1046/j.1365-2818.2003.01197.x. [DOI] [PubMed] [Google Scholar]
- 2.Rasmussen A, Deckert V. Anal. Bioanal. Chem. 2005;381:165. doi: 10.1007/s00216-004-2896-3. [DOI] [PubMed] [Google Scholar]
- 3.Bosch ME, Sanchez AJR, Rojas FS, Ojeda CB. Sensors. 2007;7:797. [Google Scholar]
- 4.Frey HG, Keilmann F, Kriele A, Guckenberger R. Appl. Phys. Lett. 2002;81:5030. [Google Scholar]
- 5.Akhremitchev BB, Sun Y, Stebounova L, Walker GC. Langmuir. 2002;18:5325. [Google Scholar]
- 6.Keilmann F. J. Microsci. 1999;194:567. [Google Scholar]
- 7.Janunts NA, Baghdasaryan KS, Nerkararyan Kh. V., Hecht B. Opt. Commun. 2005;253:118. [Google Scholar]
- 8.Novotny L, Stranick SJ. Annu. Rev. Phys. Chem. 2006;57:303. doi: 10.1146/annurev.physchem.56.092503.141236. [DOI] [PubMed] [Google Scholar]
- 9.Babadjanyan AJ, Margaryan NL, Nerkararyan Kh.V. J. Appl. Phys. 2000;87:3785. [Google Scholar]
- 10.Stockman MI. Phys. Rev. Lett. 2004;93:37404/1. doi: 10.1103/PhysRevLett.93.137404. [DOI] [PubMed] [Google Scholar]
- 11.Maruyama K, Ohkawa H, Ogawa S, Ueda A, Niwa O, Suzuki K. Anal. Chem. 2006;78:1904. doi: 10.1021/ac0502549. [DOI] [PubMed] [Google Scholar]
- 12.Mononobe S, Uma Maheswari R, Ohtsu M. Opt. Exp. 1997;1:229–233. doi: 10.1364/oe.1.000229. [DOI] [PubMed] [Google Scholar]
- 13.Wong PK, Wang TH, Ho CM. Hilton Head 2002 Solid State Sensor, Actuator and Microsystems Workshop; South Carolina. 2002.pp. 94–97. [Google Scholar]
- 14.Dechant A, Dew SK, Irvine SE, Elezzabi AY. Appl. Phys. Lett. 2005;86:013102/1. [Google Scholar]
- 15.Bachelot R, H'Dhili F, Barchiesi D, Lerondel G, Fikri R, Royer P, Landraud N, Peretti J, Chaput F, Lampel G, Boilot J, Lahlil K. J. Appl. Phys. 2003;94:2060. [Google Scholar]
- 16.Dawson P, Boyle MG. J. Opt. A: Pure App. Opt. 2006;8:s219. [Google Scholar]
- 17.Goncharenko AV, Dvoynenko MM, Chang HC. Appl. Phys. Lett. 2006;88:104101. [Google Scholar]
- 18.Quong MC, Elezzabi AY. Optics Express. 2007;15:10163. doi: 10.1364/oe.15.010163. [DOI] [PubMed] [Google Scholar]
- 19.Chang Y, Chen Y, Kuo H, Wei P. J. Biomed. Opt. 2006;11:0140321. doi: 10.1117/1.2165171. [DOI] [PubMed] [Google Scholar]
- 20.Innes RA, Sambles JR. J.Phys. F: Met. Phys. 1987;17:277. [Google Scholar]
- 21.Masuda S, Iwama T, Daido Y. Appl. Opt. 1981;20:4035. doi: 10.1364/AO.20.004035. [DOI] [PubMed] [Google Scholar]
- 22.Schicketanz DW, Eoll CK. Appl. Opt. 1990;29:3916. doi: 10.1364/AO.29.003916. [DOI] [PubMed] [Google Scholar]
- 23.James DF. J. Fluid Mech. 1974;63:657. [Google Scholar]
- 24.Lo LL. J. Fluid Mech. 1983;132:65. [Google Scholar]
- 25.Stöckle R, Fokas C, Deckert V, Zenobi R. Appl. Phys. Lett. 1990;75:160. [Google Scholar]
- 26.Lee MT. J. Am. Ceram. Soc. 1984;67:C21. [Google Scholar]
- 27.Cayre OJ, Paunov VN. Langmuir. 2004;20:9594. doi: 10.1021/la0489615. [DOI] [PubMed] [Google Scholar]
- 28.Petsev DK, editor. Emulsions: Structure, Stability and Interactions. Elsevier; Amsterdam: 2004. p. 127. [Google Scholar]
- 29.Ahn W, Taylor B, Dall'Asen AG, Roper DK. Langmuir. 2008;24:4174. doi: 10.1021/la703064m. [DOI] [PubMed] [Google Scholar]
- 30.Stewart CE, Hooper IR, Sambles JR. J. Phys. D: Appl. Phys. 2008;41:105408. [Google Scholar]
- 31.Mononobe S, Ohtsu M. J. Lightwave Technol. 1996;14:2231. [Google Scholar]
Associated Data
This section collects any data citations, data availability statements, or supplementary materials included in this article.