

Abstract
Purpose:
To describe an initial experience imaging the human hippocampus in vivo using a 7T magnetic resonance (MR) scanner and a protocol developed for very high field neuroimaging.
Materials and Methods:
Six normal subjects were scanned on a 7T whole body MR scanner equipped with a 16-channel head coil. Sequences included a full field of view T1-weighted 3D turbo field echo (T1W 3D TFE: time of acquisition (TA) = 08:58), T2*-weighted 2D fast field echo (T2*W 2D FFE: TA = 05:20), and susceptibility-weighted imaging (SWI: TA = 04:20). SWI data were postprocessed using a minimum intensity projection (minIP) algorithm. Total imaging time was 23 minutes.
Results:
T1W 3D TFE images with 700 μm isotropic voxels provided excellent anatomic depiction of macroscopic hippocampal structures. T2*W 2D FFE images with 0.5 mm in-plane resolution and 2.5 mm slice thickness provided clear discrimination of the Cornu Ammonis and the compilation of adjacent sublayers of the hippocampus. SWI images (0.5 mm in-plane resolution, 1.0 mm slice thickness) delineated microvenous anatomy of the hippocampus.
Conclusion:
In vivo 7T MR imaging can take advantage of higher signal-to-noise and novel contrast mechanisms to provide increased conspicuity of hippocampal anatomy.
Keywords: hippocampal anatomy, ultrahigh-field MR imaging, 7T, susceptibility-weighted imaging
The human hippocampus is among the most well-studied structures in the brain because of its important functional role in memory processing and learning, its remarkable neuronal cell plasticity, and its involvement in epilepsy and neurodegenerative disease processes. The ability to portray the structural anatomy of the hippocampus is an important role for neuroimaging.
Very high field magnetic resonance imaging (MRI) scanners (7T and higher) are becoming available, and both theoretical and preliminary experimental results suggest that despite the reduced dispersion of T1 and T2 among different tissues at the higher field strength, the increased inherent MR sensitivity available at 7T (1,2), as well as the potential for higher acceleration factors in parallel imaging (3), can be exploited to provide improved anatomic detail within the time constraints imposed by patient compliance and routine clinical MRI workflow. The aim of the present study was to compare the anatomic detail present in high-resolution in vivo MR images of the hippocampus collected from normal volunteers on a clinical 7T scanner using a recently developed 7T clinical neuroimaging protocol, with ex vivo anatomy. The emphasis was on maintaining clinically realistic sequence scan durations and overall protocol duration.
Hippocampal Anatomy
Phylogenetically one of the oldest structures in the mammalian brain, the hippocampal formation in the human brain extends 4 to 4.5 cm along the mesial temporal lobe (Fig. 1). Within its gross structural confines, the hippocampus is formed by two distinctly interlocking C-shaped layers of neurons: the pyramidal layer (stratum pyramidale) and the dentate gyrus (fascia dentata). The pyramidal layer has been further designated Ammon's horn (Cornu Ammonis, CA). The hippocampus proper forms the superolateral portion and the dentate gyrus contributes to the inferomedial surface of the hippocampal formation. Its border is more specifically named margo denticulatus (margin of the dentate) and has the characteristic toothed appearance of its namesake. The head of the hippocampal formation, its most anterior extent, has been interpreted by early neuroanatomists as resembling the “foot of a goose” (4); thus, it is also known as the pes anserinus, or simply, the pes. Three cortical convolutions known as digitationes hippocampi comprise the “toes” of the pes. The internal and external digitations are in reference to the intraventricular and extraventricular relationship to the adjacent temporal horn (5). The allocortex of the hippocampal formation is comprised of differing cytoarchitecture which forms the six sublayers of the hippocampus and the three sublayers of the dentate (Fig. 2). These sublayers vary in cellularity, neuronal orientation, and vascularity.
Figure 1.

Hippocampal body, gross (left) and schematic (right) coronal-oblique views showing Cornu Ammonis (CA), subfields CA1–4 (1–4), alveus (al), dentate gyrus (d), fimbria (f), fimbriodentate sulcus (fds), hippocampal sulcus (hs), parahippocampal gyrus (phg), basal vein of Rosenthal (bvr), stratum pyramidale (sp), compilation of strata radiatum, lacunosum, and moleculare (srlm), vein of temporal horn (vth), margo denticulatus (md), vein of superficial hippocampal sulcus (vshs), vein of fimbriodentate sulcus (vfds), medial atrial vein (mav), posterior hippocampal artery (pha), middle hippocampal artery (mha), inferior ventricular vein (ivv), posterior cerebral artery (pca), basilar artery (ba), entorhinal area (eh), superficial medullary lamina (sml), subiculum (s).
Figure 2.

Left: Coronal H&E (Hemotoxin and Eosin) stained sections through the hippocampal body with enlargement of boxed area (right) showing alveus (1), stratum oriens (2), stratum pyramidale (3), stratum radiatum (4), stratum lacunosum (5), stratum moleculare (6) of Cornu Ammonis, stratum moleculare (7) of dentate gyrus, stratum granulosum (8), polymorphic layer (9), sulcal intrahippocampal vein (10), subfields of Cornu Ammonis (CA1–CA4), fimbria (f), dentate gyrus (d), hilar region (h), subiculum (s), artifactual separations during tissue processing (*), vestigial hippocampal sulcus (arrowheads).
Hippocampal MR Imaging
In vivo MR anatomy of hippocampal structures and the limbic lobe have been detailed by Naidich et al (6) using a 1.5T system. Adachi et al (7) found multishot diffusion-weighted imaging superior to conventional T2-weighted imaging in the depiction of hippocampal atrophy in Alzheimer's disease on a 1.5T system. However, visualization of certain hippocampal structures, notably the CA2 subfield and the dentate gyrus, was limited. More recently, Mueller et al (8) measured CA subfields in normal subjects and patients with Alzheimer's disease using high-resolution T2-weighted imaging at 4T. They found reliable discrimination of CA subfields in the hippocampal body and head but limited discrimination of internal architecture of the hippocampal head. Recently, small field of view (FOV) in vitro studies have defined the imaging appearance of the hippocampal cytoarchitecture using high-field MR at 3T (9), 7T (10), 8T (11), and at 9.4T (12). These studies bridge the understanding of hippocampal sublayer histology and the in vivo appearance at ultrahigh-field strength MRI and serve as the basis for understanding imaging characteristics of this complex region at lower field strengths.
Until now, ultrahigh-field in vivo hippocampal imaging has not been described. By using a set of MR imaging sequences that take advantage of the improved signal-to-noise ratio (SNR) and novel contrast of the 7T field strength, while maintaining a clinically acceptable scan time and FOV, we present a technique for bilateral evaluation of internal hippocampal architecture and venous anatomy in vivo. Ultimately, this may lead to a better understanding of the imaging characteristics of hippocampal pathology.
MATERIALS AND METHODS
Under a protocol approved by the Vanderbilt University Medical Center Institutional Review Board, informed consent was obtained from six normal male subjects with an age range of 24–47 years (average age 32). Subjects were scanned on a Philips Achieva 7T whole-body MR scanner (Philips Healthcare, Cleveland, OH) based on a Magnex 90-cm bore magnet equipped with a 16-channel head coil (Nova Medical, Wilmington, MA). For the sequences acquired in this study, the 7T system's whole-body gradient coil performance was restricted to 30 mT/m peak strength and 100 T/m/s peak slew rate. RF power was also limited by the scanner's power monitoring unit to 10W averaged over 30 seconds corresponding to ≈1.6 W/kg head specific absorption rate (SAR) (roughly one-half the Food and Drug Administration [FDA] limit).
MR imaging sequences used in this study (Table 1) were adapted from a protocol recently developed by contributing authors (13) and included inversion prepared T1-weighted 3D turbo field echo (T1W 3D TFE), T2*-weighted 2D fast field echo (T2*W 2D FFE), and susceptibility-weighted imaging (SWI). A SmartScout scan to allow for automated planning of slice locations and a 7T-adapted reference scan to estimate coil sensitivity profiles for parallel imaging acceleration were also acquired.
Table 1.
7T hippocampus imaging protocols
| Name | Orientation | TR | TE | α [°] | FOV (mm × mm × mm) |
Voxel size/ Volume [mm × mm × mm = μI] |
SENSE | WFS [pix] / BW [Hz/pix] |
Other | TA [min:sec] |
|---|---|---|---|---|---|---|---|---|---|---|
| SmartScout | sagittal | 2.7 | 1.3 | 8 | 250 × 250 × 220 | 2.23 × 2.23 × 2.2 = 64.0 | - | 0.568 / 1785.1 | TI/TS/TFE = 1300/5000/425 | 02:07 |
| REF | coronal | 8.0 | 0.85 | 5 | 384 × 256 × 300 | 4.0 × 4.0 × 4.0 = 64.0 | - | 0.486 / 2083.3 | - | 01:55 |
| T1W3DTFE | sagittal | 5.5 | 2.6 | 7 | 246.4 × 246.4 × 173.6 | 0.7 × 0.7 × 0.7 = 0.343 | 2.9 [AP] | 2.000 / 506.6 | TI/TS/TFE = 1300/4500/352 | 08:58 |
| T2*W 2D FFE | coronal | 434 | 11.8 | 40 | 240 × 180 × 150 | 0.5 × 0.5 × 2.5 = 0.625 | 2.0 [RL] | 4.017/252.2 | Slice gap = 0.5 mm | 05:20 |
| SWI | coronal | 22.0 | 14.8 | 12 | 240 × 180 × 150 | 0.5 × 0.5 × 1.0 = 0.250 | 2.0 [RL] | 9.402/ 107.8 | EPI factor = 3 | 04:20 |
Isotropic T1W 3D TFE sequences were acquired with voxel dimensions of 0.7 × 0.7 × 0.7 mm (343 nl). The time of acquisition (TA) was 08:58. The final choices for parameters such as the delay time after inversion preparation (TI), inversion shot interval time (TS), TFE factor, flip angle, and voxel size were made based on qualitative judgments that aimed to improve tissue contrast and overall image quality (eg, the visibly apparent signal increase).
The T2*W 2D FFE sequence consisted of a multislice gradient echo protocol with slice thickness of 2.5 mm with 0.5 mm gap, and in-plane resolution of 0.5 × 0.5 mm. The TA was 5:20. The T2*W 2D FFE sequence provided good contrast between gray and white matter while also highlighting features with differences in T2*. The thick slice provided excellent SNR at the expense of some partial volume effects.
The SWI sequence was a radiofrequency (RF)-spoiled, 3D gradient echo protocol with flow compensation and an echo time (TE) sufficient to generate significant susceptibility weighting (14). In addition to parallel imaging acceleration, the SWI sequence was further accelerated by using a small EPI factor equal to 3, which allowed three gradient echoes to be collected every TR cycle. Postprocessing of SWI magnitude images using minimum intensity projections (minIPs) provided enhanced visualization of the venous structures. In this study, minIPs were generated over 20-mm thick sections (spaced by −19 mm) using a standard tool available on the MR scanner workstation. In the case of images used for venous anatomy identification, no enhancement of the SWI magnitude images was performed using the phase data, as is often performed with SWI (15). One example showing filtered phase images and enhanced SWI magnitude images is presented for comparison. The SWI sequence had an acquired voxel size of 0.5 × 0.5 × 1.0 mm (250 nl) with a TA of 4:20.
RESULTS
In Vivo Imaging at 7T
Figure 3 shows the hippocampal resemblance to a seahorse in both the axial plane and, more notably, the coronal plane using the T1W 3D TFE sequence. Both the T1W 3D TFE and T2*W 2D FFE sequences clearly show the digitationes of the pes and internal hippocampal architecture, which mirrors the gross appearance (Fig. 4). The prominent layer that follows signal characteristics of gray matter within internal and external digitationes of the pes is predominantly composed of the pyramidal cell CA1 subfield of the CA and is bordered superiorly by the thin alveus, which follows white matter signal. The inferior border of the pyramidal layer represents a compilation of the strata radiatum, lacunosum, and moleculare (srlm).
Figure 3.

Axial (a), coronal (b), and sagittal (c) in vivo 7T T1W 3D TFE imaging through the entire hippocampus (left) and body (center and right) showing detailed structures including hippocampal head (H), body (B), tail (T), Cornu Ammonis (CA), alveus (a), subiculum (s), parahippocampal gyrus (phg), and dentate gyrus (d).
Figure 4.

In vivo 7T T2*W 2D FFE (a,d), T1W 3D TFE (b,e) coronal imaging of hippocampal head (top row) and body (bottom row) with comparable slices through gross specimens (c,f) showing the temporal horn of lateral ventricle (th), Cornu Ammonis (CA), alveus (al), amygdala (a), internal digitations of hippocampal head (id), band of Giacomini (bg), uncus (u), uncal sulcus (us), external digitations of hippocampal head (ed), subiculum (s), dentate gyrus (d), composite of strata radiatum, lacunosum, moleculare, and vestigial hippocampal sulcus (srlms), fimbria (f), hippocampal sulcal vein (hsv), and parahippocampal gyrus (pg).
The low signal layer of the srlm in the head condenses posteriorly along the vestigial hippocampal sulcus into a C-shaped band of low signal seen in the hippocampal body, as depicted in Fig. 4 on the T2*W 2D FFE sequence. In the hippocampal body we define this low signal band as “srlms” for strata radiatum, lacunosum, moleculare, and hippocampal sulcus. SWI takes advantage of the increased magnetic susceptibility of venous blood caused by the increased concentration of deoxy-hemoglobin to accentuate small venous structures seen as signal voids (17–19). The sulcal intrahippocampal veins can be seen medially within the vestigial hippocampal sulcus (Figs. 1, 2) and image as exaggerated bands of low signal in continuity with the stratum moleculare (Fig. 5). These veins are shown to be in direct continuity with the C-shaped band of low signal on both the T2*W 2D FFE and SWI sequences, so they also may contribute to imaging characteristics of this region at lower field strength.
Figure 5.

In vivo microvenous anatomy imaged coronally with 7T SWI (a) and reconstructed 20-mm thick minimum intensity projections (minIPs) of the hippocampal head (b) and body regions (c) showing the following venous structures: fimbriodentate vein (fdv), intrahippocampal sulcal vein (isv), inferior ventricular vein (ivv), hippocampal sulcal vein (hsv), basal vein of Rosenthal (bvr), posterior cerebral artery (pca), medial atrial vein (mav), great cerebral vein of Galen (gcv), internal cerebral vein (icv).
Data from the thin slice SWI can be reconstructed using minIPs to visualize various venous interconnections. Using this postprocessing technique, the sulcal intrahippocampal veins can be observed draining into the venous arch of the hippocampal sulcus (Fig. 5). These structures, along with the venous arch of the fimbriodentate sulcus, receive venous tributaries of the hippocampal formation. Phase information was also available in the 2D FFE and 3D SWI datasets and it has been previously demonstrated that phase images can depict tissue contrast and are less vulnerable to static field inhomogeneities (18,19). Figure 6 shows highpass-filtered phase images from both scan types. The highpass-filtering step removes background phase variations caused by sources such as static field inhomogeneity. The hippocampus is visible in both phase images. Magnitude images at the same location are also shown. The SWI magnitude image presented in Fig. 6D is enhanced using a phase mask generated from the highpass-filtered phase image appearing in Fig. 6B. The phase enhancement somewhat increases the contrast between the venous structures and background tissue. For the purposes of venous anatomy identification in this work, the minIPs of nonenhanced SWI magnitude images were sufficient.
Figure 6.
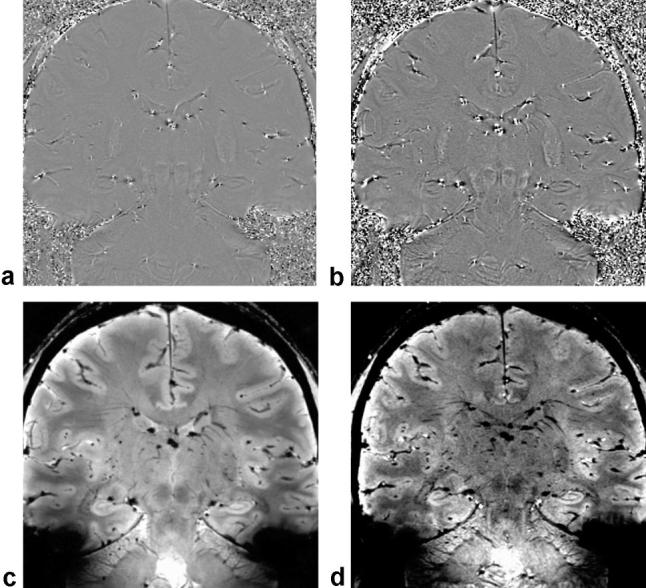
Highpass-filtered phase images from the 2D FFE (a) and 3D SWI (b) sequences. The highpass-filtering step eliminates slowly varying background phase from sources such as static field inhomogeneity. The phase images exhibit discernable gray-white contrast, and the hippocampus is clearly depicted. The srlms is visible as a dark band. The corresponding 2D FFE magnitude image appears in (c) along with the phase-enhanced SWI magnitude in (d). In the phase-enhanced SWI magnitude image the venous structures have slightly increased contrast with respect to background tissue.
Previous in vitro and in vivo 8T MRI studies have revealed cerebral microvasculature in the range of 100 micron-sized veins (20,21). Despite being significantly smaller than the voxel dimensions, these small venous structures can be observed as a consequence of the blooming around the vessels generated by the susceptibility effects of the intravascular deoxyhemoglobin. The present 7T MR study revealed similar small venous structures in the hippocampal formation. The ability of MRI to visualize these small hippocampal veins has not been reported previously. Overall, the T2*W 2D FFE sequence best depicted the hippocampal anatomy at 7T (Fig. 4).
DISCUSSION
Clinical MR imaging at 3T demonstrates the major basic units of the hippocampal formation: the alveus, fimbria, CA, dentate gyrus, subiculum, and parahippocampal gyrus. Delineating these structures can be difficult without knowledge of the sublayer anatomy and signal characteristics of each. Hippocampal sublayer thickness ranges from 0.1–0.5 mm (16), which approaches the resolution limit of practical in vivo full FOV MR imaging at lower field strengths. Using very high field MRI (7T) protocol optimization coupled with an understanding of the in vitro hippocampal anatomy improved anatomic clarity of the hippocampal formation's subcomponents and can be exploited to better understand the imaging appearance at routine clinical field strength. The implications of microvenous imaging of the hippocampus are unknown but may be useful in the evaluation of pathology linked to metabolic or vascular events of the hippocampus.
The susceptibility of blood increases with concentration of deoxyhemoglobin, causing tissue surrounding venous circulation to have shorter T2*s than those surrounding arterial blood. By generating contrast based on the greater magnetic susceptibility of venous blood, the SWI sequence was able to visualize venous structures of submillimeter size (17,20,21). The biophysical origins of the low signal of hippocampal sublayer identified as the srlms is unclear, but the hypointensity in the T2*W FFE may reflect both increased T1 arising from the low cellularity and/or a reduced T2* arising from increased iron content or possibly from the high vascularity of the strata radiatum, moleculare, and adjacent hippocampal sulcus (5,16).
Limitations of Very High Field MR Imaging
Many technical limitations arise as field strength increases. For example, in-plane dephasing and loss of signal at tissue–air interfaces can produce image artifacts when imaging structures near the skull base. In general, geometric distortion due to static field susceptibility effects is a major challenge in high-field MRI (22). Large susceptibility differences adjacent to the skull base can limit high-resolution temporal lobe imaging. The challenges associated with susceptibility and static field inhomogeneity in general increase the need for advanced high-order shimming hardware. Furthermore, the RF homogeneity becomes poorer at higher field strengths and is a major concern. At 7T, the shorter RF wavelength and associated RF inhomogeneity can cause significant signal intensity and tissue contrast variations across the FOV even for an object the size of a human brain. Therefore, RF power deposition can vary significantly across the brain, leading to miscalibration of the desired flip angle. If the actual flip angle varies spatially, tissue contrast may be strongly affected. For example, a sequence intending to use the optimal Ernst angle may begin to show proton density-weighted contrast if the flip angle is smaller than expected or may show T1-weighted contrast if the flip angle is larger than expected. The issues of RF inhomogeneity at higher field strengths such as 7T must be solved to enable clinically useful in vivo human brain imaging. Finally, SAR levels increase significantly at higher fields. Although not as great a concern for the gradient echo-based sequences used in this work, higher SAR levels may lead to reduced duty cycles and a consequent increase in acquisition times for some RF-intensive imaging sequences such as those using refocusing pulses (spin echo or turbo spin echo), fat suppression pulses, or other inversion or saturation pulses.
When performing MR imaging at 7T, there are more contraindications for subjects. The safety of many implants is not known, and special care should be taken when imaging female subjects who may be pregnant because fields greater than 4T are not classified as insignificant risks for children younger than 1-month-old by the FDA. Finally, the dimensions of the 7T scanner itself with its longer bore and tightly fitting head coil may reduce the number of subjects willing and able to be scanned.
In conclusion, this 7T protocol serves to bridge the gap in understanding between the in vivo and in vitro imaging appearance of internal hippocampal architecture. Unique features of in vivo hippocampal imaging at 7T provide a better understanding of the appearance of clinically imaged anatomy at lower field strengths. We present a protocol that takes advantage of high SNR and novel contrast attributes of high-field imaging with reasonable imaging time and without sacrificing FOV. The use of gradient echo techniques at 7T, with improved spatial resolution and higher SNR, provides more clarity of the internal hippocampal architecture. The high contrast resolution of the stratum pyramidale will likely be useful in depicting volume loss in certain hippocampal syndromes. Susceptibility-weighted imaging, another technique for which high-field MR has advantages, is a useful tool for imaging small venous structures, especially those with subvoxel dimensions. The development of optimized 7T MR imaging protocols which are clinically useful for in vivo mesial temporal lobe imaging promises a new phase of hippocampal investigation.
Acknowledgments
Contract grant sponsor: National Institute of Biomedical Imaging and Bioengineering; Contract grant number: RO1EB000461 (to PI: J.C.G.).
REFERENCES
- 1.Abduljalil AM, Schmalbrock P, Novak V, Chakeres DW. Enhanced gray and white matter contrast of phase susceptibility-weighted images in ultra-high-field magnetic resonance imaging. J Magn Reson Imaging. 2003;18:284–290. doi: 10.1002/jmri.10362. [DOI] [PubMed] [Google Scholar]
- 2.Novak V, Abduljalil AM, Novak P, Robitaille PM. High-resolution ultrahigh-field MRI of stroke. Magn Reson Imaging. 2005;23:539–548. doi: 10.1016/j.mri.2005.02.010. [DOI] [PMC free article] [PubMed] [Google Scholar]
- 3.Wiesinger F, Van de Moortele PF, Adriany G, De Zanche N, Ugurbil K, Pruessmann KP. Parallel imaging performance as a function of field strength—an experimental investigation using electrodynamic scaling. Magn Reson Med. 2004;52:953–964. doi: 10.1002/mrm.20281. [DOI] [PubMed] [Google Scholar]
- 4.Shaw CM, Alvord EC., Jr. Neuropathology of the limbic system. Neuroimaging Clin N Am. 1997;7:101–142. [PubMed] [Google Scholar]
- 5.Duvernoy HM. The human hippocampus: functional anatomy, vascularization and serial sections with MRI. 3rd ed. Springer; Heidelberg: 2005. [Google Scholar]
- 6.Naidich TP, Daniels DL, Haughton VM, Williams A, Pojunas K, Palacios E. Hippocampal formation and related structures of the limbic lobe: anatomic-MR correlation. Part I. Surface features and coronal sections. Radiology. 1987;162:747–754. doi: 10.1148/radiology.162.3.3809489. [DOI] [PubMed] [Google Scholar]
- 7.Adachi M, Kawakatsu S, Hosoya T, et al. Morphology of the inner structure of the hippocampal formation in Alzheimer disease. AJNR Am J Neuroradiol. 2003;24:1575–1581. [PMC free article] [PubMed] [Google Scholar]
- 8.Mueller SG, Stables L, Du AT, et al. Measurement of hippocampal subfields and age-related changes with high resolution MRI at 4T. Neurobiol Aging. 2007;28:719–726. doi: 10.1016/j.neurobiolaging.2006.03.007. [DOI] [PMC free article] [PubMed] [Google Scholar]
- 9.Miller MJ, Mark LP, Ho KC, Haughton VM. MR appearance of the internal architecture of Ammon's horn. AJNR Am J Neuroradiol. 1996;17:23–26. [PMC free article] [PubMed] [Google Scholar]
- 10.Wieshmann UC, Symms MR, Mottershead JP, et al. Hippocampal layers on high resolution magnetic resonance images: real or imaginary? J Anat. 1999;195(Pt 1):131–135. doi: 10.1046/j.1469-7580.1999.19510131.x. [DOI] [PMC free article] [PubMed] [Google Scholar]
- 11.Chakeres DW, Whitaker CD, Dashner RA, et al. High-resolution 8 Tesla imaging of the formalin-fixed normal human hippocampus. Clin Anat. 2005;18:88–91. doi: 10.1002/ca.10232. [DOI] [PubMed] [Google Scholar]
- 12.Fatterpekar GM, Naidich TP, Delman BN, et al. Cytoarchitecture of the human cerebral cortex: MR microscopy of excised specimens at 9.4 Tesla. AJNR Am J Neuroradiol. 2002;23:1313–1321. [PMC free article] [PubMed] [Google Scholar]
- 13.Creasy JL, Welch EB, Avison RG, Anderson AW, Gore JC, Avison MJ. Anatomic imaging of human brain at 7T. Presented at: 93rd annual meeting of the Radiological Society of North America. Chicago, IL: 2007. (November 25–30). Abstract SSQ10–09. [Google Scholar]
- 14.Reichenbach JR, Venkatesan R, Schillinger DJ, Kido DK, Haacke EM. Small vessels in the human brain: MR venography with deoxyhemoglobin as an intrinsic contrast agent. Radiology. 1997;204:272–277. doi: 10.1148/radiology.204.1.9205259. [DOI] [PubMed] [Google Scholar]
- 15.Wang Y, Yu Y, Li D, et al. Artery and vein separation using susceptibility-dependent phase in contrast-enhanced MRA. J Magn Reson Imaging. 2000;12:661–670. doi: 10.1002/1522-2586(200011)12:5<661::aid-jmri2>3.0.co;2-l. [DOI] [PubMed] [Google Scholar]
- 16.Hayman LA, Fuller GN, Cavazos JE, Pfleger MJ, Meyers CA, Jackson EF. The hippocampus: normal anatomy and pathology. AJR Am J Roentgenol. 1998;171:1139–1146. doi: 10.2214/ajr.171.4.9763010. [DOI] [PubMed] [Google Scholar]
- 17.Tong KA, Ashwal S, Obenaus A, Nickerson JP, Kido D, Haacke EM. Susceptibility-weighted MR imaging: a review of clinical applications in children. AJNR Am J Neuroradiol. 2008;29:9–17. doi: 10.3174/ajnr.A0786. [DOI] [PMC free article] [PubMed] [Google Scholar]
- 18.Rauscher A, Sedlacik J, Barth M, Mentzel HJ, Reichenbach JR. Magnetic susceptibility-weighted MR phase imaging of the human brain. AJNR Am J Neuroradiol. 2005;26:736–742. [PMC free article] [PubMed] [Google Scholar]
- 19.Duyn JH, van Gelderen P, Li TQ, de Zwart JA, Koretsky AP, Fukunaga M. High-field MRI of brain cortical substructure based on signal phase. Proc Natl Acad Sci U S A. 2007;104:11796–11801. doi: 10.1073/pnas.0610821104. [DOI] [PMC free article] [PubMed] [Google Scholar]
- 20.Dashner RA, Kangarlu A, Clark DL, RayChaudhury A, Chakeres DW. Limits of 8-Tesla magnetic resonance imaging spatial resolution of the deoxygenated cerebral microvasculature. J Magn Reson Imaging. 2004;19:303–307. doi: 10.1002/jmri.20006. [DOI] [PubMed] [Google Scholar]
- 21.Christoforidis GA, Bourekas EC, Baujan M, et al. High resolution MRI of the deep brain vascular anatomy at 8 Tesla: susceptibility-based enhancement of the venous structures. J Comput Assist Tomogr. 1999;23:857–866. doi: 10.1097/00004728-199911000-00008. [DOI] [PubMed] [Google Scholar]
- 22.Abduljalil AM, Robitaille PM. Macroscopic susceptibility in ultra high field MRI. J Comput Assist Tomogr. 1999;23:832–841. doi: 10.1097/00004728-199911000-00004. [DOI] [PubMed] [Google Scholar]