

Abstract
Microglial cells, the macrophages of the brain, play an essential role in the propagation of neuroinflammation. Increased microglial cell migration in response to specific chemoattractants has been documented, but less is known about the differences between these stimuli and the signal transduction pathways that mediate their effects. Current methods to measure cell migration are often labor-intensive and rely on the manual counting of cell number, so more efficient and objective methods are needed. Here we present an improved and higher-throughput Boyden Chamber technique that measures microglial cell migration by using DRAQ5, a nuclear dye that emits in the near-infrared. Out of a panel of chemoattractants tested, we found that ATP and C5a potently stimulate the migration of mouse primary microglial cells. The stimulatory effects of ATP and C5a displayed significant additivity, suggesting that each chemoattractant stimulated migration through independent molecular mechanisms. Accordingly, we found key differences in these responses: ATP stimulated a combination of both chemokinesis and chemotaxis, and this response was mediated by the ROCK signaling pathway; whereas C5a stimulated only chemotaxis and this response was mediated by the Rac1 signaling pathway. Finally, we found that functional PI3-kinase is only required for random basal microglial cell migration. Thus, our results show that distinct non-overlapping signal transduction pathways control different modes of microglial cell migration and suggest that the targeting of these distinct molecular mechanisms should modulate different aspects of neuroinflammation propagation.
Keywords: Boyden Chamber, ROCK, Rac1, DRAQ5
Introduction
Microglial cells are highly motile in the brain parenchyma. In healthy brain, “resting” microglia display a baseline motility characterized by the extension and retraction of their cellular processes, with little to no movement of their cell bodies (Davalos et al. 2005; Nimmerjahn et al. 2005). This baseline motility of microglia is independent of neuronal activity and thought to underlie the constant “immune surveillance” of the brain parenchyma (Raivich 2005; Wu and Zhuo 2008). As a result of brain damage, microglia undergo rapid changes in their phenotype and migratory properties, the combination of which is known as “microglial cell activation”. The release of certain molecules, by injured tissues and microglia themselves, stimulates motility (i.e. chemokinesis), directed migration (i.e. chemotaxis) or a combination of both in order to recruit microglial cells toward lesion sites. Increases in the concentration of pathogens and cytokines induce changes in microglial gene expression and phenotype, a process that tailors activated microglia to become either repair-oriented or harmful (Garden and Moller 2006). Thus, pharmacological tools that would specifically target the molecular mechanisms controlling the migration of microglia may be therapeutically useful. Ideally, such tools would both enhance the accumulation of beneficial microglia at lesion sites and prevent the accumulation of harmful microglia at these same sites. Despite its clear therapeutic relevance, a detailed understanding of the signal transduction pathways controlling microglial cell migration is still lacking.
Cell migration can be triggered by a diverse array of chemoattractants: peptides and proteins (e.g. chemokines), small hydrophilic molecules (e.g. nucleotides) and bioactive lipids (e.g. endocannabinoids) (Inoue 2002; Miller and Stella 2008; Thelen 2001). Though many of these molecules have been shown to increase peripheral immune cell migration, little is known about their effect on microglia. Two notable exceptions are adenosine 5′-triphosphate (ATP) and complement 5a (C5a). Damaged neurons release ATP (Frenguelli et al. 2007; Wang et al. 2004), which then acts on P2Y12 and P2X4 receptors expressed by microglia and stimulatesv their migration (Haynes et al. 2006; Honda et al. 2001; Kurpius et al. 2007; Ohsawa et al. 2007). Pharmacological evidence suggests that PI3-kinase and Akt mediate this response (Irino et al. 2008; Ohsawa et al. 2007). A role for C5a in stimulating microglial cell migration is supported by the observation that C5a levels and C5a receptor expression in microglia are increased in specific neuropathologies that involve the complement cascade (Griffin et al. 2007; Nolte et al. 1996). The signal transduction pathways mediating C5a-triggered microglial cell migration include pertussis toxin-sensitive G proteins (Nolte et al. 1996). Thus, studies have reported local increases in ATP and C5a concentrations following brain damage and identified the receptor subtypes on which these chemoattractants act. However, relatively little is known about the signal transduction pathways mediating these effects and whether both chemoattractants increase cell migration through similar or distinct molecular mechanisms.
Cell migration is often measured using the classic Boyden Chamber assay, also referred to as the filter assay (Wilkinson 1998). In this assay, cells are loaded in the upper well of a chamber and allowed to migrate through filter pores toward chemoattractants applied in the lower well. Cells that have migrated are then fixed, stained and manually scored in a blinded fashion by independent observers using multiple microscope fields. In addition to being labor intensive, this method introduces a large potential for experimental error because migrated cells are counted only in select fields rather than over the entire filter. Here we describe an improved method that quantifies cell migration with DRAQ5, a nuclear dye that emits near-infrared fluorescence. Using this newly developed and higher-throughput method, we sought to identify the signal transduction pathways mediating the action of specific chemoattractants on microglial cell migration.
Materials and Methods
Reagents
Human recombinant C5a, PD98059, wortmannin, SB202190, SP600125 and NSC23766 were from Calbiochem (San Diego, CA). ATP, M-CSF (mouse) and SDF-1α (human) were from Sigma (St. Louis, MO). MCP-1 (mouse) and IP-10 (mouse) were from R&D systems (Minneapolis, MN). WIN55212-2 and 2-arachidonoylglycerol were from Cayman Chemical (Ann Arbor, MI). DRAQ5 and H-1152 were from Axxora (San Diego, CA). ML-7 was from Biomol (Plymouth Meeting, PA). Drugs were dissolved in DMSO, except for C5a, ATP, M-CSF, MCP-1, IP-10, SDF-1α, H-1152 and NSC23766, which were dissolved in aqueous buffer.
Cell culture and migration
Primary cultures of mouse microglial cells were generated from 1–3 day old C57BL-6 pups as previously described in (Walter et al. 2002) and in accordance with the guidelines of the Institutional Animal Care and Use Committee at the University of Washington. Briefly, mixed glial cell cultures were maintained in T75 flasks (BD Falcon, San Jose, CA) in DMEM supplemented with 10% FBS, 5 mM NaHCO3, 100 U/ml penicillin and 100 μg/ml streptomycin for up to six weeks. After two weeks, floating and loosely adherent microglia were isolated by shaking and recovered in serum-free MEM. This harvest was repeated once a week until reaching the six week end point. Cells from all harvested flasks were pooled and resuspended at 4x10⁵ cells/ml in MEM and stained with 700 nM DRAQ5 for 20 min at 4°C with gentle shaking. Following staining, cells were washed twice with MEM and once with MEM containing 10% Cellgro (Mediatech, Herndon, VA). Migration was measured in a 96-well chemotaxis chamber (Model AA96, Neuroprobe, Cabin John, MD) using filters with a pore diameter of 10 μm. Upper wells of the chamber were loaded with 7x10⁴ cells in 390 μL MEM/10% Cellgro, while lower wells contained chemoattractant solutions. In each experiment, three wells were loaded for each treatment, while six wells were loaded with vehicle only (“basal” migration). Once loaded, the chamber was left untouched on the bench top for ten min (to allow cells to settle and improve even distribution on the filter) before being moved to an incubator for 3 hours at 37°C and 5% CO2.
Following incubation, cells that did not migrate were removed from the top side of the filter by wiping with a Kimwipe wetted with PBS, followed by a thorough PBS rinse to remove all cell debris. The filter was then fixed for five min in methanol and washed three times in distilled water. Migration was measured by scanning the filter with an Odyssey Infrared Imaging System (LI-COR, Lincoln, NE) to detect DRAQ5-labeled cells that had migrated toward the bottom of the filter. DRAQ5 has an excitation maximum of 646 nm and an emission maximum of 697 nm when bound to DNA, and does not photobleach (Smith et al. 2000). Using the Odyssey, excitation and detection were performed at 680 nm and 700 nm, respectively. Focus offset was set at one mm to compensate for the thickness of the filter frame, which prevents the filter surface containing the migrated cells from lying flush on the scanner. Other scanning settings were also systematically determined and set as follows: resolution, 42 μm; quality, high; intensity, 3.5. Background fluorescence was measured in wells that contained medium only and subtracted from each fluorescence reading (see results). A circle-based grid that covers individual wells was set manually (see Figure 2a), and fluorescence within each circle (i.e. well) was quantified and processed as an individual event.
Figure 2.
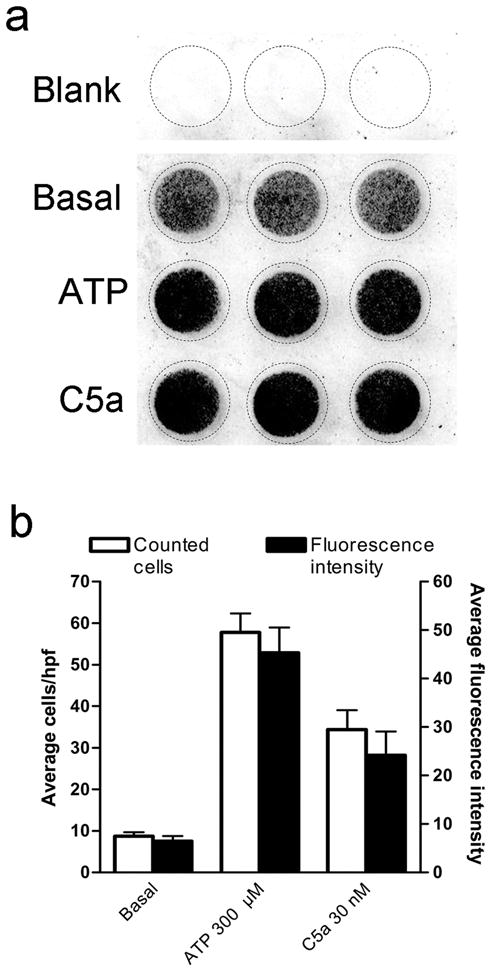
Quantification of migration by near-infrared fluorescence. (a) A representative scan of fluorescence (converted to grayscale) depicting background fluorescence (blank), basal migration (vehicle), ATP- and C5a-stimulated migration. (b) Comparison of manual cell counting in randomly selected high power fields (hpf) (open bars) to fluorescence signal (filled bars) for basal, ATP (300 μM) and C5a (30 nM) stimulated migration. n=9 (i.e. 3 independent experiments performed in triplicate).
Cell Counting
Following fluorescence scanning, filters were stained using a HEMA-3 kit (Thermo Fisher Scientific, Waltham, MA) according to the supplied protocol. Cells were stained for five min in each of the two staining solutions (the fixative was not used as cells had previously been fixed in methanol). Counting was performed in three high-power fields (320x) for each Boyden Chamber well on a Zeiss Axiovert microscope (Carl Zeiss, Thornwood, NY). The area that was counted measured 0.1 mm2 and the entire area of the well was 32 mm2. Thus, the average cell number counted in three high power fields was multiplied by 320 to obtain the total number of cells that migrated.
Flow Cytometry
Microglial cells were recovered from flasks by shaking and prepared according to the protocol described above for the migration assay. Following the final wash (in MEM/10% Cellgro), cells were resuspended in PBS containing 2% FBS and analyzed using a FACSCanto flow cytometer (BD Biosciences, San Jose, CA). Excitation was carried out using a 633 nm laser and fluorescence emission was detected for 10,000 events using a 735 nm filter.
WST-1 Assay
Microglial cells were prepared according to the migration assay protocol. At the point in which they would normally be loaded into the Boyden Chamber, 7x10⁴ cells were instead loaded into triplicate wells of a 96-well plate containing one of the drugs to be tested, 20 μl WST-1 reagent (Roche Applied Science, Indianapolis, IN), and MEM/10% Cellgro (final volume 220 μl). The plate was incubated for three hours at 37°C and 5% CO2. Conversion of WST-1 reagent was measured by absorbance at 450 nm.
Data analysis
Data analysis was performed using Prism 4.0 (GraphPad, San Diego, CA). Results are expressed as mean ± SEM of n events (i.e. measurement of fluorescence in each well). The effect of each inhibitor on basal motility was calculated according to the following formula:
Whereas the effect of the inhibitor on stimulated migration was calculated according to the following formula:
Results
Quantification of microglial cell migration with near-infrared fluorescence
We have developed a method that quantifies cell migration with near-infrared fluorescence, the experimental design of which is outlined in Figure one. To ascertain for the precision and reliability of this new method, we sought to test three critical parameters. First, we tested whether the harvesting and staining procedure that we have implemented yields a uniformly stained population of microglial cells. To do so, we analyzed stained cells by flow cytometry and found that the fluorescence intensity emitted at 735 nm by 104 stained cells lies within one homogenous, Gaussian-like, population (see supplementary figure S1). Second, we tested if the fluorescence signal emitted by an increasing number of cells was linear, and indeed found a linear correlation between these two variables (see supplementary figure S2). Third, we found that the fluorescence signal measured on the bottom side of the filter, in areas that contained cells that had migrated, was significantly stronger than the background fluorescence signal measured in areas lacking cells (Figure 2a). This result has two implications. It shows that the background fluorescence signal measured in these wells lacking cells must be systematically subtracted from the fluorescence signal emitted by cells that have migrated toward the bottom filter. Furthermore, it confirms previous studies showing that the basal random motility of primary mouse microglia is sufficient for them to reach the bottom side of the filter within three hours (Chao et al. 1997). Together, these first sets of results show that mouse primary microglial cells in culture are uniformly stained with DRAQ5 and that the number of cells that have migrated toward the bottom side of the filter can be reliably quantified by measuring fluorescence intensity.
Figure 1.

Scheme outlining a novel method to quantify cell migration with near-infrared fluorescence. (a) Primary mouse microglial cells were harvested from mixed glial cultures by shaking. (b) Microglia were resuspended in serum-free MEM and stained with DRAQ5 (c) Stained cells were loaded in upper wells of a 96-well Boyden Chamber, with chemoattractant solutions in the lower wells. The chamber was then incubated for three hours, allowing cells to migrate toward the chemoattractant. (d) After incubation, filter was removed from the chamber and non-migrated cells on the top of the filter were wiped off. The filter was then fixed in methanol. (e) Fluorescence signal emitted by cells that did migrate was scanned using a LI-COR Odyssey scanner.
ATP and C5a stimulate microglial cell migration
Using this method, we tested the effect of several chemoattractants on microglial cell migration. We found that both ATP (300 μM) and C5a (30 nM) strongly stimulated migration (Figure 2a), whereas M-CSF (100 ng/ml), MCP-1 (1–100 ng/ml), IP-10 (100 ng/ml), SDF-1α (100 ng/ml), and the two cannabinoids WIN55212-2 (100 nM and 1 μM) and 2-arachidonoylglycerol (100 nM and 1 μM) had no significant effect (data not shown). To determine whether the fluorescence measured from DRAQ5-labeled cells was proportional to the actual number cells that had migrated through the filter, we performed an experiment in which, following fluorescence imaging, cell migration was assessed by manually counting the cells by light microscopy. We found a strong correlation between the fold increase in fluorescence induced by the chemoattractant and the actual increased number of migrated cells stimulated by these chemoattractants (Figure 2b). When calculating the number of cells that had actually migrated through the filter after three hours of incubation under basal, ATP-and C5a-induced migration, we found that an average of 4%, 26% and 16% of the original 70,000 cells had reached the filter bottom.
We further characterized the responses triggered by ATP and C5a by studying their concentration dependence and additive effects. ATP stimulated a concentration-dependent increase in microglial cell migration (Figure 3a). This response reached a plateau and became significant at 100 μM. Nonlinear regression analysis calculated an EC50 of 23 μM. Consistent with previous reports (Chao et al. 1997; Chiou et al. 2004; Yao et al. 1990), C5a stimulated a concentration-dependent increase in microglial cell migration that was bell-shaped (Figure 3b). This stimulatory effect of C5a became significant at 1 nM and reached a maximum at 30 nM. Please note that C5a at 100 and 300 nM stimulated less microglial cell migration than 30 nM (see Discussion for rationale). When omitting these two latter values, nonlinear regression analysis calculated an EC50 of 5 nM for C5a-stimulated migration.
Figure 3.

Concentration-dependent migration toward ATP (a) and C5a (b). Data are expressed as the percentage of the maximum response for each chemoattractant. *p<0.05, **p<0.01 = significantly different from basal migration (ANOVA followed by Dunnett’s test). n=9–12 (i.e. 3–4 independent experiments performed in triplicate).
In the next set of experiments, we tested whether ATP and C5a stimulate migration by common or independent molecular mechanisms. First, we tested whether these responses were additive. Figure 4a shows that when concentrations of ATP and C5a that stimulated maximal responses are combined (i.e. 300 μM ATP plus 30 nM C5a), migration is increased significantly compared to the response to either single chemoattractant. We also tested combinations of the EC50 and minimal effective concentrations of each chemoattractant (23 μM ATP plus 5 nM C5a, and 10 μM ATP plus 1 nM C5a) (Figure 4a). At these lower concentrations, the stimulatory effects appeared also additive, yet due to the lower responses obtained, these differences did not reach statistical significance. These results suggest that migration toward ATP and C5a involves independent molecular mechanisms.
Figure 4.

(a) Additivity of responses toward ATP and C5a. n=9 (i.e. 3 independent experiments performed in triplicate). (b) Checkerboard analysis of migration toward ATP and C5a. n=9 (i.e. 3 independent experiments performed in triplicate). Chemoattractants were loaded in the top, bottom or both wells, and migration (compared to basal) was measured. **p<0.01 compared to basal; ###p<0.001 for C5a in the bottom well only compared to C5a in both wells (ANOVA followed by Bonferroni’s multiple comparison test).
To continue investigating the mechanisms of migration toward ATP and C5a, we asked whether they stimulate microglial cell migration by inducing chemokinesis or chemotaxis, or a combination of both. Indeed, cell migration can be divided into three components: (I) basal random motility, which takes place in the absence of a chemical stimulus; (II) chemokinesis, which corresponds to increased random motility in response to a chemical stimulus; and (III) chemotaxis, which corresponds to stimulated migration toward an increasing chemical gradient (Wilkinson 1998). To determine whether ATP and C5a stimulate chemotaxis, chemokinesis or both, we used a range of different gradients and uniform concentrations in the upper and lower wells of the Boyden Chamber, which is the basis for the checkerboard experiment originally described by Zigmond and Hirsch (Zigmond and Hirsch 1973). If either ATP or C5a stimulated chemokinesis, then migration should persist despite the disrupted gradient that occurs when the ligand is loaded at the same concentration in both wells (i.e. no gradient) or in the top well only (i.e. a reverse gradient). If only chemotaxis was stimulated, there should only be a response when the ligand is loaded in a higher concentration in the lower well and a concentration gradient is present. For ATP we found that the extent of migration was not strictly dependent on the presence of a concentration gradient. This is best demonstrated by two comparisons: first, when 300 μM ATP was loaded in the upper well only, migration toward the bottom of the filter still occurred at 254% of basal, suggesting that here ATP stimulated chemokinesis. Second, for a given concentration in the top well (0, 30, or 300 μM), increasing ATP concentration in the bottom well induced greater migration (Table 1), suggesting that here ATP also stimulated chemotaxis. In contrast to ATP, migration toward C5a was strictly dependent on the presence of a concentration gradient. When 30 nM C5a was loaded in both wells or the top well only, migration was not significantly increased above the basal amount (Figure 4b and Table 1, bottom panel). For all combinations tested, stimulated migration only occurred when the concentration of C5a in the lower well was higher than the concentration in the upper well, demonstrating that C5a stimulates only chemotaxis. Thus, we found a first clear difference between the types of migration induced by these two chemoattractants: ATP induces chemokinesis and chemotaxis, while C5a induces only chemotaxis.
Table 1.
Checkerboard Assay. Varying concentrations of ATP or C5a were loaded into the top, bottom, or both wells of the Boyden Chamber.
| Top Well [ATP] (μM) | ||||
|---|---|---|---|---|
| 0 | 30 | 300 | ||
| Bottom Well [ATP] (μM) |
0 | 100±5 | 166±15 | 254±17** |
| 30 | 450±34** | 417±18** | 337±27** | |
| 300 | 675 ±54** | 859±86** | 582±45** | |
| Top Well [C5a] (nM) | ||||
| 0 | 3 | 30 | ||
|
| ||||
| Bottom Well [C5a] (nM) |
0 | 100±5 | 113±13 | 98±11 |
| 3 | 387±52** | 138±20 | 89±11 | |
| 30 | 404±39** | 285±46** | 139±29 | |
Numbers shown represent migration measured on the bottom side of the filter, expressed as a percentage of basal migration ±SEM. n=9 (i.e. 3 independent experiments performed in triplicate);
p<0.05,
p<0.01 compared to basal (ANOVA followed by Dunnett’s post test)
Distinct signal transduction pathways mediate basal migration, and ATP- and C5a-stimulated cell migration
To identify signal transduction pathways that mediate C5a- and ATP-stimulated migration of microglia, we used inhibitors of small G-proteins and kinases. Their effect on either basal migration or C5a- or ATP-stimulated migration was calculated using the formula given in the methods section.
The following set of results focuses on basal cell migration. Figure 5a shows that out of a panel of seven inhibitors, four significantly blocked basal cell migration. Specifically, the PI3-kinase inhibitor wortmannin, the myosin light chain kinase inhibitor ML-7 and the Rac1 inhibitor NSC23766 decreased basal cell migration by 70–90% (Figure 5a). The p38-MAPK inhibitor SB202190 also significantly decreased basal migration, but only by 25% (Figure 5a). Inhibitors of JNK (i.e. SP600125), Erk kinase (i.e. PD98059) and ROCK (i.e. H-1152) had no significant effect. To confirm that the inhibition of migration that we measured was not due to a decrease in cell viability caused by these inhibitors, we performed a WST-1 assay using conditions identical to those used for the migration assay. We found that while some of the inhibitors caused a statistically significant decrease in the conversion of WST-1 reagent, these decreases were small (5–15%) and did not correlate with the extent of migration inhibition (compare supplementary figure S3 and figure 5a). The notable exception was SB202190, which caused a 24% decrease by WST-1 that closely mirrored the 25% inhibition of migration that we observed. Thus, results obtained with this particular inhibitor must be interpreted with consideration of this caveat. In summary for this section, the results suggest that PI3-kinase, myosin light chain kinase, Rac1, and possibly p38-MAPK control basal microglial migration.
Figure 5.

Signal transduction pathways mediating microglial cell migration. (a) Effects of signal transduction inhibitors on basal cell migration. b,c Effects of signal transduction inhibitors on 100 μM ATP- (b) and 10 nM C5a-stimulated migration (c). n=9–33 (i.e. 3–11 experiments performed in triplicate). *p<0.05; **p<0.01; significantly different from the response in the absence of inhibitor (ANOVA followed by Dunnett’s test).
The same set of inhibitors was tested on ATP- and C5a-induced migration. The myosin light chain kinase inhibitor ML-7 reduced both the ATP and C5a responses by 36% and 50%, respectively (Figure 5b,c). The p38-MAPK inhibitor SB202190 also inhibited both responses, but to a lesser extent, decreasing the ATP response by 22% and the C5a response by 24% (Figure 5b,c). Interestingly, the ROCK inhibitor H-1152 decreased the ATP response by 35% without affecting the C5a response, whereas the Rac1 inhibitor NSC23766 decreased the C5a response by 38% without affecting the ATP response (Figure 5b,c). Inhibitors of JNK, PI3-kinase and Erk had no significant effects on either response (Figure 5b,c). Here it should be emphasized that since no inhibitor of any single kinase completely blocked either ATP- or C5a-mediated migration, these responses may rely on these kinases acting in concert and possibly additional, untested pathways.
To summarize these sets of experiments, our results show that basal, ATP- and C5a-stimulated microglial cell migration are mediated by distinct signal transduction pathways and that the cell motility machinery underlying migration in each of the conditions is regulated by a complex interplay of signaling pathways. Notable results are that constitutive PI3-kinase activity only controls basal cell migration, ROCK mediates only ATP-stimulated migration, and Rac1 controls basal migration and mediates C5a-stimulated migration.
Discussion
In the first part of our study, we presented evidence for the combined use of DRAQ5 and the LI-COR Odyssey scanner to reliably quantify cell migration when using a Boyden Chamber. These improvements offer specific advantages. They reduce the labor normally associated with the classic Boyden Chamber assay, eliminating the need for independent scorers to manually count cells under a microscope. Our technique allows a single person to perform each experiment in an unbiased manner. They allow for accurate quantification of cell number because the entire surface of the filter is scanned (rather than counting cell number in individual microscope subfields). This point is noteworthy since occasional uneven cell migration through the filter can occur if care is not taken while loading the cells in the upper chamber. Thus, scanning the entire filter will account for such uneven cell distribution between filter subfields. The accuracy in the quantification of cell number with DRAQ5 is illustrated by the small – yet significant – incremental increases in fluorescence signal induced by half-log increases in chemoattractant concentrations (Figure 3). Other modifications of the classic Boyden Chamber assay have been reported, including the use of bioluminescence and calcein-AM to label cells (Frevert et al. 1998; Vishwanath et al. 2005). Compared to these two specific staining approaches, the use of DRAQ5 offers several advantages. It avoids the labor intensive – and potentially intrusive – genetic modification of the studied cells (i.e. the transfection of a plasmid encoding for luciferase). The labeling of cells with DRAQ5 is more stable compared to calcein-AM, for the latter dye is released from cells within hours of loading (data not shown). This particular caveat of calcein-AM leads to increase of non-specific background fluorescence and precludes the accurate quantification of cell numbers undergoing migration over several hours. Note that in pilot experiments we had tested Syto60, another near-infrared fluorescent nuclear dye, but found that microglial cell labeling with DRAQ5 was more reliable (data not shown). In summary, we found that the use of DRAQ5 and of the LI-COR Odyssey scanner technology is much less labor intensive than the classic Boyden Chamber assay and greatly improves the reliability of the results.
We screened a panel of known chemoattractants and confirmed previous reports showing that both C5a and ATP stimulate the migration of primary microglial cells (Honda et al. 2001; Yao et al. 1990). One of the most unexpected and interesting findings in our study is that we found clear differences in the molecular mechanisms by which C5a and ATP stimulate microglial cell migration. First, when concentrations of each chemoattractant that stimulated maximal migration were combined, migration was significantly increased compared to that seen with either individual agent. Second, the checkerboard experiment revealed that C5a stimulates chemotaxis, while ATP stimulates a combination of both chemotaxis and chemokinesis. Third, we found a bell-shaped dose-response of migration to C5a but not to ATP. The bell shaped dose-response to C5a could be explained by the fact that this agent primarily stimulates chemotaxis. Indeed, at concentrations higher than 30 nM, diffusion of C5a from the lower wells to the upper wells of the Boyden Chamber could disrupt the gradient of C5a and thus prevent chemotactic migration. This interpretation is supported by the results obtained in the checkerboard experiment (Figure 4b and Table 1). Conversely, a bell-shaped dose-response would not occur with a chemoattractant that stimulates chemokinesis, such as ATP, because such a response is independent of chemical gradients. An alternate interpretation is that high concentrations of C5a would cause microglial cells to lose adherence and detach from the bottom side of the filter. This has been noted for some cell types (Zigmond and Hirsch 1973), but is less likely with highly adherent microglial cells. An additional difference between the responses to ATP and C5a was that the ROCK inhibitor H-1152 only affected ATP-stimulated migration, suggesting that ROCK might control chemokinesis. This is further supported by our findings that C5a did not stimulate chemokinesis, and that migration toward C5a was not affected by the ROCK inhibitor. Thus, our data show that ATP and C5a stimulate microglial cell migration through distinct molecular mechanisms.
When determining which signal transduction pathway is involved in the response induced by a chemoattractant, we believe that it is important to question whether an inhibitor will block basal and/or agonist-stimulated migration. To differentiate between effects on basal and agonist-stimulated migration, we subtracted the effect of each inhibitor on basal migration according to the formula given in the methods section. Strikingly, we found that the effects of wortmannin could be entirely attributed to its effect on basal migration, with no effect on either C5a- or ATP-stimulated migration. Differences in the manner in which the effect of such inhibitors is calculated could account for the differences between our findings and those reported by Ohsawa et al. and Wu et al. (Ohsawa et al. 2007; Wu et al. 2007). Specifically, these authors reported that wortmannin inhibits ATP-stimulated migration, but did not assess the effect of this inhibitor on basal migration. Our results also emphasize the notion that basal “random” migration of primary microglial cells is controlled by a different signal transduction pathway than agonist-stimulated migration.
In interpreting our results, it is important to emphasize that we studied floating microglial cells grown in the presence of 10% FBS and isolated from mixed glial cultures. These floating cells were systematically rinsed to eliminate the presence of FBS, and were then incubated for 20 min with DRAQ5 before loading them into the Boyden Chamber. Because the staining period with DRAQ5 is relatively short in duration and conducted at 4°C, it is unlikely that any significant change in phenotype occurs in the cells between harvesting and loading into the chamber. This point is noteworthy for several reasons. Reports have shown that changes in microglial gene expression and phenotype occur within hours after plating primary microglial cells onto plastic dishes or extracellular matrices (Becher and Antel 1996; Milner and Campbell 2003). Such changes in phenotype will most certainly affect their response to chemoattractants by changing the expression of membrane receptors and/or adhesion molecules, both of which are fundamental components of basal and agonist-stimulated cell migration. Furthermore, enzymes – such as trypsin – that are typically used to detach microglial cells from culture dishes before loading them into the Boyden chamber will also affect the integrity of membrane receptors and adhesion molecules. As a matter of fact, by cleaving PAR2 receptors, trypsin also induces rapid rises in intracellular calcium concentration, a second messenger known to modulate agonist-stimulated migration (Bucci et al. 2005). Thus, the stimulatory effects of chemoattractants on floating microglia versus microglia that were plated and subsequently detached will most likely be different. A specific example of such a difference can be found in the results that we report here. Indeed, floating primary microglial cells did not increase their migration in response to 2-arachidonoylglycerol, an endocannabinoid shown to increase the migration of BV-2 cells, a microglial cell line that expresses functional CB2 receptors (Walter et al. 2003). Accordingly, we found that floating primary microglial cells express low levels of cannabinoid CB2 receptor mRNA compared to primary microglia plated onto culture dishes (as assessed by qPCR, data not shown), suggesting that the expression of this particular receptor is up-regulated in plated microglia. In summary, the stimulatory effects of ATP and C5a reported in this study must be interpreted in the context of primary microglial cells expressing intact membrane receptors and adhesion molecules, as well as exhibiting a phenotype set by the presence of 10% FBS and an underlying population of astrocytes.
In conclusion, we report an improved method that allows for the reliable and higher throughput quantification of cell migration. Using this method, we found that ATP and C5a stimulate microglial cell migration through distinct molecular mechanisms. Considering the importance of the increased migration of microglial cells in response to brain damage, our method should prove to be useful for future studies aimed at identifying the molecular mechanisms involved in this phenomenon. Our results also suggest that pharmacological agents targeting distinct membrane receptors and signal transduction pathways are likely to affect different aspects of microglial cell migration and allied propagation of neuroinflammation.
Supplementary Material
Acknowledgments
This work was supported by National Institute on Drug Abuse Grant DA14486 to N.S.
References
- Becher B, Antel JP. Comparison of phenotypic and functional properties of immediately ex vivo and cultured human adult microglia. Glia. 1996;18:1–10. doi: 10.1002/(SICI)1098-1136(199609)18:1<1::AID-GLIA1>3.0.CO;2-6. [DOI] [PubMed] [Google Scholar]
- Bucci M, Roviezzo F, Cirino G. Protease-activated receptor-2 (PAR2) in cardiovascular system. Vascul Pharmacol. 2005;43:247–253. doi: 10.1016/j.vph.2005.07.009. [DOI] [PubMed] [Google Scholar]
- Chao CC, Hu S, Shark KB, Sheng WS, Gekker G, Peterson PK. Activation of mu opioid receptors inhibits microglial cell chemotaxis. J Pharmacol Exp Ther. 1997;281:998–1004. [PubMed] [Google Scholar]
- Chiou WF, Tsai HR, Yang LM, Tsai WJ. C5a differentially stimulates the ERK1/2 and p38 MAPK phosphorylation through independent signaling pathways to induced chemotactic migration in RAW264.7 macrophages. Int Immunopharmacol. 2004;4:1329–1341. doi: 10.1016/j.intimp.2004.05.017. [DOI] [PubMed] [Google Scholar]
- Davalos D, Grutzendler J, Yang G, Kim JV, Zuo Y, Jung S, Littman DR, Dustin ML, Gan WB. ATP mediates rapid microglial response to local brain injury in vivo. Nat Neurosci. 2005;8:752–758. doi: 10.1038/nn1472. [DOI] [PubMed] [Google Scholar]
- Frenguelli BG, Wigmore G, Llaudet E, Dale N. Temporal and mechanistic dissociation of ATP and adenosine release during ischaemia in the mammalian hippocampus. J Neurochem. 2007;101:1400–1413. doi: 10.1111/j.1471-4159.2006.04425.x. [DOI] [PMC free article] [PubMed] [Google Scholar]
- Frevert CW, Wong VA, Goodman RB, Goodwin R, Martin TR. Rapid fluorescence-based measurement of neutrophil migration in vitro. J Immunol Methods. 1998;213:41–52. doi: 10.1016/s0022-1759(98)00016-7. [DOI] [PubMed] [Google Scholar]
- Garden GA, Moller T. Microglia biology in health and disease. J Neuroimmune Pharmacol. 2006;1:127–137. doi: 10.1007/s11481-006-9015-5. [DOI] [PubMed] [Google Scholar]
- Griffin RS, Costigan M, Brenner GJ, Ma CH, Scholz J, Moss A, Allchorne AJ, Stahl GL, Woolf CJ. Complement induction in spinal cord microglia results in anaphylatoxin C5a-mediated pain hypersensitivity. J Neurosci. 2007;27:8699–8708. doi: 10.1523/JNEUROSCI.2018-07.2007. [DOI] [PMC free article] [PubMed] [Google Scholar]
- Haynes SE, Hollopeter G, Yang G, Kurpius D, Dailey ME, Gan WB, Julius D. The P2Y12 receptor regulates microglial activation by extracellular nucleotides. Nat Neurosci. 2006;9:1512–1519. doi: 10.1038/nn1805. [DOI] [PubMed] [Google Scholar]
- Honda S, Sasaki Y, Ohsawa K, Imai Y, Nakamura Y, Inoue K, Kohsaka S. Extracellular ATP or ADP induce chemotaxis of cultured microglia through Gi/o-coupled P2Y receptors. J Neurosci. 2001;21:1975–1982. doi: 10.1523/JNEUROSCI.21-06-01975.2001. [DOI] [PMC free article] [PubMed] [Google Scholar]
- Inoue K. Microglial activation by purines and pyrimidines. Glia. 2002;40:156–163. doi: 10.1002/glia.10150. [DOI] [PubMed] [Google Scholar]
- Irino Y, Nakamura Y, Inoue K, Kohsaka S, Ohsawa K. Akt activation is involved in P2Y12 receptor-mediated chemotaxis of microglia. J Neurosci Res. 2008;86:1511–1519. doi: 10.1002/jnr.21610. [DOI] [PubMed] [Google Scholar]
- Kurpius D, Nolley EP, Dailey ME. Purines induce directed migration and rapid homing of microglia to injured pyramidal neurons in developing hippocampus. Glia. 2007;55:873–884. doi: 10.1002/glia.20509. [DOI] [PubMed] [Google Scholar]
- Miller AM, Stella N. CB(2) receptor-mediated migration of immune cells: it can go either way. Br J Pharmacol. 2008;153:299–308. doi: 10.1038/sj.bjp.0707523. [DOI] [PMC free article] [PubMed] [Google Scholar]
- Milner R, Campbell IL. The extracellular matrix and cytokines regulate microglial integrin expression and activation. J Immunol. 2003;170:3850–3858. doi: 10.4049/jimmunol.170.7.3850. [DOI] [PubMed] [Google Scholar]
- Nimmerjahn A, Kirchhoff F, Helmchen F. Resting microglial cells are highly dynamic surveillants of brain parenchyma in vivo. Science. 2005;308:1314–1318. doi: 10.1126/science.1110647. [DOI] [PubMed] [Google Scholar]
- Nolte C, Moller T, Walter T, Kettenmann H. Complement 5a controls motility of murine microglial cells in vitro via activation of an inhibitory G-protein and the rearrangement of the actin cytoskeleton. Neuroscience. 1996;73:1091–1107. doi: 10.1016/0306-4522(96)00106-6. [DOI] [PubMed] [Google Scholar]
- Ohsawa K, Irino Y, Nakamura Y, Akazawa C, Inoue K, Kohsaka S. Involvement of P2X4 and P2Y12 receptors in ATP-induced microglial chemotaxis. Glia. 2007;55:604–616. doi: 10.1002/glia.20489. [DOI] [PubMed] [Google Scholar]
- Raivich G. Like cops on the beat: the active role of resting microglia. Trends Neurosci. 2005;28:571–573. doi: 10.1016/j.tins.2005.09.001. [DOI] [PubMed] [Google Scholar]
- Smith PJ, Blunt N, Wiltshire M, Hoy T, Teesdale-Spittle P, Craven MR, Watson JV, Amos WB, Errington RJ, Patterson LH. Characteristics of a novel deep red/infrared fluorescent cell-permeant DNA probe, DRAQ5, in intact human cells analyzed by flow cytometry, confocal and multiphoton microscopy. Cytometry. 2000;40:280–291. doi: 10.1002/1097-0320(20000801)40:4<280::aid-cyto4>3.0.co;2-7. [DOI] [PubMed] [Google Scholar]
- Thelen M. Dancing to the tune of chemokines. Nat Immunol. 2001;2:129–134. doi: 10.1038/84224. [DOI] [PubMed] [Google Scholar]
- Vishwanath RP, Brown CE, Wagner JR, Meechoovet HB, Naranjo A, Wright CL, Olivares S, Qian D, Cooper LJ, Jensen MC. A quantitative high-throughput chemotaxis assay using bioluminescent reporter cells. J Immunol Methods. 2005;302:78–89. doi: 10.1016/j.jim.2005.04.021. [DOI] [PubMed] [Google Scholar]
- Walter L, Franklin A, Witting A, Moller T, Stella N. Astrocytes in culture produce anandamide and other acylethanolamides. J Biol Chem. 2002;277:20869–20876. doi: 10.1074/jbc.M110813200. [DOI] [PubMed] [Google Scholar]
- Walter L, Franklin A, Witting A, Wade C, Xie Y, Kunos G, Mackie K, Stella N. Nonpsychotropic cannabinoid receptors regulate microglial cell migration. J Neurosci. 2003;23:1398–1405. doi: 10.1523/JNEUROSCI.23-04-01398.2003. [DOI] [PMC free article] [PubMed] [Google Scholar]
- Wang X, Arcuino G, Takano T, Lin J, Peng WG, Wan P, Li P, Xu Q, Liu QS, Goldman SA, et al. P2X7 receptor inhibition improves recovery after spinal cord injury. Nat Med. 2004;10:821–827. doi: 10.1038/nm1082. [DOI] [PubMed] [Google Scholar]
- Wilkinson PC. Assays of leukocyte locomotion and chemotaxis. J Immunol Methods. 1998;216:139–153. doi: 10.1016/s0022-1759(98)00075-1. [DOI] [PubMed] [Google Scholar]
- Wu LJ, Vadakkan KI, Zhuo M. ATP-induced chemotaxis of microglial processes requires P2Y receptor-activated initiation of outward potassium currents. Glia. 2007;55:810–821. doi: 10.1002/glia.20500. [DOI] [PubMed] [Google Scholar]
- Wu LJ, Zhuo M. Resting Microglial Motility is Independent of Synaptic Plasticity in Mammalian Brain. J Neurophysiol. 2008 doi: 10.1152/jn.01210.2007. [DOI] [PubMed] [Google Scholar]
- Yao J, Harvath L, Gilbert DL, Colton CA. Chemotaxis by a CNS macrophage, the microglia. J Neurosci Res. 1990;27:36–42. doi: 10.1002/jnr.490270106. [DOI] [PubMed] [Google Scholar]
- Zigmond SH, Hirsch JG. Leukocyte locomotion and chemotaxis. New methods for evaluation, and demonstration of a cell-derived chemotactic factor. J Exp Med. 1973;137:387–410. doi: 10.1084/jem.137.2.387. [DOI] [PMC free article] [PubMed] [Google Scholar]
Associated Data
This section collects any data citations, data availability statements, or supplementary materials included in this article.