Abstract
Advances in NMR instrumentation and pulse sequence design have resulted in easier acquisition of Residual Dipolar Coupling (RDC) data. However, computational and theoretical analysis of this type of data has continued to challenge the international community of investigators because of their complexity and rich information content. Contemporary use of RDC data has required a-priori assignment, which significantly increases the overall cost of structural analysis. This article introduces a novel algorithm that utilizes unassigned RDC data acquired from multiple alignment media (nD-RDC, n≥3) for simultaneous extraction of the relative order tensor matrices and reconstruction of the interacting vectors in space.
Estimation of the relative order tensors and reconstruction of the interacting vectors can be invaluable in a number of endeavors. An example application has been presented where the reconstructed vectors have been used to quantify the fitness of a template protein structure to the unknown protein structure. This work has other important direct applications such as verification of the novelty of an unknown protein and validation of the accuracy of an available protein structure model in drug design. More importantly, the presented work has the potential to bridge the gap between experimental methods and computational methods of structure determination.
Keywords: unassigned NMR data, residual dipolar coupling, protein structure modeling, structural genomics
Introduction
Recent advances in instrumentation of Nuclear Magnetic Resonance (NMR) spectrometers in addition to advances in pulse sequence design have significantly improved the ease with which Residual Dipolar Coupling (RDC) data can be acquired. In the recent decade, RDC data have been used to study the structure and dynamics of macromolecules including RNA/DNA [1; 2], carbohydrates [3–5] and proteins [6–16]. More recently, RDC data have been used successfully in simultaneous structural elucidation or characterization of internal dynamics in both aqueous [11; 17–19] and membrane [20–25] proteins.
Central to the study and analysis of the RDC data, lays the accurate estimation of alignment tensors, which provide the required information for characterization of structure or study of internal motion. Presently, the main method of determining order tensor estimates from RDC data relies on the costly and time-consuming requirement of resonance assignment and the existence of a high resolution structure [26; 27]. Some research has been conducted in obtaining order tensor estimates from unassigned RDC data collected in a single medium by comparison to the background RDC distribution obtained for an infinite number of uniformly distributed vectors (powder pattern) [28; 29]. These methods work reasonably well for certain large proteins. In general, however, the estimates of the principal order parameters obtained this way are not sufficiently accurate. Furthermore, it is mathematically impossible to determine any orientational information using these methods. Recent work [30; 31] has combined methods of estimating the principal order parameters of the order tensors from unassigned RDC data with a known structure to approximate the orientational components of the order tensor as well. This method has the advantage of not requiring a high-resolution structure; a representative of the structure’s protein fold family or the structure of a closely related homologue will often suffice. However, the order tensor estimates obtained in this way may not generally be trustworthy since it still principally assumes adequate sampling of the RDC space.
Here, we present a method that utilizes unassigned RDC data collected from 3 or more alignment media in order to provide highly accurate relative order tensors (as defined in section 2.2) for each of the alignment media. This method is notable for avoiding the requirements of assignment or a-priori knowledge of the structure while still being able to determine the relative orientation and the strength of alignment (principal order parameters) of the order tensors for each of the alignment media. An additional consequence of our algorithm is the reconstruction of the interacting vectors within the principal alignment frame of the anchor alignment medium (defined in section 2.2) to within 2 solutions when data from 3 or more aligning media are available.
The current version of our presented method provides the coordinates of the vectors in space without their assignment information. Despite the missing assignment, the reconstructed vectors can be of great utility. Here we also present an application of the reconstructed vectors in identifying the most homologous structure from a list of structures. These algorithms were implemented in the free statistical programming language and computing environment R (http://www.r-project.org/) and are available upon request from the corresponding author.
Background
1.1. Residual Dipolar Couplings
Residual dipolar coupling data (RDC) arise from the spin interaction between two nuclear magnetic moments and the external magnetic field (B0) of the NMR instrument. RDC data have provided many exciting avenues of exploration in recent years. In this article, we will not present the practical aspects of data acquisition and focus only on the relevant theoretical formulation of the phenomenon to facilitate our discussion. The interested readers are referred to many existing review articles [12; 32–36] that have been presented in the past for additional information.
The RDC between two spin 1/2 nuclei i and j can be formulated as shown in equation 1, assuming a constant inter-nuclear distance.
| 1 |
In this equation, γi, γj are the gyromagnetic ratios of the two interacting nuclei, h is Planck’s constant, r is the distance between the two nuclei, and θij is the angle between the internuclear vector and the external magnetic field B0. The angled brackets (< · >) in equation 1 denote the time average dependence of the RDC observable. Manipulation of this equation can lead to a more commonly listed formulation of this interaction as shown in equation 2.
| 2 |
1.2. Relative Order Tensor Matrix
A more convenient representation of equation 2 can be shown in equations 3 and 4:
| 3 |
| 4 |
Where Dmax is the collection of all the constants from equation 1, v is the internuclear vector with the Cartesian coordinates (x, y, z), and S denotes the Saupe order tensor matrix [37] or order tensor matrix (OTM) for short. Any valid order tensor matrix, S, described in the Cartesian space must be of dimensions 3×3 and exhibit symmetric and traceless properties [26; 27; 33; 38]. As shown previously [26; 27], a valid order tensor can then be decomposed by Eigen decomposition into its diagonal form as shown in equation 5.
| 5 |
S’ in this equation is a diagonal and traceless matrix, and R represents an Euler rotation matrix [27; 39]. The diagonal elements of S’ in this formalism provide information regarding the strength of alignment and are referred to as the principal order parameters (POP). The rotation matrix R can be used to obtain orientational information relating the principal alignment frame [26; 27; 39] to the arbitrarily selected molecular frame. The rotation matrix R can be any valid Euler rotation matrix since the orientation of the molecular frame (for instance the orientation of a molecule in a PDB file) with respect to the principal alignment frame is arbitrary. For simplicity, R can then be decomposed into three distinct rotations about the axes z, y and z as shown in equation 6.
| 6 |
Using the decomposed description of the order tensor, equation 3 can be rewritten as shown in equation 7.
| 7 |
This formulation of the RDC interaction can be conceptualized as re-describing the Cartesian coordinates of the interacting vector in the principal alignment frame (PAF) and then using the simpler equation 8 to describe the RDCs. Under this formulation, xo, yo and zo denote the Cartesian coordinates of the interacting vector described in the PAF.
| 8 |
Equation 8 is often written in polar coordinates as shown in equation 9 since it simplifies the representation of each vector to two variables instead of the three variables used in the Cartesian coordinates. This reduction in the number of variables is a consequence of the normality constraint of the interacting vectors.
| 9 |
When RDC data are available from multiple alignment media, each medium’s order tensor is decomposed to result in distinct rotation matrices denoted by Rj, where j indicates the designation of the alignment medium as shown in equation 10. Each of these rotation matrices provides an absolute relationship between each alignment frame and the arbitrarily chosen molecular frame. Alternatively, the orientational component of the alignment for each of the alignment frames can be described in relation to an anchor alignment frame as shown in equation 11. Under this formalism, the rotation matrix RA describes the orientation of the alignment tensor of the anchor medium with respect to the molecular frame and RAj describes the relative orientation of the jth alignment medium relative to the anchor alignment frame. We therefore define relative order tensor as described in equation 11.
| 10 |
| 11 |
Careful selection of the molecular frame can easily eliminate RA from the formalism shown in equation 11 above. If the molecular frame is selected to coincide with the alignment frame of the anchor medium, RA will be equivalent to an identity matrix and therefore can be eliminated from the entire equation.
Because each order tensor is traceless and symmetric, the set of absolute order tensors for n alignment media can be described by 5n (e.g. 15 variables for three alignment media) independent variables. Representation of the RDC data acquired from multiple alignment media in terms of relative order tensors will in total require the same number of independent variables (5n). However, one can partition these 5n variables into two sets of 3 and 5n-3 variables where, 3 independent variables are required to describe the orienational relationship between the MF and PAF of the anchor medium (PAFA) and 5n-3 additional variables are required to describe the n relative order tensors. As mentioned before, careful selection of the molecular frame will result in the elimination of the 3 variables required to describe the relationship between MF and PAFA. For example, selection of the MF to be coincident with the principle alignment frame of the first medium removes three degrees of freedom, and in the relative order tensor formalism, 12 variables are required to describe three alignment media.
1.3. Theoretical Basis for Simultaneous Estimation of Order Tensors and Internuclear Vectors
When RDC data are collected from multiple alignment media, chemical shift data can be used to correlate the data. Correlated RDC data in this context is defined as the RDC observables in each medium that are originated from a given vector without any knowledge of its assignment along the primary sequence of the protein. In this section we present a conceptual discussion of the reconstruction of interacting vectors using their correlated RDC data.
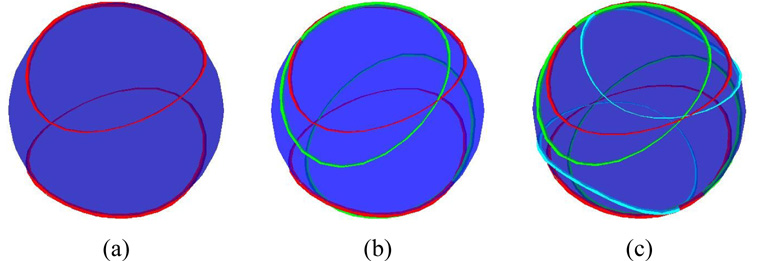
Estimation of order tensors from a set of vectors paired with RDC values through the use of Singular Value Decomposition (SVD) has been discussed extensively in the literature [26; 27; 39]. However, there has been little discussion of obtaining the orientation of the interacting vectors from a given set of order tensors and correlated RDC data from multiple alignment media. Figure 1(a) illustrates the position of all possible vectors that produce the same value of RDC for an example alignment tensor. In general, there are infinite vectors (the red band), which correspond to the same RDC value. This infinite degeneracy can be reduced to a four-fold degeneracy (in general) by using RDC data from a second alignment medium as shown in Figure 1(b). Extension of the same logic will reduce the final degeneracy to two-fold by incorporating RDC data from the third alignment medium. Figure 1(c) provides an illustration of this conclusion. These two solutions are the exact negation of one another and cannot be disambiguated from one another by the inclusion of RDC data from any number of additional alignment media. It is important to note that there are exceptions to what has been shown here and these exceptions have been discussed further in section 2.3.
Figure 1.
Possible locations for a vector with given RDC data in (a) one alignment medium, (b) two alignment media, and (c) three alignment media.
As discussed in section 2.2, 5n-3 number of variables is required to describe n relative order tensors. Furthermore, representing k individual normalized vectors in polar coordinates requires 2k independent variables. Therefore, simultaneous study of n relative order tensors and k vectors will require 5n-3+2k independent parameters while resulting nk RDC data points. Since each RDC data point corresponds to an equation in the variables describing the k vectors and n relative order tensors, it can be argued that in theory, simultaneous estimation of relative order tensors and reconstruction of vectors is possible so long as nk ≥5n+2k-3. For example when n=3, k ≥12 should suffice for determining relative order tensors and orientation of internuclear vectors simultaneously. In particular, equation 12 can be formulated, which provides a complete description of the observed RDC values from n alignment media for vector i as a function of its polar coordinates (θi ϕi) and n relative order tensors. Relative order tensors and the orientation of vectors can be obtained simultaneously by solving this system of equations.
| 12 |
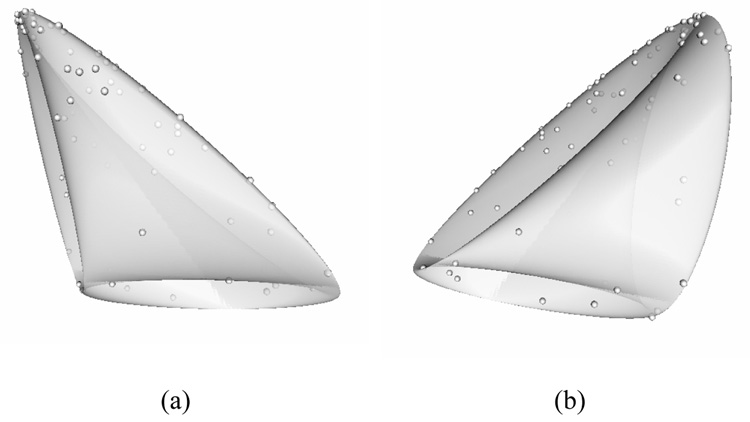
This problem can be visualized by noting that this system of RDC equations (equation 12) defines a mapping between the points on the surface of the unit sphere to the point (r1, r2, …, rn), that characterizes the RDC values corresponding to that vector in each alignment medium. The collection of these n dimensional points originated from an infinite number of randomly distributed vectors defines a curved surface, denoted as the nD-RDC surface, which is purely a function of n relative order tensors. The shape of this surface for a sample set of three order tensors is shown in Figure 2. There are several important points to note here. Firstly, since each vector always produces the same RDC values as its negation [27; 40], each point on the surface of the nD-RDC surface corresponds to two vectors. The notable exception to this is the places where the surface intersects itself. The points that lie along any intersection correspond to 4 vectors. In the presence of noisy data, if a point lies in the space near an intersection where it is close (within the experimental error tolerance) to two different parts of the 3D-RDC surface, it will be impossible to know which of the two parts of the surface it originated from, and instead of 2 vector solutions, this may give rise to 4 vector solutions. In practice however, this is not a common occurrence.
Figure 2.
3D-RDC surface topology for a sample set of 3 relative order tensors with points corresponding to actual data points for a protein. (a) and (b) illustrate the same object from two different views to give a better sense of the 3D-RDC surface’s unusual topology.
It is important to note that the shape and orientation of the nD-RDC surface (Figure 2) is invariant to changes in molecular frame. A change in the relative orientation of the molecular frame to the anchor frame corresponds to a rotation of the infinite set of vectors distributed along a unit sphere. Because a rotation of a sphere results in an identical sphere, the nD-RDC surface remains unaffected. The problem of estimating order tensors can then be conceptualized as performing a best fit of nD-RDC surfaces to the data, and the problem of solving for vectors can be conceptualized as taking the inverse of the mapping from vectors to nD-RDC points. In practice, however, surface fitting is very time consuming and computationally inefficient. Due to the inefficiency of surface fitting methods, we are proposing an alternative approach to obtain a solution for equation 12. The ability to estimate vectors from order tensors coupled with the ability to estimate order tensors from vectors suggests the possibility of an iterative approach to estimating relative order tensors and reconstructing vectors in space.
1.4. Solution space degeneracy of relative order tensors
While the nD-RDC problem is solvable, there may exist a finite number of degenerate solutions for some instances of nD-RDC data instead of a single unique solution. Here we will provide an informal presentation of this phenomenon.
Firstly, for a given set of relative order tensors and a vector v⃗, both v⃗ and −v⃗ produce the same RDC value [27; 40]. That is, a vector and its exact negation always produce the same RDC value in every possible alignment medium. Secondly, negation of sxy and sxz for all of the relative order tensors and simultaneous negation of the x-component of each vector will produce the same exact RDC values. This, of course, also applies to negating other off-diagonal elements of the relative order tensors and their corresponding Cartesian coordinate as shown in Table 1.
Table 1.
All combination of sign degeneracies of relative order tensors.
| sxy | sxz | syz | x | y | z | |
|---|---|---|---|---|---|---|
| 1 | + | + | + | + | + | + |
| − | − | − | ||||
| 2 | − | − | + | − | + | + |
| + | − | − | ||||
| 3 | − | + | − | + | − | + |
| − | + | − | ||||
| 4 | + | − | − | + | + | − |
| − | − | + |
At first, this degeneracy may appear to increase the solution space to 8-fold. However, when reconstructing vectors in space, relative orientation of all vectors with respect to each other is of critical importance. Negation of the off-diagonal elements of the relative order tensors will result in the negation of the corresponding coordinate for all vectors in space. Equation 13 can be employed to study the effect of the relative orientation of vectors as the result of this sign toggling.
| 13 |
The relative orientation of the vectors with respect to each other is conserved since the negations of the x, y or z components of all the vectors results in a cancellation when calculating the relative orientation of the vectors. Note that some combination of these negations may lead to inversion of space chirality, but will preserve the relative orientation of vectors in space.
Materials and Methods
1.5. Residual Dipolar Couplings
During the testing and evaluation of our methods, we have utilized simulated RDC data from three different proteins: 1A4Y (446 residues), 110M (153 residues) and 1SF0 (69 residues). These three proteins have been selected on the basis of their sizes to represent large, medium and small proteins respectively. Theoretical RDC data have been computed for these proteins with ±1 Hz error added from a uniform distribution to simulate experimental noise using the order tensors described in Table 2 and Table 3. Table 2 describes the order tensors in terms of principal order parameters and Euler angles. Table 3 lists the five essential elements that are necessary for complete reconstruction of the same order tensors as in Table 2. Although both of these tables describe the same order tensors, the latter representation reduces some ambiguities arising from the Euler angle representation. Furthermore, it is important to note that while equivalence of two order tensors can be established when their individual elements are equal, the converse is not true. Two order tensors may be composed of varying individual order parameters but produce RDC data in agreement to within the experimental error. It is therefore advisable to perform the comparison of two order tensors by observing their corresponding SF plots as well as comparison of the individual principal order parameters as demonstrated in section 4.1. The utility of simulated RDC data is invaluable to the proper study of a computational method since the ground truth is known ahead of time.
Table 2.
Order tensors used for simulation of RDC data.
| ×10−4 | Sxx | Syy | Szz | α | β | γ |
|---|---|---|---|---|---|---|
| M-I | 3.00 | 5.00 | −8.00 | 0° | 0° | 0° |
| M-II | −4.00 | −6.00 | 10.00 | 40° | 50° | 60° |
| M-III | −2.00 | −5.00 | 7.00 | −40° | −50° | 60° |
Table 3.
Five critical components of the order tensors used for simulation of the RDC data
| ×10−4 | sxx | sxy | sxz | syy | syz |
|---|---|---|---|---|---|
| M-I | 3.00 | 0.00 | 0.00 | 5.00 | 0.00 |
| M-II | −0.30 | 4.08 | 6.27 | −0.61 | 4.40 |
| M−III | 1.07 | −2.37 | −3.60 | −1.46 | 4.32 |
In addition to the simulated data, we have also used experimentally collected RDC data for the protein 1P7E from the BMRB database [41]. Five sets of RDC data were available for this protein and all five were used as an illustration of the flexibility of our approach in accommodating experimental data from more than 3 alignment media.
1.6. Algorithm for Simultaneous Reconstruction of Vectors and Estimation of Relative Order Tensors
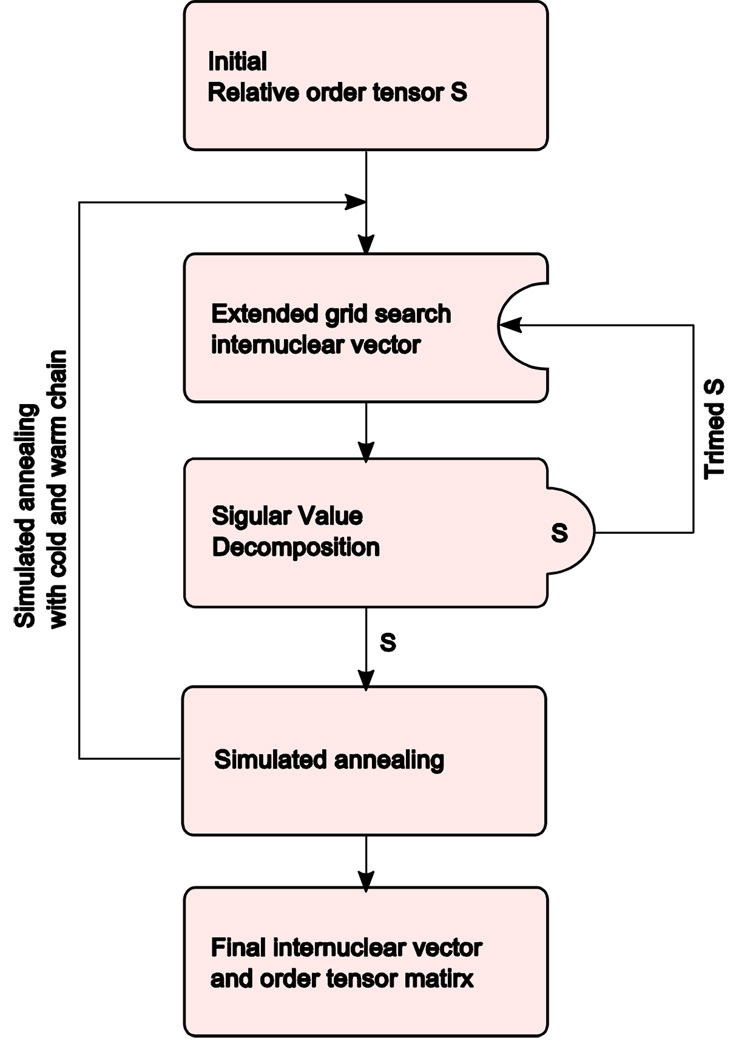
Our proposed method operates in two major parts as shown in Figure 3. First, using a given set of relative order tensors, the orientation of corresponding vectors will be constructed in space. During the second step, a set of relative order tensors are obtained by using SVD and the reconstructed set of vectors from the first step. Iteration of these two steps is continued until convergence of the fitting score. The definition of the objective score utilized in this algorithm is shown in equation 14, where K indicates the total number of vectors and N indicates the total number of alignment media. Entities and in this equation denote the experimental and computed RDC values for the kth vector obtained from alignment medium n respectively.
| 14 |
Figure 3.
The algorithm for back-calculation of internuclear vector and relative order tensor matrix
Optimization of the declared objective function (equation 14) is relatively trivial when the proposed initial relative order tensors are in close proximity of the optimal solution. Since currently there is no existing method of estimating the orientational components of the anisotropy from unassigned RDC data, the presented method is forced to start from randomly selected orientational components of the relative alignment tensors. The initial principal order parameters are roughly estimated based on the observed minimum and maximum RDC values within each alignment medium. The search for the optimal principal order parameters is confined to a generous range provided by the user to assist with a more rapid convergence. A combination of grid search and simulated annealing [42] have been implemented as the core optimization engine of our approach in order to increase the likelihood of convergence to the optimal solution from a distant starting point. Simulated annealing has been integrated in order to eliminate the entrapment in local minima during higher annealing temperatures. Simulated annealing, during the lower annealing temperatures, will enable fine refinement of best solutions. Generally, convergence of the algorithm can be determined by observing value of the objective function (equation 14) to become sufficiently low to fall within the experimental error of the RDC data set. The process of heating and cooling is recommended to be repeated several times to ensure the discovery of a near global optimal point. Convergence of each instance of search is normally achieved within 50 steps, which approximately consumes less than a minute of execution time on a typical desktop computer. Based on empirical observation, the process of optimization from a starting random point is recommended to be repeated 10–20 times in order to provide adequate robustness to noisy data and convergence toward a deeper minimum point. Overall execution of the presented algorithm is therefore in the order of one to two hours on a typical single CPU, desktop computer.
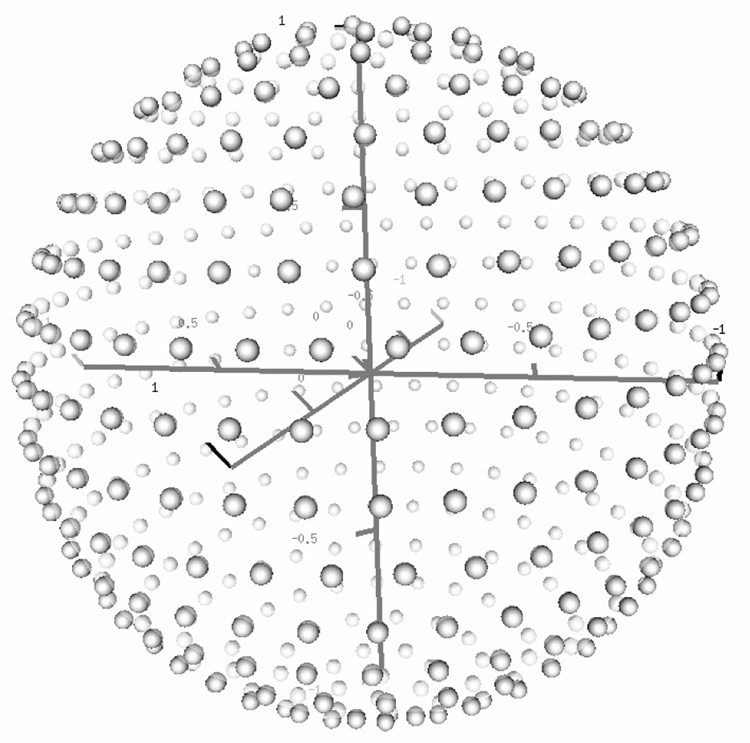
The first step in our approach consists of reconstructing the set of vectors in space from an initial value of the relative order tensors S. There are two possible approaches to reconstructing a set of vectors from order tensor estimates and RDC data; either a closed form solution, where the orientation of a vector can be computed from a given nD-RDC data point, or a search of all possible vectors on the unit sphere. The former approach is generally preferable since it yields a solution with theoretically infinite precision in a fixed computation time. However, our attempt at manipulation of the system of equations shown in equation 12 with symbolic math program Maple (http://maplesoft.com/) did not yield a closed form solution. Therefore, our method relies on the latter approach by creating a finite number of isotropically distributed vectors as listed in equation 15 below. Figure 4 provides an illustration of isotropically generated vectors with n=15.
| 15 |
In this equation, 0 ≤ i ≤ n, 0 ≤ j ≤ ⌊2nsin (θij)⌋ and (θ,φ)ij denote the polar coordinates of the internuclear vector. The density of the vectors can be adjusted by the parameter n and the total number of inter-nuclear vectors N can be approximated by equation 16. Using this discrete search mechanism, any internuclear vector can be captured by this isotropic vector set within an error of . During our experiments, isotropically generated vectors with n=50 have been adequate
| 16 |
Figure 4.
An illustration of systematically generated isotropic vectors on a unit sphere.
1.7. Evaluation of Fitness of a Template Protein Structure to the Reconstructed Vectors
To demonstrate the utility of constructed vectors in space without assignment, we present its application in evaluation of the fitness of a proposed structure based on unassigned RDC data. The presented method differs from that of the previously reported work [30; 31]. The new approach proceeds by first reconstructing the vectors in space followed by evaluation of fitness of any proposed structure based on matching of the reconstructed vectors to the vectors from the proposed structure. The proposed protein structure may come from different sources such as computational modeling tools, homologous proteins from PSI-BLAST, or X-ray structure for validation.
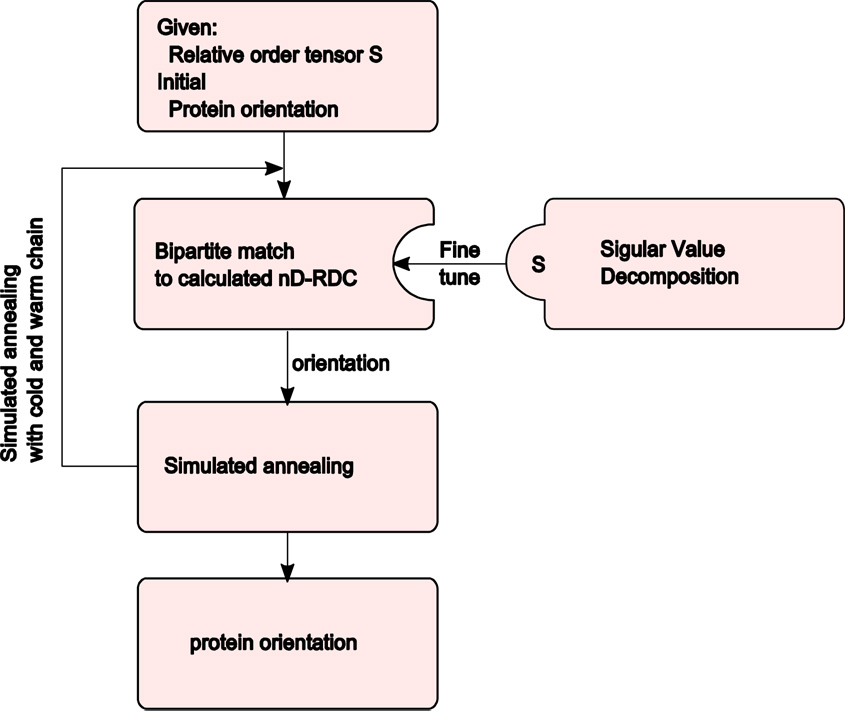
The general flowchart of our matching algorithm is shown in Figure 5. Our matching algorithm consists of a search over all Rzyz rotations that yield the best matching between the reoriented set of vectors from the proposed structure and the set of vectors estimated from the RDC data. Matching between two sets of vectors takes place by first back-calculating the theoretical RDC values for the proposed structure followed by identifying the best match to the experimental set of data by using a bipartite matching algorithm [43]. A bipartite matching algorithm seeks to produce a least cost, matching two sets of data. The bipartite matching algorithm possesses the advantage of producing an optimal match between two complete data sets with O(n3) execution time where n is the number of data points in each set. Note that this is a significant improvement over the O(n!) execution time that is required for exploring all possible matching permutations.
Figure 5.
Algorithm of protein structure assessment
Theoretically, it is reasonable to use grid search to find the best orientation. But in practice, simulated annealing is required to facilitate the convergence to a near optimal solution. The score with best orientation is the fitting score of the template protein structure to the nD-RDC data.
It is inevitable that the estimated relative order tensors will contain some error due to reconstruction of vectors that may be in slight violation of geometrical constraints such as dihedral or bond angle constraints. When presented with vectors that have been derived from a valid structure, individual vectors are confined by geometrical constraints defined by the protein structure. These differences between the reconstructed set of vectors and the proposed set of vectors can be mitigated by utilizing singular value decomposition to fine-tune the estimated value of S. After the bipartite match, singular value decomposition can be applied to the system to obtain a more refined relative order tensor. Only small adjustments within a given error tolerance are allowed based on the initial S that was obtained from the previous step. Experiments show that this fine-tuning can effectively improve the precision of relative order tensor estimates while virtually eliminating any sign degeneracy of the estimated relative order tensors.
Results
1.8. Theoretical RDC Data
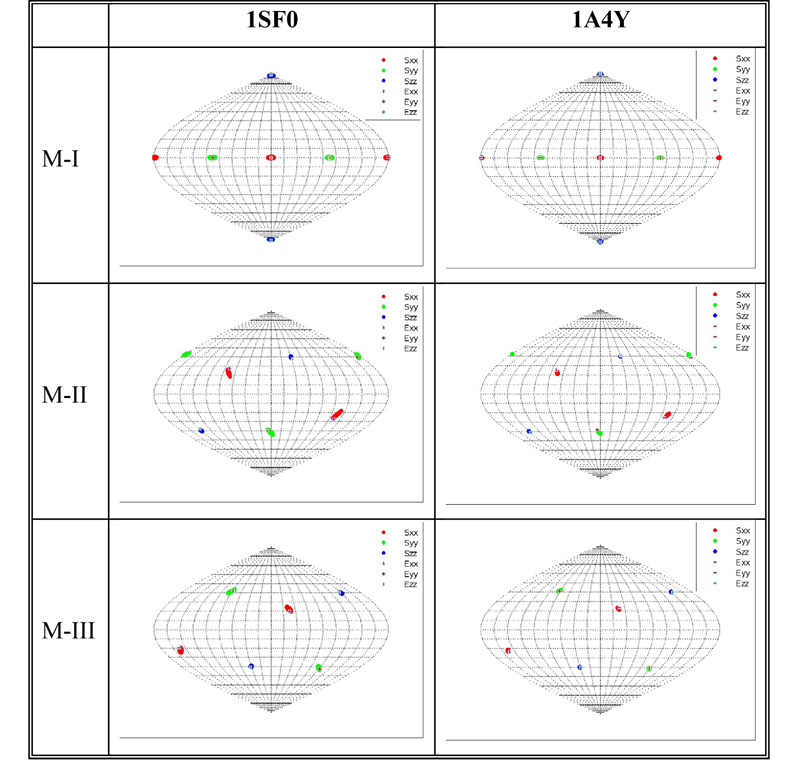
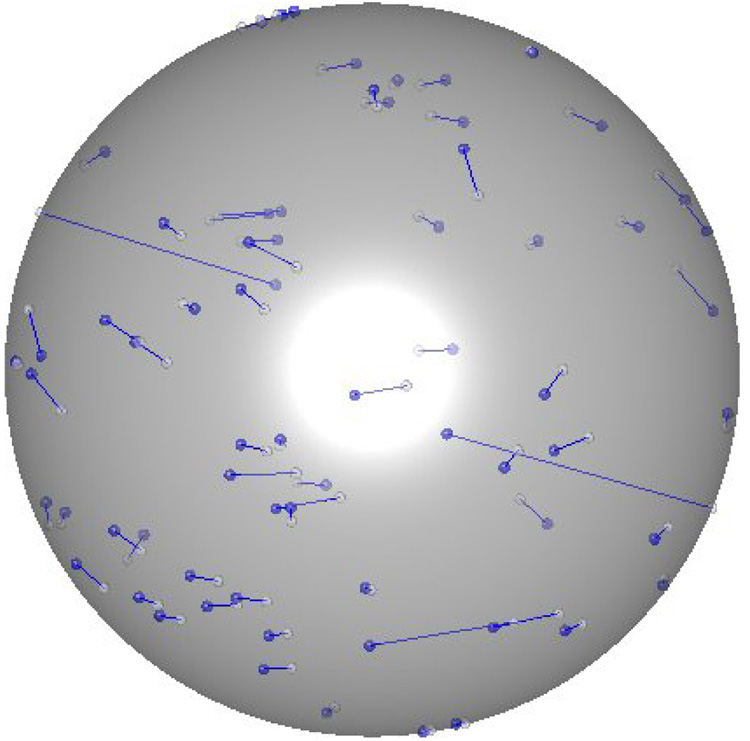
Theoretically generated RDC data as described in section 3.1 have been subjected to estimation of the relative order tensors. The five critical components of the resulting estimated order tensors are listed in Table 4. The results shown in these tables correspond to test proteins 1A4Y, 110M and 1SF0 respectively and should closely resemble that of the known relative order tensors listed in Table 3 in order to indicate a successful estimation. Although the listed results display a clear resemblance to the original order tensors, they are not exact. It is therefore important to properly quantify the similarity between these results. However, the comparison of any two given order tensors is not as trivial as it may appear. It is important to note that simple comparison of individual elements of two order tensors may be misleading. Individual elements of two order tensors may exhibit large differences (as much as 100%) and yet produce nearly indistinguishable sets of RDCs. The complexity arises for a number of reasons. Mainly, the composition of an order tensor exhibits a linear relationship with respect to the principal order parameters and a quadratic relationship with respect to the orientation of the alignment frame (refer to equation 5). A more meaningful comparison of any two order tensors should consist of two separate steps: a comparison of the principal order parameters and a comparison of orientational components of the anisotropy. Here, it is adequate to numerically compare the principal order parameters of two given order tensors and visually compare the orientational components in the form of a SF-plot as described before [26; 27]. The principal order parameters are listed in Table 5 for all three proteins. The SF-plots illustrating a visual comparison of the orientational components of the relative order tensors are shown for only two proteins (1SF0 and 1A4Y) in Figure 6. The SF-plot of the protein 110M has been neglected for brevity. Figure 6 illustrates all acceptable order tensors that will generate RDC data within 1Hz of the simulated RDC data. The value of ±1Hz corresponds to the noise level that was used during the generation of simulated RDC data. In addition to this cluster of valid order tensors, the estimated order tensor obtained from 3D-RDC analysis has been superimposed. Without careful examination of these SF-plots, the location of the estimated relative order tensors is difficult to observe simply because they are embedded within the cluster of solutions. These results indicate that our proposed nD-RDC method is capable of producing a valid order tensor from RDC data corrupted with ±1 Hz of error. Figure 7 provides a graphical representation of the actual backbone N-H vectors of the protein 1SF0 (in blue) and the reconstructed positions (in white). In this image, the inversion relative of each possible reconstructed vector has been removed manually. The reconstructed vectors exhibit an average accuracy of ~5° with respect to the original one. This protein has been intentionally selected because it is the smallest protein and the scarcity of RDC data will in general lead to a less precise estimation of the order tensor. Reconstruction of vectors in space for this protein will therefore serve as an example of a more challenging case.
Table 4.
Resulting five critical elements of the relative order tensor estimates for the protein 1A4Y, 110M and 1SF0.
| Structure | Medium | sxx×10−4 | sxy×10−4 | sxz×10−4 | syy×10−4 | syz×10−4 |
|---|---|---|---|---|---|---|
| 1A4Y | M-I | 3.18 | 0.00 | 0.00 | 4.97 | 0.00 |
| M-II | −0.66 | 4.11 | 6.22 | −0.56 | 4.49 | |
| M-III | 1.33 | −2.33 | −3.68 | −1.66 | 4.3 | |
| 110M | M-I | 2.96 | 0.00 | 0.00 | 4.78 | 0.00 |
| M-II | −0.7 | −3.78 | 5.89 | −0.22 | −4.3 | |
| M-III | 1.44 | 2.3 | −3.55 | −1.68 | −4.09 | |
| 1SF0 | M-I | 3.44 | 0.00 | 0.00 | 5.16 | 0.00 |
| M-II | −0.28 | 4.84 | −6.43 | −0.19 | −4.74 | |
| M-III | 0.75 | −2.58 | 3.99 | −1.35 | −4.72 |
Table 5.
Resulting five critical elements of the relative order tensor estimates for the proteins 1A4Y, 110M and 1SF0.
| Structure | Medium | Sxx×10−4 | Syy×10−4 | Szz×10−4 |
|---|---|---|---|---|
| 1A4Y | M-I | 3.18 | 4.97 | 8.14 |
| M-II | −4.03 | −6.03 | 1.01 | |
| M-III | −1.92 | −5.13 | 7.05 | |
| 110M | M-I | 2.96 | 4.78 | 7.74 |
| M-II | −3.72 | −5.89 | 9.61 | |
| M-III | −1.83 | −4.93 | 6.75 | |
| 1SF0 | M-I | 3.43 | 5.16 | −8.6 |
| M-II | −4.36 | −6.37 | 10.7 | |
| M-III | −2.41 | −5.27 | 7.67 |
Figure 6.
Orientational components of the relative alignment tensors for two proteins compared to all allowed solutions for proteins 1SF0 and 1A4Y. Sxx, Syy and Szz in these figures denote the direction of solutions obtained from REDCAT while Exx, Eyy and Ezz denote the direction of the solutions obtained from nD-RDC method.
Figure 7.
A diagram of reconstructed and actual vectors for 1SF0.
1.9. Experimental RDC Data and Evaluation of Fitness of a Template Structure
The assigned experimental RDC data from the protein 1P7E were obtained from BMRB[41]. 1P7E is the structure of a 56 residue, immunoglobulin G binding protein, which had been previously obtained through refinement of an initial X-ray structure using RDC data [44]. The backbone N-H RDC data in addition to the assignment of data and atomic coordinates were used to obtain the best order tensor solution using the program REDCAT [27]. The resulting best order tensors are listed in Table 6 for each of the 5 alignment media. The last column in this table displays the total number of RDC data that were available for each alignment medium. Because of the missing data, only the vectors with data present in all alignment media were used (a total of 40 vectors). Here the alignment medium M1 has been selected as the anchor medium and the structure of the protein has been rotated so that the MF coincides with the PAF of M1. The best order tensors obtained are used to gauge the success of our proposed nD-RDC analysis method in estimating the relative order tensors from each of the five alignment media. The results of the nD-RDC analysis are listed in Table 7. As before, only the five critical components of each order tensor are listed in this table.
Table 6.
The order tensor matrices of 1P7EA.
| ×10−4 | sxx | sxy | sxz | syy | syz | # RDCs |
|---|---|---|---|---|---|---|
| M 1 | 2.33 | 0.00 | 0.00 | 9.56 | 0.00 | 43 |
| M 2 | 0.29 | −0.89 | 3.55 | 4.66 | 1.04 | 43 |
| M 3 | 1.25 | −3.55 | −6.88 | −4.04 | 4.42 | 43 |
| M 4 | 3.12 | −4.63 | −3.1 | 1.09 | 5.79 | 41 |
| M 5 | −0.57 | 2.88 | −0.49 | 7.13 | −2.86 | 42 |
Table 7.
The back-calculated order tensor matrices by applying algorithm 2.
| ×104 | sxx | sxy | −sxz | syy | −syz |
|---|---|---|---|---|---|
| M 1 | 4.26 | 0 | 0 | 8.87 | 0 |
| M 2 | 1.15 | −0.75 | −3.58 | 4.51 | −0.7 |
| M 3 | −0.38 | −3.76 | 6.23 | −3.72 | −4.86 |
| M 4 | 2.26 | −4.65 | 2.32 | 1.22 | −6.11 |
| M 5 | 1.18 | 2.88 | 0.67 | 6.67 | 2.86 |
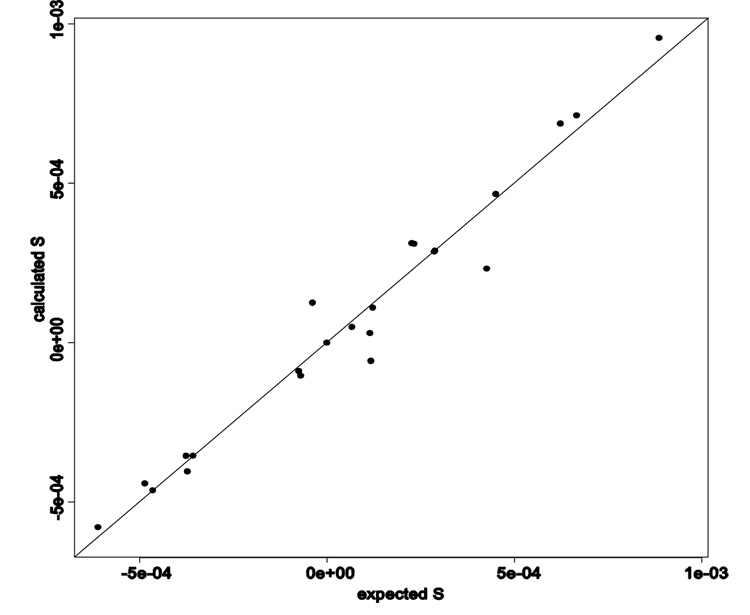
Note that two elements sxy and sxz of the estimated order tensors exhibit sign differences due to the degeneracy property discussed in section 2.4. Aside from the sign degeneracy, the back-calculated order tensor matrices have been well estimated. A graphical comparison between the expected and estimated elements of the relative order tensors is illustrated in Figure 8 after a manual correction of the sign degeneracy. Each point in this figure corresponds to one of the 23 non-zero elements of the five relative order tensors. The diagonal line in this figure represents the ideal case of perfect estimation of the unknown parameters. Based on the contents of this figure, the proposed method has been very effective in estimating the five relative order tensors. The overall effect of a few points that deviate slightly from the ideal line is very minimal as demonstrated in section 4.1. When decomposed, the effect of these slightly deviated elements of the relative order tensors falls within the allowed error for both principal order parameters and the orientational components of the anisotropy,
Figure 8.
The relationship between expected and back-calculated S (with signs corrected)
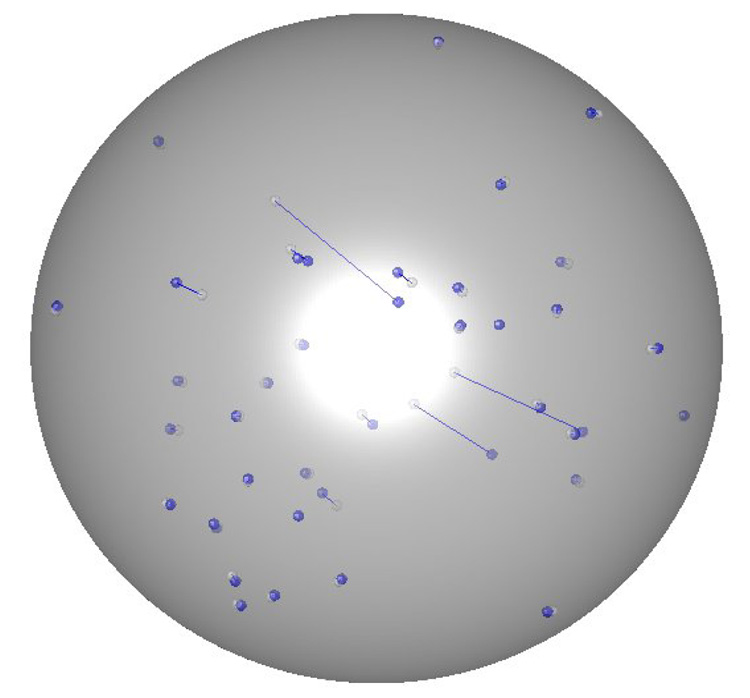
The presented method of nD-RDC analysis is capable of simultaneous reconstruction of the interacting vectors and estimation of the relative order tensor matrices from RDC data alone. Figure 9 provides a visual comparison between the actual orientation of the backbone N-H vectors of the 1P7E and the reconstructed vectors. In this plot, each inter-nuclear vector is originated from center of the ball and terminated with a dot on the surface of a unit sphere. The back-calculated (blue) and the expected (white) internuclear vectors are linked by a line to illustrate the magnitude of orientational error. Based on results shown in Figure 9, some back calculated internuclear vectors are more accurate than others. 36 out of 40 internuclear vectors are back-calculated within an error of less than 4° and 32 vectors are within an error of less than 2°. These results are in perfect agreement with our theoretical understanding of the RDC interaction. This varying degree of success is simply rooted in varying sensitivity of RDC to the orientation of the interacting vector within the alignment frame.
Figure 9.
Comparison between expected (white) and back-calculated internuclear vector (blue).
1.10. Assessment of Structural Fitness
The information regarding the reconstructed vectors in space can be of great benefit in a number of applications. Here we present results that demonstrate the utility of our proposed method of simultaneous reconstruction of vectors and estimation of relative order tensors despite the two-fold degeneracy in the vector solution space. Inclusion of information such as a template structure will automatically resolve degeneracy ambiguities in vectors while providing the rotational relationship between the molecular frame and the principal alignment frame of the anchor medium.
Table 8 lists the results for assessment of six structures as potential structural templates. Here we utilize the experimentally collected RDC data for 1P7E to evaluate the efficacy of a vector matching approach to identifying the appropriate template. The template protein structures are collected from CATH homologous superfamily 3.10.20.10 (Immunoglobulin Binding Protein) with sizes ranging from 56 to 70 residues. Application of the algorithm discussed in section 3.2 to each template protein domain generated the results listed in Table 8. The first column in this table provides the PDB identification code. The subsequent columns provide the score of our matching algorithm, the structural similarity measured to 1P7E over the backbone C α atoms and size of each structure respectively. Based on these results, not only has the correct structure been identified, but there is also a reasonable degree of correlation between the nD-RDC score and the structural similarity.
Table 8.
Protein structure assessment using reconstructed vectors from unassigned RDC data for 1P7E.
| Template Domain | RDC fitting score | RMSD | Size |
|---|---|---|---|
| 1P7E:A | 0.146 | 0 | 56 |
| 1IGD:A | 0.243 | 0.32 | 61 |
| 1PGX:A | 0.236 | 0.42 | 70 |
| 1MHH:E | 0.319 | 1.88 | 63 |
| 1MHH:F | 0.321 | 2.04 | 62 |
| 1XF5:M | 0.343 | 2.74 | 67 |
Discussion and Summary
The analysis of unassigned RDC data presented here provides a mechanism for accurate estimation of the principal order parameters and relative orientational information regarding alignment of the subject protein in several media. This is the first method that forgoes the need for assignment of data and the need for preexisting structure. Accurate estimation of the principal order parameters can be invaluable in detecting internal motion between two domains of the molecular complex. A-priori knowledge of the POPs can be very beneficial in advancing the currently existing strategies in structure determination from RDC data [11; 13; 17; 39; 45]. Because of its minimum data requirement, (3 RDC data per vector from at least 12 vectors) our proposed method may provide new avenues of structure determination in challenging cases such as membrane proteins.
Accurate estimation of the orientational components of anisotropy in addition to the POPs, extends the utility of our proposed work in novel directions. This report has demonstrated the successful use of the knowledge of the relative order tenors in reconstructing the interacting vectors. As an example application, successful identification of the most homologous protein structure has been demonstrated.
The apparent close correlation between the score of the proposed method and the backbone rmsd of structures can be suggestive of many exciting applications of this new approach. It is easy to envision a novel protein target selection mechanism for use by the community of PSI and structural genomics initiatives. A more effective means of target selection will assist in rapid completion of the most diverse and inclusive set of protein structures. In addition, the proposed method may also be deployed as the means to bridge the gap between the experimental and computational approaches to protein structure determination. Often times, protein modeling programs produce a list of most likely structures. These structures may exhibit as much as 11 Å structural diversity measured over the backbone Cα atoms [30]. Existence of methods for validation and/or selection of the correct structure from a list of proposed structures by using an affordable set of experimental data (unassigned RDC data) may be of great benefit. A reliable and theoretically sound method can help in validating a computationally modeled structure with a small amount of inexpensively acquired experimental data. The structure of an unknown protein can be predicted by computational methods or determined by experimental methods. The computational methods are considered cheap and fast, but the quality of the prediction still depends on a number of factors. Therefore, blind acceptance of the computational modeling results is still not a common practice. On the other hand, experimental methods can determine protein structure with high resolution at expensive cost and a long data acquisition and analysis time. In experimental data collection procedures, RDC data are relatively easy to collect while NOE data are much more costly. Although a small amount of unassigned RDC data does not provide enough information for construction of a high-resolution protein structure, it can play an important role in filtration of impossible structures and evaluation of the fitness of a proposed protein structure, which could be selected from either computational methods or by identifying homologous proteins.
Acknowledgments
This work has been funded by NSF grant number MCB-0644195 and grant number 1R01GM081793 from National Institutes of Health to Dr. Homayoun Valafar.
Footnotes
Publisher's Disclaimer: This is a PDF file of an unedited manuscript that has been accepted for publication. As a service to our customers we are providing this early version of the manuscript. The manuscript will undergo copyediting, typesetting, and review of the resulting proof before it is published in its final citable form. Please note that during the production process errors may be discovered which could affect the content, and all legal disclaimers that apply to the journal pertain.
References
- 1.Tjandra N, Tate S, Ono A, Kainosho M, Bax A. The NMR structure of a DNA dodecamer in an aqueous dilute liquid crystalline phase. Journal of the American Chemical Society. 2000;122:6190–6200. [Google Scholar]
- 2.Vermeulen A, Zhou HJ, Pardi A. Determining DNA global structure and DNA bending by application of NMR residual dipolar couplings. Journal of the American Chemical Society. 2000;122:9638–9647. [Google Scholar]
- 3.Azurmendi HF, Martin-Pastor M, Bush CA. Conformational studies of Lewis X and Lewis A trisaccharides using NMR residual dipolar couplings. Biopolymers. 2002;63:89–98. doi: 10.1002/bip.10015. [DOI] [PubMed] [Google Scholar]
- 4.Tian F, Al-Hashimi HM, Craighead JL, Prestegard JH. Conformational analysis of a flexible oligosaccharide using residual dipolar couplings. Journal of the American Chemical Society. 2001;123:485–492. doi: 10.1021/ja002900l. [DOI] [PubMed] [Google Scholar]
- 5.Yi XB, Venot A, Glushka J, Prestegard JH. Glycosidic torsional motions in a bicelle-associated disaccharide from residual dipolar couplings. 2004;126:13636–13638. doi: 10.1021/ja045697t. [DOI] [PubMed] [Google Scholar]
- 6.Assfalg M, Bertini I, Turano P, Mauk AG, Winkler JR, Gray HB. N-15-H-1 residual dipolar coupling analysis of native and alkaline-K79A Saccharomyces cerevisiae cytochrome c. Biophysical Journal. 2003;84:3917–3923. doi: 10.1016/S0006-3495(03)75119-4. [DOI] [PMC free article] [PubMed] [Google Scholar]
- 7.Bertini I, Longinetti M, Luchinat C, Parigi G, Sgheri L. Efficiency of paramagnetism-based constraints to determine the spatial arrangement of a-helical secondary structure elements. J. Biomol. NMR. 2002;22:123–136. doi: 10.1023/a:1014214015858. [DOI] [PubMed] [Google Scholar]
- 8.Clore GM, Starich MR, Bewley CA, Cai ML, Kuszewski J. Impact of residual dipolar couplings on the accuracy of NMR structures determined from a minimal number of NOE restraints. Journal of the American Chemical Society. 1999;121:6513–6514. [Google Scholar]
- 9.Clore GM, Bewley CA. Using conjoined rigid body/torsion angle simulated annealing to determine the relative orientation of covalently linked protein domains from dipolar couplings. Journal of Magnetic Resonance. 2002;154:329–335. doi: 10.1006/jmre.2001.2489. [DOI] [PubMed] [Google Scholar]
- 10.Clore GM, Schwieters CD. Docking of protein-protein complexes on the basis of highly ambiguous intermolecular distance restraints derived from H-1(N)/N-15 chemical shift mapping and backbone N-15-H-1 residual dipolar couplings using conjoined rigid body/torsion angle dynamics. Journal of the American Chemical Society. 2003;125:2902–2912. doi: 10.1021/ja028893d. [DOI] [PubMed] [Google Scholar]
- 11.Tian F, Valafar H, Prestegard JH. A dipolar coupling based strategy for simultaneous resonance assignment and structure determination of protein backbones. Journal of the American Chemical Society. 2001;123:11791–11796. doi: 10.1021/ja011806h. [DOI] [PubMed] [Google Scholar]
- 12.Blackledge M. Recent progress in the study of biomolecular structure and dynamics in solution from residual dipolar couplings. 2005;46:23–61. [Google Scholar]
- 13.Hus JC, Marion D, Blackledge M. Determination of protein backbone structure using only residual dipolar couplings. 2001;123:1541–1542. doi: 10.1021/ja005590f. [DOI] [PubMed] [Google Scholar]
- 14.Cornilescu G, Delaglio F, Bax A. Protein backbone angle restraints from searching a database for chemical shift and sequence homology. Journal of Biomolecular Nmr. 1999;13:289–302. doi: 10.1023/a:1008392405740. [DOI] [PubMed] [Google Scholar]
- 15.Fowler CA, Tian F, Al-Hashimi HM, Prestegard JH. Rapid determination of protein folds using residual dipolar couplings. Journal of Molecular Biology. 2000;304:447–460. doi: 10.1006/jmbi.2000.4199. [DOI] [PubMed] [Google Scholar]
- 16.Umemoto K, Leffler H, Venot A, Valafar H, Prestegard JH. Conformational differences in liganded and unliganded states of Galectin-3. Biochemistry. 2003;42:3688–3695. doi: 10.1021/bi026671m. [DOI] [PubMed] [Google Scholar]
- 17.Valafar H, Mayer K, Bougault C, LeBlond P, Jenney FE, Brereton PS, Adams M, Prestegard JH. Backbone solution structures of proteins using residual dipolar couplings: application to a novel structural genomics target. Journal of Structural and Functional Genomics. 2005;5:241–254. doi: 10.1007/s10969-005-4899-5. [DOI] [PMC free article] [PubMed] [Google Scholar]
- 18.Tolman JR. Dipolar couplings as a probe of molecular dynamics and structure in solution. Current Opinion in Structural Biology. 2001;11:532–539. doi: 10.1016/s0959-440x(00)00245-1. [DOI] [PubMed] [Google Scholar]
- 19.Tolman JR, Al-Hashimi HM, Kay LE, Prestegard JH. Structural and dynamic analysis of residual dipolar coupling data for proteins. Journal of the American Chemical Society. 2001;123:1416–1424. doi: 10.1021/ja002500y. [DOI] [PubMed] [Google Scholar]
- 20.Franzin CM, Gong X, Teriete P, Marassi FM. Structures of the FXYD regulatory proteins in lipid micelles and membranes. J Bioenerg Biomembr. 2007;39:379–383. doi: 10.1007/s10863-007-9105-y. [DOI] [PMC free article] [PubMed] [Google Scholar]
- 21.Gong X, Franzin CM, Thai K, Yu J, Marassi FM. Nuclear magnetic resonance tructural studies of membrane proteins in micelles and bilayers. Methods Mol Biol. 2007;400:515–529. doi: 10.1007/978-1-59745-519-0_35. [DOI] [PMC free article] [PubMed] [Google Scholar]
- 22.Marassi FM, Opella SJ. Simultaneous resonance assignment and structure determination in the solid-state NMR spectrum of a membrane protein in lipid bilayers. Biophysical Journal. 2002;82:467A–467A. [Google Scholar]
- 23.Mesleh MF, Veglia G, DeSilva TM, Marassi FM, Opella SJ. Dipolar waves as NMR maps of protein structure. Journal of the American Chemical Society. 2002;124:4206–4207. doi: 10.1021/ja0178665. [DOI] [PMC free article] [PubMed] [Google Scholar]
- 24.Opella SJ, Nevzorov A, Mesleh MF, Marassi FM. Structure determination of membrane proteins by NMR spectroscopy. Biochemistry and Cell Biology-Biochimie Et Biologie Cellulaire. 2002;80:597–604. doi: 10.1139/o02-154. [DOI] [PMC free article] [PubMed] [Google Scholar]
- 25.Opella SJ, Marassi FM. Structure determination of membrane proteins by NMR spectroscopy. Chemical Reviews. 2004;104:3587–3606. doi: 10.1021/cr0304121. [DOI] [PMC free article] [PubMed] [Google Scholar]
- 26.Losonczi JA, Andrec M, Fischer MWF, Prestegard JH. Order matrix analysis of residual dipolar couplings using singular value decomposition. Journal of Magnetic Resonance. 1999;138:334–342. doi: 10.1006/jmre.1999.1754. [DOI] [PubMed] [Google Scholar]
- 27.Valafar H, Prestegard JH. REDCAT: a residual dipolar coupling analysis tool. J Magn Reson. 2004;167:228–241. doi: 10.1016/j.jmr.2003.12.012. [DOI] [PubMed] [Google Scholar]
- 28.Warren JJ, Moore PB. A maximum likelihood method for determining D(a)(PQ) and R for sets of dipolar coupling data. J Magn Reson. 2001;149:271–275. doi: 10.1006/jmre.2001.2307. [DOI] [PubMed] [Google Scholar]
- 29.Clore GM, Gronenborn AM, Bax A. A robust method for determining the magnitude of the fully asymmetric alignment tensor of oriented macromolecules in the absence of structural information. Journal of Magnetic Resonance. 1998;133:216–221. doi: 10.1006/jmre.1998.1419. [DOI] [PubMed] [Google Scholar]
- 30.Bansal S, Miao X, Adams MWW, Prestegard JH, Valafar H. Rapid classification of protein structure models using unassigned backbone RDCs and probability density profile analysis (PDPA) J Magn Reson. 2008 doi: 10.1016/j.jmr.2008.01.014. [DOI] [PMC free article] [PubMed] [Google Scholar]
- 31.Valafar H, Prestegard JH. Rapid classification of a protein fold family using a statistical analysis of dipolar couplings. Bioinformatics. 2003;19:1549–1555. doi: 10.1093/bioinformatics/btg201. [DOI] [PubMed] [Google Scholar]
- 32.Prestegard JH, Kishore A. Partial alignment of biomolecules: an aid to NMR characterization. Current Opinion in Structural Biology. 2001;5:584–590. doi: 10.1016/s1367-5931(00)00247-7. [DOI] [PubMed] [Google Scholar]
- 33.Prestegard JH, al-Hashimi HM, Tolman JR. NMR structures of biomolecules using field oriented media and residual dipolar couplings. Q Rev Biophys. 2000;33:371–424. doi: 10.1017/s0033583500003656. [DOI] [PubMed] [Google Scholar]
- 34.Prestegard JH, Valafar H, Glushka J, Tian F. Nuclear magnetic resonance in the era of structural genomics. 2001;40:8677–8685. doi: 10.1021/bi0102095. [DOI] [PubMed] [Google Scholar]
- 35.Bax A, Kontaxis G, Tjandra N. Nuclear magnetic resonance of biological macromolecules, pt b. 2001. Dipolar couplings in macromolecular structure determination; pp. 127–174. [DOI] [PubMed] [Google Scholar]
- 36.Bax A. Weak alignment offers new NMR opportunities to study protein structure and dynamics. Protein Science. 2003;12:1–16. doi: 10.1110/ps.0233303. [DOI] [PMC free article] [PubMed] [Google Scholar]
- 37.Saupe A, Englert G. High-Resolution Nuclear Magnetic Resonance Spectra of Orientated Molecules. Phys. Rev. Lett. 1963;11:462–464. [Google Scholar]
- 38.Press W, Teukolsky Saul A, Vetterling William T, Flannery Brian P. Numerical Recipes in C, The Art of Scientific Computing. 2002 [Google Scholar]
- 39.Bryson M, Tian F, Prestegard JH, Valafar H. REDCRAFT: A tool for simultaneous characterization of protein backbone structure and motion from RDC data. J Magn Reson. 2008;191:322–334. doi: 10.1016/j.jmr.2008.01.007. [DOI] [PMC free article] [PubMed] [Google Scholar]
- 40.Al-Hashimi HM, Valafar H, Terrell M, Zartler ER, Eidsness MK, Prestegard JH. Variation of molecular alignment as a means of resolving orientational ambiguities in protein structures from dipolar couplings. 2000;143:402–406. doi: 10.1006/jmre.2000.2049. [DOI] [PubMed] [Google Scholar]
- 41.Ulrich EL, Akutsu H, Doreleijers JF, Harano Y, Ioannidis YE, Lin J, Livny M, Mading S, Maziuk D, Miller Z, Nakatani E, Schulte CF, Tolmie DE, Kent Wenger R, Yao H, Markley JL. BioMagResBank. Nucleic Acids Res. 2008;36:D402–D408. doi: 10.1093/nar/gkm957. [DOI] [PMC free article] [PubMed] [Google Scholar]
- 42.Greshenfeld NA. The Nature of Mathematical Modeling. 1998 [Google Scholar]
- 43.Cherkassky BV, Goldberg AV, Martin P, Setubal JC, Stolfi J. Augment or push: a computational study of bipartite matching and unit-capacity flow algorithms. J. Exp. Algorithmics. 1998;3:8. [Google Scholar]
- 44.Ulmer TS, Ramirez BE, Delaglio F, Bax A. Evaluation of backbone proton positions and dynamics in a small protein by liquid crystal NMR spectroscopy. J Am Chem Soc. 2003;125:9179–9191. doi: 10.1021/ja0350684. [DOI] [PubMed] [Google Scholar]
- 45.Delaglio F, Kontaxis G, Bax A. Protein structure determination using molecular fragment replacement and NMR dipolar couplings. Journal of the American Chemical Society. 2000;122:2142–2143. [Google Scholar]


