

Abstract
In the field of small animal positron emission tomography (PET), the assumptions underlying human and primate kinetic models may not be sustained in rodents. That is, the threshold dose at which a pharmacologic response occurs may be lower in small animals. In order to define this relationship, we combined microPET imaging using 11C-raclopride with microdialysis measures of extracellular fluid (ECF) dopamine (DA). In addition, we performed a series of studies in which a known mass of raclopride was microinfused into one striatum prior to a high specific activity (SA) systemic injection of 11C-raclopride. This single-injection approach provided a high and low SA region of radiotracer binding in the same animal during the same scanning session. Our data demonstrate that the binding potential (BP) declines above 3.5 pmol/ml (0.35 μg), with an ED50 of 8.55 ± 5.62 pmol/ml. These data also provide evidence that BP may be compromised by masses of raclopride below 2.0 pmol/ml (0.326 μg). Increases in ECF DA were produced by mass doses of raclopride over 3.9 pmol/ml (0.329 μg) with an ED50 of 8.53 ± 2.48 pmol/ml. Taken together, it appears that an optimal range of raclopride mass exists between 2.0 and 3.5 pmol/ml, around which the measured BP can be compromised by system sensitivity, endogenous DA, or excessive competition with unlabeled compound.
Keywords: MicroPET, Rodent, 11C-raclopride, D2 receptors, Microdialysis, Mass effect
The miniaturization of clinical positron emission tomography (PET) has produced a new generation of commercially available PET scanners, providing a powerful tool for imaging biological processes in small laboratory animals. With the microPET system and other small animal tomographs, a number of laboratories have started to validate animal models of different disease states (Araujo et al., 2000; Hume et al., 1996; Kornblum et al., 2000). Receptor-specific radiotracers have also been used to track gene expression following viral insertion of specific cDNA (MacLaren et al., 1999). This valuable tool has the potential to capture the functional relationship between receptors and neurotransmitters and has been used to measure neurotransmitter regulation in schizophrenia (Abi-Dargham et al., 2000), or the modulation of one neurotransmitter system by another (Dewey et al., 1988, 1990). Thus, it is ever more critical to establish whether the assumptions underlying clinical PET are appropriate for small animal imaging.
As the physical size of the animal decreases, the relative mass in a tracer dose becomes more significant, resulting in the possibility that the radiotracer itself may perturb the system under investigation. This, then, becomes a violation of the fundamental premise which unites the activity of a radioactive molecule to a physiologic process. That is, the sensitivity to the mass of injected ligand might distinguish small animal PET from its clinical counterpart, and present an important limitation on the interpretation of rodent PET data. This is especially relevant to radiotracers whose molecular targets are limited in number and, in the case of rodents, may be in sufficiently small enough concentrations to become saturated following routine human or large primate ‘tracer’ doses.
11C-raclopride binds to DA D2 receptors in humans (Farde et al., 1986). Furthermore, changes in its binding potential (BP) have been used as an indirect measure of changes in synaptic DA (Dewey et al., 1993). This indirect measure is, however, predicated on the basic assumption that the radio-tracer itself does not alter these levels. Several studies have explored putative mass effects with 11C-raclopride using kinetic simulations under high mass conditions (low specific activity; SA) designed to mimic the rodent and/or small primate brain (Hume et al., 1998; Morris et al., 1998). Combined with recent experimental data suggesting that the BP declines with mass doses as low as 1.4 or as high as 5.0 nmol/kg (Alexoff et al., 2003; Myers et al., 1997; Opacka-Juffry et al., 1998), there appears to be a condition under which the influence of mass is more significant (i.e. lower sensitivity cameras, low specific activity radiotracer synthesis). These studies suggest that there is a discrete range above which the mass effect is present and below which it is not. In reality, any amount of mass should alter the 11C-raclopride BP—the issue is to define the limits of this range when both instrument and animal size are dramatically reduced relative to the human PET data used to originally develop these tracer kinetic models (i.e. Logan et al., 1997).
To address this issue, we developed a novel methodology that incorporated simultaneous microdialysis sampling of extracellular fluid (ECF) DA with microPET imaging of 11C-raclopride. Further, we used a range of raclopride mass doses in an effort to estimate changes in BP in response to receptor blockade and/or increases in endogenous DA. Specifically, with microdialysis measures as an independent assay of DA responsivity, we compared changes in the measured 11C-raclopride BP with increases in ECF DA. We then applied these measures to estimate a threshold mass dose of raclopride which increased extracellular DA. Finally, we compared this to the range of mass doses which decreased 11C-raclopride BP in the same animal. Together, these studies determined the sensitivity of rat 11C-raclopride studies to radiotracer mass, and established a range of injected doses which failed to impact either striatal DA or 11C-raclopride BP.
A number of approaches have been proposed in the PET literature to reproduce, in vivo, the well-established in vitro paradigms designed to separate the density of receptors and their apparent affinity with the test ligand (Delforge et al., 2001; Doudet et al., 2003; Morris et al., 2004). In these studies, the measured relationship between multiple concentrations of bound and free ligand is used to derive single values of the total concentration of receptors and the apparent receptor–ligand affinity (Holden and Doudet, 2004). One requirement of these studies is the consecutive injection of multiple radiotracer concentrations, requiring an initial scan at high specific activity followed by, at the very least, an additional scan where the radiotracer is coinjected with its unlabeled form. While these studies have provided important insight into several issues, confounds remain. Perhaps the most important to 11C-raclopride studies is the effects of increasing antagonist concentrations on the concentration of DA (Gjedde and Wong, 2001).
Here we detail a new method that capitalizes on the microdialysis probe as a means to alter the concentration of unlabeled ligand in one striatum prior to the systemic administration of high specific activity radiotracer. Using this method, we achieved significant unilateral displacement of systemically administered 11C-raclopride (i.e. considerable receptor occupancy). With these studies, we established an effective experimental method whereby receptor density and affinity can be determined from a single imaging session using a single dose of radiotracer. Thus, the experimental strategy of combining microPET with simultaneous microdialysis appears to provide a convenient means to administer compounds and assess receptor modulation of neurotransmitter activity.
1. Materials and methods
This work was approved by the BNL IACUC. Forty eight (48) adult male Sprague–Dawley (Taconic Farms, New York) rodents weighing 275–300 g were used for this experiment. All animals were housed and maintained in an AAALAC accredited veterinary facility.
1.1. Microdialysis
Microdialysis surgery was performed as described previously (Schiffer et al., 2000). Briefly, 2 days prior to microPET imaging, siliconized guide cannulae were surgically implanted above the corpus striatum according to coordinates established with the atlas of Paxinos and Watson (1986); 0.5 mm anterior and 1.5 mm lateral to bregma, 2.5 mm below the surface of the brain. On the day of the study, probes were inserted 2.5 h prior to sample collection while the animals were awake and freely moving. One (1) hour after probe insertion, animals were anesthetized with a ketamine/xylazine coctail (10% xylazine in 100 mg/ml ketamine) and when stable anesthesia was maintained, microdialysate sample collection began. In most cases, the animal was stable and the first samples were collected 20 min prior to radioisotope delivery. Samples were collected every 3.0 min into a refrigerated fraction collector (∼4.0 °C, BAS, West Lafayette, IN) to coincide with later microPET time frames.
In a separate group of animals (n = 6), unlabeled raclopride was infused for 20 min at 5.0 μl/min through one striatum prior to a high SA, intravenous injection of 11C-raclopride. In these blocking studies, the efficiency of the membrane to raclopride diffusion was calculated using two separate in vitro experiments. In the first, a known amount of 11C-raclopride was infused through a microdialysis probe into a vial using an identical protocol for infusing raclopride into the striatum. After 20 min at 5.0 μl/min, the probe was removed and the amount of radioactivity in the vial was measured determined. In the second experiment, the same protocol was used with unlabeled raclopride and the concentration was assessed with high-pressure liquid chromatography (HPLC; Waters Novapak 18C; 250 mm × 10 mm).
Microdialysis samples were analyzed for DA content using microbore HPLC coupled with electrochemical detection as described previously (Schiffer et al., 2001). A refrigerated auto-injector (BAS Sample Sentinel, West Lafayette, IN) was used to analyze all samples. The relative recovery of DA from the striatum was estimated using the extraction fraction (EF, Eq. (1)) to describe the exchange of DA between the probe and tissue. The EF was calculated from a linear comparison of the DA concentration in a vial to that detected from the brain sample according to the modified equation from Bungay et al. (1990):
| (1) |
where Cd is the concentration of the DA detected from the microdialysis membrane, Cb the concentration of DA in the in vitro sample solution, Qd the perfusion flow rate, in this case 2.0 μl/min and R represents the resistance and can be derived from the slope of a permeability plot (Bungay et al., 1990). DA levels were summed and averaged before and after radiotracer injection, and DA levels prior to scanning served as baseline measures for post-injection values.
Our initial attempts to use the microdialysis probe as a means to infuse drugs were hampered by our inability to accurately locate, in vivo, the 340 μm microdialysis probe (OD) within the striatum. By failing to accurately locate the probe, we were unsure precisely which area of the striatum received the calculated concentration of unlabeled raclopride. Therefore, following each microPET study, we infused 11C-raclopride through the probe for 20 min and obtained a static emission scan. These scans were performed without moving the animal from the gantry, and were co-registered to the challenge scan according to the methods described below. This provided the ability to accurately locate the probe in the striatum, and localize the precise area for the region of interest (ROI) analysis. This area was well within the resolution of the tomograph. After the final scan, animals were sacrificed and probe placement was again verified by histologic examination.
1.2. microPET imaging
In these experiments, 42 animals received 11C-raclopride microPET scans with a range of SA. In these animals, concurrent microdialysis studies were completed with a routine perfusion of artificial cerebral spinal fluid (aCSF). In a separate group of six (6) animals, raclopride was administered via unilateral striatal microinfusion prior to the 11C-raclopride scan. MicroPET imaging was performed using an R4 tomograph (Concorde Microsystems, Knoxville, TN), which has a transaxial resolution of 2.0 mm full-width at half-maximum (FWHM) in a 12 cm animal port, with an image field of view of 11.5 cm. Each animal was positioned with its head in the center of the field of view. Emission scans began simultaneously with intravenous radioligand administration and continued for 60 min. Early microPET data were binned in 15–60 s intervals, with later data binned every 3 min to precisely coincide with microdialysate collection intervals. The binning produced 30 time frames (4 × 15 s, 3 × 20 s, 6 × 60 s, 17 × 180 s) and included subtraction of random coincidences collected in a delayed time window. The resulting sinogram data were rebinned using Fourier rebinning and reconstructed with two-dimensional filtered backprojection (FBP) with a ramp filter (Nyquist cutoff) and software provided by the manufacturer. Image sinograms were also reconstructed using the maximum a posteriori (MAP) reconstruction algorithm developed by Dr. Richard Leahy and colleagues (Qi et al., 1998). Image pixel size in FBP reconstructed images was 0.85 mm transaxially with a 1.21 mm slice thickness.
11C-raclopride was synthesized according to Farde et al. (1986). The SA was determined using HPLC (Waters Novapak 18C; 250 mm × 10 mm). Radioactivity measurements were obtained with a calibrated ion chamber (Capintec, Inc., Ramsey, NJ). At the time of injection, SA ranged from 0.11 to 2.3 Ci/μmol. The injected dose of 11C-raclopride ranged from 105 to 1500 Ci with 0.2–19.8 nmol/kg (69 ng/kg–6.9 μg/kg).
MAP reconstructed microPET images were co-registered to the radioactive microdialysis probe image and also to a 3D digital atlas of the rat brain (Toga et al., 1995), the latter using mutual information (MI) coregistration software. ROIs were drawn on MAP reconstructed images and transferred to FBP reconstructed images for quantitation of time activity and subsequent modeling. Co-registration and ROI analysis was performed with PMOD software (PMOD Group, Zurich, Zwitzerland, http://www.pmod.com). Left and right striata were analyzed separately. The BP was computed by applying the graphical analysis method without blood sampling from the equation:
| (2) |
From Logan et al. (1996), in which B′max represents the density of D2 receptor sites and K′D is the apparent affinity of raclopride for these sites. In the six animals that received raclopride infused directly through the probe, left and right striata were analyzed separately and the striatum contralateral to the infusion served as the control.
For these studies, we measured labeled and unlabeled raclopride probe permeability using two different approaches. In our first in vitro studies using parameters identical to those used in vivo, we measured radioactivity following no-carrier-added 11C-raclopride microinfusion. These experiments indicated that 0.63 ± 0.04% of the 11C-raclopride crossed the semi-permeable membrane of our probes. In a second series of studies, we used HPLC to measure the permeability of unlabeled raclopride through the same probe. These data confirmed our previous findings, yielding a value of 0.69 ± 0.007%. Based on these two independent measures, the efficiency of the probes for raclopride was calculated as 0.66%. This value was subsequently used to estimate the amount of raclopride delivered to the striatum ipsilateral to infusion and for the calculation of the effective SA.
In order to compare 11C-raclopride binding following specific mass doses of radiotracer with those following microinfusion of unlabeled raclopride, several assumptions were made. First, we assumed that the average amount of ligand in the free state was proportional to the amount delivered to the ROI, and thus proportional to the mass of injectate per bodyweight of rodent. To compare this with the mass of raclopride in the striatum which received a microinfusion of unlabeled compound prior to the 11C-raclopride injection, we estimated an SA for that region based on the mass of injectate combined with the mass extrapolated from the efficiency of the microdialysis membrane to raclopride. Therefore, the SA in the striatum which received the microinfusion (low SA) was calculated as a ratio of moles of radiotracer to moles of total, which included injected and infused raclopride. In these animals, SA in the contralateral striatum and cerebellum was calculated as moles of radiotracer to moles of total injectate. Further, we assumed that the striatal ROIs covered an area over which the infused raclopride was equally dispersed. To estimate this dispersion, we infused 11C-raclopride through the probe (Figs. 3-5). Comparisons between these animals and those where raclopride mass was associated solely with its synthesis were made using all striatal ROI values converted to pmol/ml. Finally, to estimate B′max, we assumed that the apparent affinity (K′D) was constant and that DA levels did not influence estimations of receptor density.
Fig. 3.

Dual-probe microdialysis measures of ECF DA with simultaneous microPET assay of 11C-raclopride time activity following a cold raclopride infusion into the ipsilateral striatum. Circles depict the time activity of 11C-raclopride (open) and extracellular DA (filled) in the striatum ipsilateral to an infusion of 45 nmol raclopride (corrected for probe permeability). Squares represent 11C-raclopride binding (open) and extracellular DA (filled) in the contralateral, control striatum. Triangles give the time activity of cerebellar 11C-raclopride. Time-activity data were fit to a tri-exponential model as described in the text. Inset: Top image captures 11C-raclopride microinfusion (∼50 μCi/probe) immediately following the study, the middle image depicts the distribution of 11C-raclopride at the level of the striatum. The two images are co-registered with PMOD software on the bottom. Right is right in the image.
Fig. 5.

Infusion of unlabeled raclopride through the microdialysis probe displaces 11C-raclopride and increases extracellular DA. (a) Maximum a posteriori (MAP) reconstructed 11C-raclopride radioactivity distribution in a control animal. The second panel of (a) illustrates the probe verification by microinfusion of 11C-raclopride following a control experiment in which the animal received an intravenous injection of 0.5 nmol/kg 11C-raclopride. (b) Simultaneous characterization of changes in extracellular DA vs. striatal and cerebellar 11C-raclopride binding in the same animals. Striatum (light grey circles and squares) and cerebellar (light grey triangles) time activity curves were fit to a set of three exponentials and the difference curve (black symbols) was used to extrapolate the pseudoequilibrium point used for the Scatchard plots. Details of the fitting procedure are described in the text. (c) Unlabeled raclopride locally applied to the right striatum prior to high SA systemic 11C-raclopride, followed by 11C-raclopride to verify probe placement. (d) Extracellular DA plotted against striatal and cerebellar radioactivity obtained from the same animal. Solid lines represent best fit through the data, obtained using a tri-exponential model as described in the text.
2. Results
Microdialysis was combined with microPET imaging to establish a range of raclopride mass that decreased 11C-raclopride BP and increased ECF DA. For the microdialysis measures of extracellular DA, our calculated extraction fraction of 0.3 was applied to the measured concentration of DA in the dialysate to correct for the efficiency of the transfer between tissue and probe. Using this correction, our basal levels of extracellular DA varied considerably across animals, with average values of 86.94 ± 6.81 nM. In all of the animals, the measured BP ranged from 0.6 to 4.68 and the mass ranged from 0.61 to 28.4 pmol/ml (0.125–1.93 μg), including the saturation experiments. Table 1 describes the incremental changes in mass and in each group, gives the change in ECF DA and BP, along with the measured test–re-test reproducibility of the BP in each group.
Table 1.
Concentration-dependent effects of raclopride mass on the measured binding potential (BP) of 11C-raclopride and extracellular dopamine (ECF DA)
| Dose range (pmol/ml) | Mean (pmol/ml) | nmoles | μg | %Δ ECF DA | BP (DVR-1) | BP (test/re-test) |
|---|---|---|---|---|---|---|
| Group 1: 0.5–1.0 (n = 5, animals 1–5*) | 0.78 ± 0.06 | 0.25 ± 0.17 | 0.13 ± 0.05 | 8.43 ± 0.03 | 3.20 ± 0.25 | ±10.72 |
| Group 2: 1.0–2.0 (n = 10, animals 6–15) | 1.52 ± 0.06 | 0.32 ± 0.02 | 0.15 ± 0.01 | 13.11 ± 7.34 | 3.39 ± 0.21 | ±1.23 |
| Group 3: 2.0–3.0 (n = 3, animals 16–18) | 2.68 ± 0.11 | 0.46 ± 0.02 | 0.23 ± 0.01 | 6.89 ± 4.75 | 3.70 ± 0.05 | ±2.07 |
| Group 4: 3.0–4.0 (n = 6, animals 19–24) | 3.55 ± 0.10 | 0.64 ± 0.02 | 0.32 ± 0.01 | 27.07 ± 13.42 | 2.88 ± 0.18 | ±10.70 |
| Group 5: 4.0–5.0 (n = 5, animals 25–30) | 4.44 ± 0.11 | 0.83 ± 0.07 | 0.41 ± 0.03 | 74.41 ± 28.13a | 2.26 ± 0.14a,b | ±7.60 |
| Group 6: 5.0–7.5 (n = 4, animals 31–34) | 6.65 ± 0.27 | 1.12 ± 0.05 | 0.56 ± 0.02 | 150.13 ± 13.00b,c,d,e | 2.24 ± 0.11f,g | ±16.39 |
| Group 7: 7.5–10.0 (n = 4, animals 35–38) | 8.52 ± 0.27 | 1.37 ± 0.07 | 0.68 ± 0.03 | 139.11 ± 11.49a,b,c,h | 2.25 ± 0.06f,g | ±20.04 |
| Group 8: 11.0–30.0 (n = 4, animals 39–42) | 22.47 ± 1.88 | 3.64 ± 0.28 | 2.46 ± 0.34 | 249.94 ± 18.71c,d,i,j,k,l | 0.99 ± 0.11d,i,j,l,m,nn | ±32.92 |
Significantly different from Group 2, P < 0.01.
Significantly different from Group 3, P < 0.01.
Significantly different from Group 1, P < 0.001.
Significantly different from Group 2, P < 0.001.
Significantly different from Group 4, P < 0.01.
Significantly different from Group 2, P < 0.05.
Significantly different from Group 3, P < 0.05.
Significantly different from Group 4, P < 0.05.
Significantly different from Group 3, P < 0.001.
Significantly different from Group 4, P < 0.001.
Significantly different from Group 5, P < 0.001.
Significantly different from Group 7, P < 0.05.
Significantly different from Group 5, P < 0.05.
Significantly different from Group 6, P < 0.05.
In those animals where the systemic injection of 11C-raclopride did not produce a significant DA response, the average BP (±S.E.M.) was 2.81 In these animals, there was also no significant correlation between basal DA levels and 11C-raclopride BP (Fig. 1, animals 1–24, R2 = 0.358). These animals received a mean injected mass of 0.2 ± 0.02 μg raclopride (2.04 ± 0.22 pmol/ml), with a range of 0.05–0.35 μg (0.61–3.90 pmol/ml). In the six animals that received the microinfusion of raclopride prior to systemic 11C-raclopride, BP decreased to 0.05 ± 0.004 (animals 24–28, Fig. 1). In these animals, the mean increase in ECF DA was 328 ± 21%. The highest mass associated with the synthesis of 11C-raclopride was 2.5 μg and corresponded to a dose of 26.6 pmol/ml (animal 42, Fig. 1).
Fig. 1.
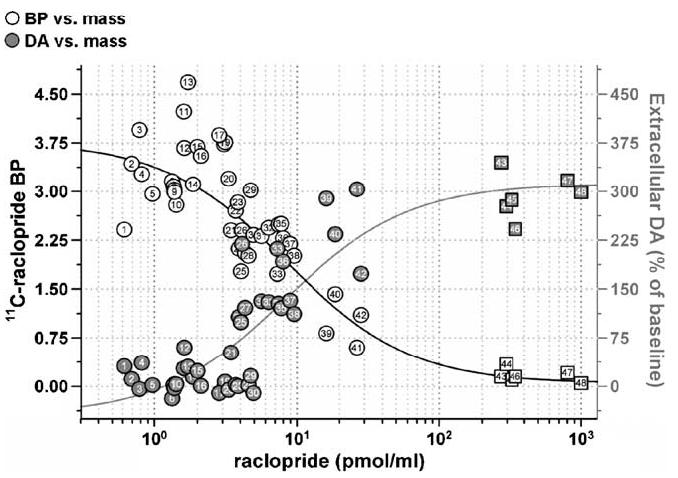
Measured striatal binding potential (BP; white symbols) and percent increase in extracellular DA (grey symbols) produced by mass of cold ligand in 11C-raclopride (presented as the log concentration of the injected dose). Mass values were normalized to pmol/ml. Within-subject measures are denoted by the number inside of each symbol. The black line represents the best fit of BP vs. raclopride mass to a single site binding model for competitive interactions identified with a radiolabeled ligand as described in the text, while the grey line represents the best fit of extracellular DA vs. raclopride mass to a sigmoidal model with a variable slope (R2= 0.8923). Microinfusion saturation studies are represented by squares where white is again representative of BP and grey depicts the change in ECF DA.
In Fig. 1, the striatal BP for 11C-raclopride as a function of the dose of nonradioactive raclopride in pmol/ml was best fit with the equation
| (3) |
From Hume et al. (1995), where B′max is proportional to the number of binding sites, C the concentration of injected raclopride, K′D the injected concentration required to occupy half these sites and NS is a measure of the nonspecific BP estimated in vivo. Like Hume et al. (1995), we assumed that C is proportional to the concentration of free ligand at the D2 receptor, such that K′D becomes a measure of the dissociation constant. Fitted parameters, ±S.E. estimated from the fit, were B′max = 31.5 ± 16.9 pmol/ml, K′D = 8.55 ′ 5.62 pmol/ml and NS = 0.06 ± 0.19. Goodness of fit for the relationship between BP and raclopride doses giving partial occupancy was assessed at R2 = 0.966.
The threshold dose of raclopride over which we observed a significant increase in extracellular DA was 3.9 pmol/ml (0.33 μg; Fig. 1). Similarly, the threshold value at which measured BP began to decline was approximately 3.07 pmol/ml (0.26 μg). We arrived at these thresholds using the statistically significant difference in ECF DA or BP to establish a dose ceiling. First, animals who received less than 3.9 pmol/ml raclopride (range: 0.61–3.89 pmol/ml) demonstrated no significant increase in extracellular DA (average increase: 11.32 ± 4.00%, n = 24). In these animals, the mean BP was 3.32 ± 0.11. The rest of the animals, when grouped, had significantly higher ECF DA levels following 11C-raclopride (average increase: 144.6 ± 28%, n = 14, P < 0.05 difference from first 24 animals; animals 25–48 in Fig. 1). In these animals, the mean BP was 1.97 ± 0.20. These data are described in more detail in Table 1, where doses are separated by predetermined increments regardless of the change in DA or BP and it becomes evident that at higher masses, there are significant increases in ECF DA. Fig. 2 illustrates the time activity of 11C-raclopride along with the DA response in two animals given low (Fig. 1a) or high (Fig. 1b) mass doses of raclo-pride. These animals are representative in that the mass dose of raclopride was derived from its synthesis and calculated per body weight immediately prior to the study.
Fig. 2.

Time activity of 11C-raclopride in the striatum, cerebellum and striatum minus cerebellum (open circles, triangles and squares, respectively) with simultaneous changes in striatal extracellular DA (filled circles). Each graph represents a different dose of raclopride derived from the synthesis of 11C-raclopride, such that the injected mass in (a) was 0.97 pmol/ml (0.068 μg) and the injected mass in (b) was 7.26 pmol/ml (0.479 μg). Intravenous injections of 11C-raclopride were made at time 0. Open squares represent cerebellar radioactivity subtracted from striatal radioactivity. The animal in (a) is number 5, and the animal in (b) is number 33.
In our saturation experiments, we tested our ability to obtain high and low SA data from a single delivery of radiotracer in the same 60 min scanning session. Due to the reciprocal anatomical connections between both striata, an additional concern was that raclopride infused through the microdialysis probe would alter contralateral 11C-raclopride binding or ECF DA. In Figs. 3 and 4, we applied this blocking strategy to an animal with a probe in each striatum and sampled DA from both striata throughout the saturation and subsequent scan. As expected from a saturation study, the infusion of increasing amounts of unlabeled raclopride reduced the amount of bound 11C-raclopride while sparing the contralateral striatum from a reduction in 11C-raclopride binding or a significant increase in ECF DA. In addition, we analyzed dialysate from the contralateral hemisphere for the presence of raclopride using the same HPLC method described above, and did not detect any raclopride in these samples. It is also evident from the inset that the probes were accurately placed in the striatum.
Fig. 4.

Volumetric image of the animal presented in Fig. 3, where cold raclo-pride was microinfused into the right striatum prior to a systemic injection of 11C-raclopride. This dual-probe approach was used to assess whether raclo-pride infusion into the right (ipsilateral) hemisphere increased DA levels in the contralateral striatum. Specific 11C-raclopride binding in the striatum is depicted in red. Blue circles represent the radioactivity distribution from a 20 min scan in which 11C-raclopride was infused simultaneously through both probes (measuring 340 μm O.D. each) immediately following the study, before the animal was removed from the gantry. Evident in white rostral to the striatum are the Hardarian glands and caudal to the striatum is the cerebellum. Volumetric image was generated with AMIDE software.
Fig. 5 illustrates the radioactivity distribution and temporal profile of 11C-raclopride (0.5 nmol/kg), as well as simultaneous measures of ECF DA (Fig. 5b). Fig. 5c shows the effect of unlabeled raclopride microinfusion (204 pmol/ml) into the right striatum 20 min prior to systemic radiotracer administration. Direct microinfusion of radiotracer through the same microdialysis probe used to deliver the unlabeled compound provided anatomic localization of the cold raclo-pride infusion (Fig. 5c). ROI analysis demonstrated decreased 11C-raclopride binding that was temporally correlated with increases in ECF DA (Fig. 5d).
3. Discussion
In the present study, we developed a novel experimental methodology in order to obtain multiple discrete measures of neurotransmitter activity and receptor density using in vivo microdialysis sampling and microPET imaging, respectively, in the same animal. We then applied this approach to independently examine the tolerance of striatal DA systems to increasing mass doses of 11C-raclopride. By combining these two measures, we independently determined the range of influence each measure exerts on the other.
Our data suggest that the threshold for decreasing BP is slightly lower than that which appears to increase extracellular DA. Hume et al. (1995), using BP as a sole outcome, calculated an ED50 for 11C-raclopride of 17.1 nmol/kg. Hume's ED50 was derived from data in which the lowest reported BP was 0.19 and the average was 0.6, while the present study produced a range of 0.05–4.68 including saturation experiments. While the lower values are similar, the mean BP varies considerably. There are a number of plausible explanations for this discrepancy, the most likely being differences in tomographs. Nevertheless, it is also possible that more subtle effects including the kinetic model, reference region used or the SA contribute to these differences.
Radiochemical synthesis is routinely designed to produce compounds with SA appropriate for humans and large primate imaging studies. Unfortunately, the smaller physical size of a rodent means that there is an intricate balance between injecting a low enough dose to prevent a pharmacological response while maintaining sufficient counting statistics. This is most evident in Table 1, where the lowest mass doses of radiotracer do not necessarily give higher measures of BP. It is likely that this is due to increased noise produced by lower counting statistics. This tradeoff has been the focus of previous investigations and discussions (Alexoff et al., 2003; Hume et al., 1998; Myers et al., 1997), and provided the impetus for the present experiments. Perhaps Hume's 1995 experiments (a clinical ECAT 953B) would have required a higher SA injection in order to obtain measures equivalent to those reported using dedicated small animal tomographs (Meikle et al., 2000). Indeed, when these pioneering studies using the ECAT 953B were followed by studies using dedicated animal tomographs, there was a progressive increase in the measured BP (from an average of 0.77 with the RATPET camera; Hume et al., 1996; to 1.9 using the same camera and different time points to 2.77 using the quad-HIDAC; Houston et al., 2004). This was attributed directly to the higher resolution of each tomograph, and the microPET R4, with an FWHM resolution about half that of the ECAT 935B, may provide a more accurate measure of striatal 11C-raclopride concentration and therefore a greater BP. These studies support the notion that physical characteristics which are unique to a dedicated small animal tomograph may contribute to the variability in findings from different laboratories (for a review of current tomographs, see Schafers, 2003).
This becomes especially interesting in light of a trend that appears to distinguish small animal imaging experiments from their human and non-human primate counterparts, which is the use of a single striatum juxtaposed with the contralateral striatum (see also a series of very thorough experiments performed by Nikolaus et al., 2001, 2003a, 2003b). Given the nature of rodent experiments, one striatum is often perturbed while the contralateral striatum is spared as a within animal control (i.e. Opacka-Juffry et al., 1998). Due to the dramatic reduction in size of the regions of interest, partial volume artifact becomes a critical factor in determining the validity of these experiments, even prior to experimental separation of each striatum. Previous data from our microPET camera provided an average BP of 1.43, using the same anesthesia and both striata (Alexoff et al., 2003). A discussion of artifact produced by partial volume effects in the Concorde tomograph can be found elsewhere (Alexoff et al., 2003). Nevertheless, although the studies by Nikolaus et al. (2003a) used a different radiotracer, it appears that contrasting ipsi- and contralateral striata is a useful and valid means of reducing some experimental confounds.
One strength of this novel method is the ability to directly and focally infuse unlabeled raclopride into one striatum, creating an opportunity to examine high and low specific activity binding following a single systemic injection of radiotracer. A number of paradigms have been proposed to obtain a high and low SA concentration of radiotracer in the same scanning session (Delforge et al., 2001; Doudet et al., 2003; Morris et al., 2004), since this is the sole assay that permits separate evaluation of receptor density and radiotracer affinity. However, there are a number of issues associated with performing these studies and obtaining reliable, reproducible data (see Holden and Doudet, 2004). Therefore, we took advantage of the microdialysis probe and developed a method that required only one injection of radiotracer to obtain multiple SA measurements.
One additional source of error might be the estimation of our low SA value following direct unilateral infusion of unlabeled raclopride. For the present experiments, this value was estimated based on a single correction factor derived from two different experimental strategies (e.g., one based on the diffusion of trace amounts of no-carrier-added 11C-raclopride similar to that in Fig. 4 and the second based on large amounts of raclopride diffused into a vial). Thus, it is possible that there are subtle differences in the amount of raclopride actually delivered from each probe, but since the different types of experiments gave a very similar range of results (0.63–0.69%), it is not likely that this contributes significantly to the variability.
These issues becomes especially relevant to small animal imaging studies, where the real-time study of in vivo kinetics is in its infancy and where the analysis of plasma and metabolite concentrations are confounded by the blood volume of these animals and the sample size necessary for reproducible metabolite analysis. Thus, small procedural biases between experimental groups could mask changes in BP as large as those being sought (in addition to mass, other sources may be cerebellar binding, the volume of radiotracer, anesthesia or animal positioning). With regard to reference tissue analyses, if the bound curve is constant over a period of time while the ratio of B/F is changing rapidly due to cerebellar washout, then small variations in the time at which the pseudoequilibrium is established can produce large variations in B/F. This artifact may be exacerbated by the presence of the microdialysis probe, since alterations in blood brain barrier (BBB) permeability have been associated with probe placement (Benveniste, 1989). Thus, while the microdialysis probe does not appear to influence receptor availability, we have yet to establish their effects on transport constants used to model microPET data.
Although microdialysis has been used extensively for many decades, its utility has been limited, in part, by the invasive nature of the approach itself. Thus, by developing simultaneous microdialysis/microPET imaging, we now have the opportunity to apply one method to objectively assess the other. That is, we can now observe both the neurochemical and metabolic consequences associated with microdialysis probe placement. Microdialysis probes do not significantly influence 11C-raclopride binding. However, our glucose metabolic data with 18FDG suggest that probe placement produces a marked hypometabolism ipsilateral to the site of implantation (Schiffer et al., 2003). Specifically, following probe placement, glucose hypometabolism extended throughout the rostral/caudal extent of the ipsilateral hemisphere and remained for several days in the presence of normal striatal 11C-raclopride binding. Further our studies demonstrated that brain delivery of 18FDG was not altered, suggesting that the effect was related to biochemical trapping as opposed to changes in regional cerebral blood flow. Thus, striatal 11C-raclopride binding and extracellular DA appear to be uncoupled to brain glucose metabolism.
The union of these complimentary techniques has given us the ability to directly correlate changes in neurotransmitter levels with radiotracer binding. This combination subsequently provides us with the power to determine B′max and K′D in vivo using a within animal, single injection paradigm. This is in marked contrast to previous studies where the in vivo determination of these parameters required multiple injections, was subject to variability across scanning procedures and often needed large groups of animals for statistical accuracy. Finally, data from the present study are particularly relevant as small animal neuroreceptor imaging stands poised to advance our understanding of the physiologic consequences associated with normal and genetically altered changes in receptor availability, neurochemical kinetics and cerebral glucose metabolism.
Acknowledgements
We greatly appreciate the tremendous efforts of the BNL Cyclotron (Mike Schueller, Paul Vaska, David Schlyer, Victor Garza, and Frank Zafonte) and assistance provided by Jim Anselmini and Lee Wolcott in the Chemistry Department. We are also grateful for funding support provided by NIH/NIDA in the form of a predoctoral fellowship to W.K.S. (F31-DA15874) and RO1 to S.L.D. (DA015041), and also the U.S. Department of Energy Office of Biological and Environmental Research (USDOE/OBER DE-AC02-98CH10886).
References
- Abi-Dargham A, Rodenhiser J, Printz D, Zea-Ponce Y, Gil R, Kegeles LS, et al. Increased baseline occupancy of D2 receptors by dopamine in schizophrenia. Proc Natl Acad Sci USA. 2000;97:8104–9. doi: 10.1073/pnas.97.14.8104. [DOI] [PMC free article] [PubMed] [Google Scholar]
- Alexoff DL, Vaska P, Marsteller D, Gerasimov T, Li J, Logan J, et al. Reproducibility of 11C-raclopride binding in the rat brain measured with the microPET R4: effects of scatter correction and tracer specific activity. J Nucl Med. 2003;44:815–22. [PubMed] [Google Scholar]
- Araujo DM, Cherry SR, Tatsukawa KJ, Toyokuni T, Kornblum HI. Deficits in striatal dopamine D(2) receptors and energy metabolism detected by in vivo microPET imaging in a rat model of Huntington's disease. Exp Neurol. 2000;166:287–97. doi: 10.1006/exnr.2000.7514. [DOI] [PubMed] [Google Scholar]
- Benveniste H. Brain microdialysis. J Neurochem. 1989;52:1667–79. doi: 10.1111/j.1471-4159.1989.tb07243.x. [DOI] [PubMed] [Google Scholar]
- Bungay PM, Morrison PF, Dedrick RL. Steady-state theory for quantitative microdialysis of solutes and water in vivo and in vitro. Life Sci. 1990;46:105–19. doi: 10.1016/0024-3205(90)90043-q. [DOI] [PubMed] [Google Scholar]
- Delforge J, Bottlaender M, Pappata S, Loc'h C, Syrota A. Absolute quantification by positron emission tomography of the endogenous ligand. J Cereb Blood Flow Metab. 2001;21:613–30. doi: 10.1097/00004647-200105000-00016. [DOI] [PubMed] [Google Scholar]
- Dewey SL, Brodie JD, Fowler JS, MacGregor RR, Schlyer DJ, King PT, et al. Positron emission tomography (PET) studies of dopaminergic/cholinergic interactions in the baboon brain. Synapse. 1990;6:321–7. doi: 10.1002/syn.890060403. [DOI] [PubMed] [Google Scholar]
- Dewey SL, Smith GS, Logan J, Brodie JD, Fowler JS, Wolf AP. Striatal binding of the PET ligand 11C-raclopride is altered by drugs that modify synaptic dopamine levels. Synapse. 1993;13:350–6. doi: 10.1002/syn.890130407. [DOI] [PubMed] [Google Scholar]
- Dewey SL, Wolf AP, Fowler JS, Brodie JD, Shiue C-Y, Alavi A, et al. The effects of central cholinergic blockage on [18F]-N-methylspiroperidol binding in the human brain using PET. XVI CINP Congr. 1988;96:162. [Google Scholar]
- Doudet DJ, Jivan S, Holden JE. In vivo measurement of receptor density and affinity: comparison of the routine sequential method with a nonsequential method in studies of dopamine D2 receptors with [11C]raclopride. J Cereb Blood Flow Metab. 2003;23:280–4. doi: 10.1097/01.WCB.0000050042.22945.E5. [DOI] [PubMed] [Google Scholar]
- Farde L, Hall H, Ehrin E, Sedvall G. Quantitative analysis of D2 dopamine receptor binding in the living human brain by PET. Science. 1986;231:258–61. doi: 10.1126/science.2867601. [DOI] [PubMed] [Google Scholar]
- Gjedde A, Wong DF. Quantification of neuroreceptors in living human brain. V. Endogenous neurotransmitter inhibition of haloperidol binding in psychosis. J Cereb Blood Flow Metab. 2001;21:982–94. doi: 10.1097/00004647-200108000-00011. [DOI] [PubMed] [Google Scholar]
- Holden JE, Doudet DJ. Positron emission tomography receptor assay with multiple ligand concentrations: an equilibrium approach. Meth Enzymol. 2004;385:169–84. doi: 10.1016/S0076-6879(04)85010-9. [DOI] [PubMed] [Google Scholar]
- Houston GC, Hume SP, Hirani E, Goggi JL, Grasby PM. Temporal char-acterisation of amphetamine-induced dopamine release assessed with [11C]raclopride in anaesthetised rodents. Synapse. 2004;51:206–12. doi: 10.1002/syn.10296. [DOI] [PubMed] [Google Scholar]
- Hume SP, Gunn RN, Jones T. Pharmacological constraints associated with positron emission tomographic scanning of small laboratory animals. Eur J Nucl Med. 1998;25:173–6. doi: 10.1007/s002590050211. [DOI] [PubMed] [Google Scholar]
- Hume SP, Lammertsma AA, Myers R, Rajeswaran S, Bloomfield PM, Ashworth S, et al. The potential of high-resolution positron emission tomography to monitor striatal dopaminergic function in rat models of disease. J Neurosci Meth. 1996;67:103–12. [PubMed] [Google Scholar]
- Hume SP, Opacka-Juffry J, Myers R, Ahier RG, Ashworth S, Brooks DJ, et al. Effect of l-dopa and 6-hydroxydopamine lesioning on [11C]raclopride binding in rat striatum, quantified using PET. Synapse. 1995;21:45–53. doi: 10.1002/syn.890210107. [DOI] [PubMed] [Google Scholar]
- Kornblum HI, Araujo DM, Annala AJ, Tatsukawa KJ, Phelps ME, Cherry SR. In vivo imaging of neuronal activation and plasticity in the rat brain by high resolution positron emission tomography (microPET) Nat Biotechnol. 2000;18:655–60. doi: 10.1038/76509. [DOI] [PubMed] [Google Scholar]
- Logan J, Fowler JS, Volkow ND, Wang GJ, Ding YS, Alexoff DL. Distribution volume ratios without blood sampling from graphical analysis of PET data. J Cereb Blood Flow Metab. 1996;16:834–40. doi: 10.1097/00004647-199609000-00008. [DOI] [PubMed] [Google Scholar]
- Logan J, Volkow ND, Fowler JS, Wang GJ, Fischman MW, Foltin RW, et al. Concentration and occupancy of dopamine transporters in cocaine abusers with [11C]cocaine and PET. Synapse. 1997;27:347–56. doi: 10.1002/(SICI)1098-2396(199712)27:4<347::AID-SYN8>3.0.CO;2-C. [DOI] [PubMed] [Google Scholar]
- MacLaren DC, Gambhir SS, Satyamurthy N, Barrio JR, Sharfstein S, Toyokuni T, et al. Repetitive, non-invasive imaging of the dopamine D2 receptor as a reporter gene in living animals. Gene Ther. 1999;6:785–91. doi: 10.1038/sj.gt.3300877. [DOI] [PubMed] [Google Scholar]
- Meikle SR, Eberl S, Fulton RR, Kassiou M, Fulham MJ. The influence of tomograph sensitivity on kinetic parameter estimation in positron emission tomography imaging studies of the rat brain. Nucl Med Biol. 2000;27:617–25. doi: 10.1016/s0969-8051(00)00105-0. [DOI] [PubMed] [Google Scholar]
- Morris ED, Chefer SI, London ED. Limitations of binding potential as a measure of receptor function: a two-point correction for the effects of mass. In: Carson RE, Daube-Witherspoon ME, Herscovitch P, editors. Quantitative Functional Brain Imaging with Positron Emission Tomography. Academic Press; 1998. pp. 407–14. [Google Scholar]
- Morris ED, Christian BT, Yoder KK, Muzic RF., Jr Estimation of local receptor density, B′max, and other parameters via multiple-injection positron emission tomography experiments. Meth Enzymol. 2004;385:184–213. doi: 10.1016/S0076-6879(04)85011-0. [DOI] [PubMed] [Google Scholar]
- Myers R, Hume SP, Ashworth S, Lammerstma AA, Bloomfield PM, Rajeswaran S, et al. Quantification of dopamine receptors and transporter in rat striatum using a small animal PET scanner. In: Myers R, Cunningham VJ, Bailey D, Jones T, editors. Quantification of Brain Function Using PET. Academic Press; San Diego, CA: 1997. pp. 12–5. [Google Scholar]
- Nikolaus S, Larisch R, Beu M, Forutan F, Vosberg H, Muller-Gartner HW. Bilateral increase in striatal dopamine D2 receptor density in the 6-hydroxydopamine-lesioned rat: a serial in vivo investigation with small animal PET. Eur J Nucl Med Mol Imaging. 2003a;30:390–5. doi: 10.1007/s00259-002-1056-2. [DOI] [PubMed] [Google Scholar]
- Nikolaus S, Larisch R, Beu M, Hamacher K, Forutan F, Vosberg H, et al. In vivo measurement of D2 receptor density and affinity for 18F-(3-N-methyl)benperidol in the rat striatum with a PET system for small laboratory animals. J Nucl Med. 2003b;44:618–24. [PubMed] [Google Scholar]
- Nikolaus S, Larisch R, Beu M, Vosberg H, Muller-Gartner HW. Imaging of striatal dopamine D(2) receptors with a PET system for small laboratory animals in comparison with storage phosphor autoradiography: a validation study with (18)F-(N-methyl)benperidol. J Nucl Med. 2001;42:1691–6. [PubMed] [Google Scholar]
- Opacka-Juffry J, Ashworth S, Ahier RG, Hume SP. Modulatory effects of l-DOPA on D2 dopamine receptors in rat striatum, measured using in vivo microdialysis and PET. J Neural Transm. 1998;105:349–64. doi: 10.1007/s007020050063. [DOI] [PubMed] [Google Scholar]
- Paxinos G, Watson C. The Rat Brain in Stereotoxic Coordinates. Academic Press; San Diego, CA: 1986. [Google Scholar]
- Qi J, Leahy RM, Cherry SR, Chatziioannou A, Farquhar TH. High-resolution 3D Bayesian image reconstruction using the microPET small-animal scanner. Phys Med Biol. 1998;43:1001–13. doi: 10.1088/0031-9155/43/4/027. [DOI] [PubMed] [Google Scholar]
- Schafers KP. Imaging small animals with positron emission tomography. Nuklearmedizin. 2003;42:86–9. [PubMed] [Google Scholar]
- Schiffer WK, Alexoff D, Dewey SL. Microdialysis probe placement produces marked ipsilateral hypometabolism in the absence of similar changes in dopamine receptor activity and extracellular dopamine concentrations; Proceedings of the XXIst International Symposium on Cerebral Blood Flow, Metabolism and Function and the VIth International Conference on Quantification of Brain Function with PET; 2003. [Google Scholar]
- Schiffer WK, Gerasimov MR, Bermel RA, Brodie JD, Dewey SL. Stereoselective inhibition of dopaminergic activity by gamma vinyl-GABA following a nicotine or cocaine challenge: a PET/microdialysis study. Life Sci. 2000;66:PL169–73. doi: 10.1016/s0024-3205(00)00432-x. [DOI] [PubMed] [Google Scholar]
- Schiffer WK, Gerasimov MR, Marsteller DA, Geiger J, Barnett C, Alexoff DL, et al. Topiramate selectively attenuates nicotine-induced increases in monoamine release. Synapse. 2001;42:196–8. doi: 10.1002/syn.10000. [DOI] [PubMed] [Google Scholar]
- Toga AW, Santori EM, Hazani R, Ambach K. A 3D digital map of rat brain. Brain Res Bull. 1995;38:77–85. doi: 10.1016/0361-9230(95)00074-o. [DOI] [PubMed] [Google Scholar]