Abstract
The coupling between Ca2+ extrusion and H+ uptake by the ubiquitous plasma membrane calcium ATPase (PMCA) has not been measured in any neurone. I have investigated this with Ca2+- and pH-sensitive microelectrodes in large voltage-clamped snail neurones, which have no Na+–Ca2+ exchangers. The recovery of [Ca2+]i and surface pH after a brief depolarization or Ca2+ injection was not slowed by hyperpolarization to −90 mV from a holding potential of −50 mV, consistent with a 1 Ca2+ : 2 H+ coupling ratio. Since Ca2+ injections proved difficult to quantify, and Ca2+ currents through channels were obscured by K+ currents, Ba2+ was used as a substitute. When the cell was bathed in Ca2+-free Ba2+ Ringer solution, the K+ currents were blocked and large inward currents were revealed on depolarization. The Ca2+-sensitive microelectrodes were sensitive to intracellular Ba2+ as well as Ca2+. With equal depolarizations Ba2+ entry appeared larger than Ca2+ entry and generated similar but slower pH changes. Ba2+ extrusion was insensitive to hyperpolarization, blocked by eosin or high pH, and about 5 times slower than Ca2+ extrusion. The ratio of the pH change caused by the extrusion of unit charge of Ba2+ influx to that caused by unit charge of H+ injection was 0.85 ± 0.08 (s.e.m., n= 8), corresponding to a Ba2+ : H+ ratio of 1 : 1.7. Both this ratio and the electroneutrality of the PMCA suggest that the Ca2+ : H+ ratio is 1 : 2, ensuring that after a Ca2+ influx [Ca2+]i recovery is not influenced by the membrane potential and maximizes the conversion of Ca2+ influxes into possible pH signals.
Of all the ions that cross the cell membrane through channels, Ca2+ enters down the largest gradient. The extracellular Ca2+ concentration is about 105 times higher than the intracellular free Ca2+ ion concentration ([Ca2+]i). Nerve cells have a variety of voltage- and ligand-gated channels that can allow Ca2+ ions to enter the cytoplasm from outside, as well as from intracellular stores. In the face of the very large gradient, the cytoplasmic level in a quiescent cell is kept below 100 nm by the powerful PMCA, and in some cells also by Na+–Ca2+ exchangers.
Niggli et al. (1982) and Smallwood et al. (1983) established with red blood cell PMCA preparations that the extrusion of one Ca2+ ion consumes one molecule of ATP, and that Ca2+ extrusion is coupled to H+ uptake. These properties of the PMCA seem to be common to all cells, although the H+ uptake is often ignored in textbooks and papers on the molecular configuration of the transporter protein (Niggli & Sigel, 2008). While Niggli et al. (1982) concluded that the Ca2+ : H+ ratio was 1 : 2, subsequent work has suggested it may be lower (see Hao et al. 1994; Guerini et al. 2005; Mata & Sepulveda, 2005; Niggli & Sigel, 2008). In their recent review Di Leva et al. (2008) state categorically that the ratio is 1 : 1. If it is 1 : 1, and no other ion is involved, the pump will be electrogenic and thus likely to be sensitive to membrane potential over some range of potentials. On the other hand a 1 Ca2+ : 2H+ coupling would be electroneutral and cause twice the pH change. There have been several reports that the PMCA causes pHi changes in a variety of nerve cells (Schwiening et al. 1993; Paalasmaa & Kaila, 1996; Trapp et al. 1996; Meyer et al. 2000).
In red blood cells Milanick (1990) has reported variable coupling ratios depending on the extracellular pH, as have DeSantiago et al. (2007) in barnacle muscle. There have also been several reports that the PMCA is electrogenic, for example in hair cells (Yamoah et al. 1998) and in red blood cell preparations (Rossi & Schatzman, 1982; Hao et al. 1994; Salvador et al. 1998).
The quantity of H+ ions pumped into neurones by the PMCA is important because CNS neurones are sensitive to small pH changes (Xiong et al. 2000; Chesler, 2003).
To better understand the local pH consequences of calcium extrusion by the PMCA it is important to know the value of the Ca2+ : H+ coupling ratio, and whether it is variable or fixed. The large neurones of the common snail Helix aspersa allow a new approach to measuring the coupling ratio. The PMCA is the only Ca2+ pump present in these cells (Kennedy & Thomas, 1995). Using microelectrodes it is possible to record both surface and intracellular pH and intracellular Ca2+ in intact cells. The PMCA can be stimulated by depolarization or direct injection of Ca2+, and the subsequent PMCA-generated pH changes compared with those generated by direct H+ injection to calculate the coupling ratio. I have found that in snail neurones the pump rate, judged by both [Ca2+]i and surface pH, is insensitive to a 40 mV increase in membrane potential. While the coupling between Ca2+ extrusion and H+ uptake is difficult to quantify, that between Ba2+ extrusion and H+ uptake agrees with a PMCA stoichiometry of 1 Ca2+ : H+.
Methods
General
All experiments were done on large (150–250 μm diameter) neurones in isolated suboesophageal ganglia of the common snail, Helix aspersa (Thomas, 2002; Postma & Thomas, 2007). Cells were voltage-clamped to −50 mV using two microelectrodes, and depolarized at intervals to generate an influx of Ca2+ or Ba2+ ions. The resulting changes in [Ca2+]i or [Ba2+]i, and surface pH or intracellular pH (pHi) were measured using Ca2+- and pH-sensitive microelectrodes (CaSMs and pHSMs, respectively). Some experiments on the sodium pump were done with Na+-sensitive microelectrodes (NaSMs).
Preparation
An aestivating snail was killed humanely by removal of the circumoesophageal ring of ganglia, which were mounted dorsal side uppermost on a PTFE and silicone rubber bath insert. The thick connective tissue covering the upper side of the suboesophageal ganglia was removed and the bath insert with ganglia was slid into the experimental chamber, which was perfused with snail Ringer solution (flow rate 1.0–1.2 ml min−1, bath volume 0.1 ml). The inner connective tissue was then torn with a fine tungsten hook to expose some of the neurones. All experiments were carried out at room temperature, 18–22°C, starting at least 1 h after the dissection.
Solutions
The normal snail Ringer solution contained (mm): 80 NaCl, 4 KCl, 7 CaCl2, 5 MgCl2, 20 Hepes, titrated with NaOH to pH 7.5. The pH 6.5 and 9.5 Ringer solutions had the same ionic composition but were buffered with 20 mm Pipes or CHES, respectively. Ca-free Ringer solutions contained the same chemicals but with 12 mm MgCl2, no added CaCl2 and 1 mm EGTA. The CO2 Ringer solution was the same as normal except that it had 20 mm NaHCO3 instead of Hepes, was bubbled with 2.5% CO2 in air and contained 0.1 mm NaH2PO4. The Ca-free (Ba2+) solution contained 7 mm BaCl2 rather than CaCl2. The 4 mm Na+ (Ba2+) solution was the same but with 76 mmN-methyl glucamine chloride replacing NaCl. The 1 mm Hepes Ringer solutions had 19 mm additional NaCl.
Microelectrodes
Conventional micropipettes were pulled from 1.2 mm filamented borosilicate glass tubing and backfilled with 2 m CsCl for passing clamp current or recording membrane potential. Microelectrodes for iontophoretic injection were filled with, respectively, 1 m HCl, 0.1 m CaCl2, 0.1 m EGTA4K and 10 mm eosin Y in 0.1 m KCl for injecting H+, Ca2+, EGTA and eosin. Tips were broken if necessary by touching a pin in the bath to give resistances between 5 and 15 MΩ.
CaSMs were made from quartz micropipettes silanized at 450°C by a method previously described (Thomas, 2001; Thomas & Postma, 2007). Before use each CaSM was tested in the experimental bath, initially superfused with normal snail Ringer solution. Once the potential had stabilized the superfusate was switched to Ca2+-free (EGTA) Ringer solution. Any CaSM showing a potential change of less than 150 mV was discarded.
pHSMs and NaSMs were made from borosilicate glass micropipettes silanized as for the CaSMs but at about 250°C. Tips were filled by sucking up neutral ligand cocktails Fluka 95297 or 71176 after backfilling with pH 6.5 Ringer solution or 0.1 m NaCl. The potentials recorded from the CaSMs during the experiments were displayed as VCa (the membrane potential being subtracted while both CaSM and membrane potential electrodes were in the cell) and were not converted either to pCa or nanomolar free [Ca2+]i. Calibration of CaSMs is difficult because, in my hands, their responses tend to change when they are withdrawn from a cell at the end of an experiment. Previous work (Kennedy & Thomas, 1996) suggests that their responses are essentially linear with pCa between 2 and 7 (10 mm to 100 nm), with a potential change of 28 mV per decade. VCa values of −100, −120 and −140 mV correspond to [Ca2+]i levels of about 1.7 μm, 300 nm and 60 nm, respectively, assuming that the properties of these Ca2+-sensitive microelectrodes have changed little from those used previously.
Potentials from the NaSMs and pHSMs were recorded as voltages referred to membrane potential as for the CaSMs, with the latter converted to pH before display. Results were discarded if on withdrawal of an electrode its potential in Ringer solution had changed by more than 7 mV.
Data collection and analysis
Potentials from the microelectrodes were led via preamplifiers in the Faraday cage to an 8-pole Bessel filter and recorded at 20 Hz on a PC via a CED micro 1401 interface and Spike 2 data collection program (Cambridge Electronic Design, UK). To measure the pHi change resulting from Ba2+ extrusion or H+ injection I assumed that linear extrapolation of a straight line drawn through the linear part of the recovering pHi record back to the end of the depolarization or injection would best allow for pHi recovery.
Figures were prepared from the CED data after loading into Microsoft Excel. Spikes in the VCa or pH records generated by electronic pickup were partially erased, and the clamp current records were in some cases restricted in range. Data are presented as means ±s.e.m. of n observations. The statistical significance of observed differences was determined by two-tailed paired Student's t test. Differences between means were considered significant when P < 0.05.
Results
The PMCA is insensitive to increases in membrane potential
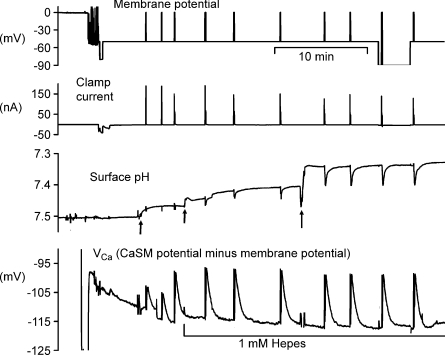
To minimize resting Ca2+ entry through voltage-gated channels, the membrane potential was clamped between depolarizations at −50 mV in all experiments, except for those concerning the potential-sensitivity of the PMCA. Figure 1 shows a representative experiment in which calcium loads were imposed by depolarizations to 0 mV for 5 s. After the first 10 min when the CaSM was sealing in, during each depolarization VCa became more positive by about 9 mV, recovering rapidly once the depolarization was ended. About 30 min after the start of the experiment the surface pH electrode registered corresponding 0.05 unit pH increases at the same time as the Ca2+ was being extruded. Before and after the penultimate depolarization the clamp potential was increased to −90 mV. Finally, the clamp potential was returned to −50 mV and one more depolarization imposed. The recovery rate for [Ca2+]i, measured as the slope of the VCa record between 10 and 20 s after the end of each depolarization was little changed by the hyperpolarization. For nine experiments like this the recovery rates were compared at −90 mV with the mean of the rates at −50 mV immediately before and after. The mean hyperpolarized recovery rate was 96 ± 2% (s.e.m., n= 9) of the control recovery rates before and after; the rates were not significantly different (P= 0.12).
Figure 1. Hyperpolarization has little effect on surface pH and [Ca2+]i recovery after brief depolarizations.
This figure shows the first 40 min of an experiment. The top record shows the membrane potential, clamped at −50 mV once the microelectrodes had been inserted. After 5 min, a series of depolarizations to 0 mV was imposed, the first two for 1 s, the rest for 5 s to allow Ca2+ entry. The second record shows the clamp current, while the third trace shows the surface pH recorded from a pHSM pressed against the cell body at the first arrow. This electrode was later moved (2nd and 3rd arrows) to increase the responses. The bottom trace shows VCa recorded with a CaSM pushed deep into the cell and manipulated to achieve a stable recording. After the first 3 depolarizations the Hepes concentration in the superfusate was decreased from 20 to 1 mm. Before and after the ninth depolarization the membrane potential was held at −90 mV for 20 and 180 s, respectively.
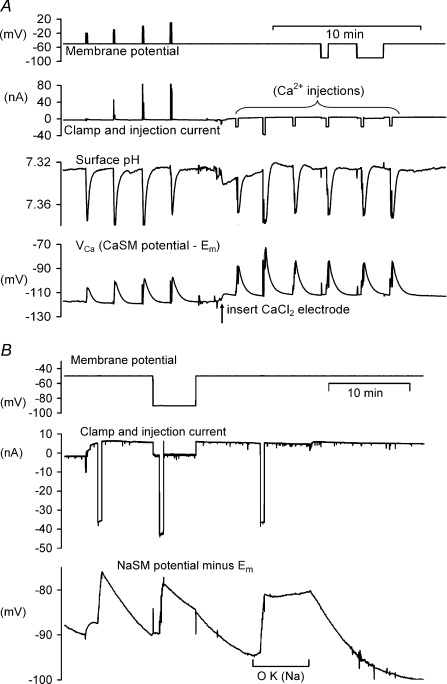
The surface pH changes seen in this recording, caused by the uptake of H+ by the PMCA, were visible only in minimally buffered Ringer solution. As well as depending on the extracellular buffering power, the extent of the surface pH changes also varied with the location of the pHSM. The lowest buffering power tested was with 1 mm Hepes. With this, and a carefully located pHSM, pH changes as large as 0.2 units. Fig. 2A shows that after Ca2+ injection, the recovery of surface pH was again little affected by hyperpolarization. The average recovery rate at −50 mV was 0.0048 pH units s−1, while at −90 mV it was 0.0045 units s−1 (n= 3). The average recovery rate at −90 mV was 97.5 ± 11% (n= 3) of that at −50 mV.
Figure 2. High membrane potential has no effect on the Ca2+ pump but inhibits the Na+ pump.
A shows the effect on both surface pH and VCa of 4 increasing depolarizations followed by 6 injections of CaCl2. The effect of a 40 mV hyperpolarization on the recovery after the 5th injection is also shown. The preparation was bathed in 1 mm Hepes throughout. B shows the effect of a similar hyperpolarization and later the removal of external K+ on the recovery of intracellular Na+ after iontophoretic injections (by 40 nA for 30 s). Intracellular Na+ was recorded with a NaSM.
It is well established that the Na+ pump is both electrogenic and slowed by increasing the membrane potential. The latter point is confirmed by Fig. 2B, which shows that the rate of recovery of [Na+]i is about 50% slower at −90 mV than at −50 mV. This suggests that if the PMCA were similarly sensitive to a 40 mV increase in membrane potential, a reduction in rate of recovery would be clearly detectable. The effect of removing extracellular Na+ and K+ was also tested, and no change in the rate of recovery of VCa or surface pH was observed (data not shown).
Acidifications generated by iontophoretic injections of Ca2+
To measure directly the PMCA coupling ratio requires comparison of the quantity of Ca2+ extruded with the quantity of H+ taken up. Rather than attempting to measure directly the Ca2+ extruded I have tried to estimate the Ca2+ injected from the charge used multiplied by the transport index. Assuming that all the Ca2+ is then extruded by the PMCA it is possible to estimate the H+ uptake by measuring the charge needed to generate the same pHi change by H+ injection. Transport indices for H+ have been measured in droplets of artificial cytoplasm by Thomas (1976) as 0.94, and for Ca2+ by Schwiening & Thomas (1996) as 0.48. In pilot experiments I found that Ca2+ injections into untreated cells caused much smaller pH changes than resulted from H+ injections with the same charge. Allowing for the different transport indices for the two ions the calculated coupling ratio was 1 Ca2+ : 1.1 H+.
This suggests either that the transport index for Ca2+ is lower than previously estimated (Schwiening & Thomas, 1996) or that much of the injected Ca2+ is sequestered in some way before it reaches the cell membrane. I have therefore tried to reduce the increase in [Ca2+] at the injection site by pre-loading the cell with EGTA. This should both buffer the [Ca2+] locally and speed up its diffusion away from the injection site.
A complication is that as EGTA binds each Ca2+ ion it releases two H+ ions. When the PMCA extrudes some of the injected Ca2+ ions more will be released by EGTA, which will bind H+ ions in exchange. In effect EGTA will convert the slow pHi change caused by the PMCA into a fast one due to the release of H+ as the Ca2+ is buffered. If the PMCA coupling ratio is 1 Ca2+ : 2 H+, there will be no further pHi change, apart from that caused by pHi regulation. An additional complication is that EGTA allows a greater Ca2+ influx through channels, by reducing Ca2+-induced inactivation (Eckert & Chad, 1984), and may also influence the activity of the PMCA by increasing diffusion rates.
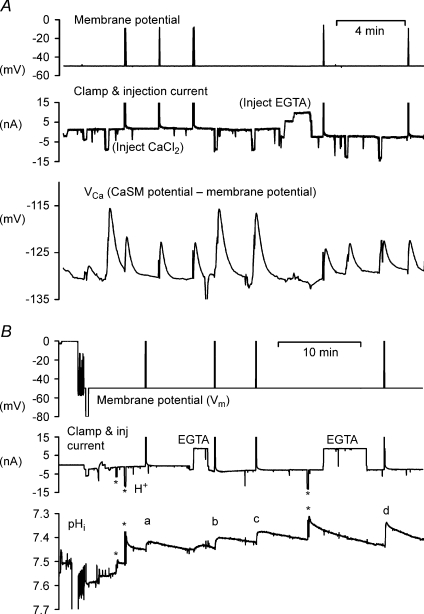
Figure 3A shows that the injection of EGTA (by 0.9 μC) reduces the size of injection-induced VCa transients by about half. Assuming buffering and diffusion are effectively instantaneous, this suggests that the Ca2+ buffering power was doubled. However, transients arising from 1 s depolarizations to −10 mV were only slightly smaller than before EGTA, showing that the Ca2+ influx had also increased, since inactivation of the Ca2+ channels is reduced by increased buffer. Recovery of VCa after EGTA addition was slower, as expected from the increased buffering power. Figure 3B shows a similar experiment in which pHi was measured and HCl injected to confirm that EGTA did not increase H+ buffering. This time the depolarizations were by 50 mV for 5 s, presumably giving a larger Ca2+ influx than in Fig. 3A. The pHi changes produced by the second and third HCl injections (each by 0.1 μC) were both 0.07, showing that the H+ buffering was unchanged. On the other hand, the depolarization-induced pHi changes were greatly increased by EGTA. The first, labelled (a) in Fig. 3B, was 0.035 units; while the last (d) was 0.08 units. The shape of the pHi transients also changed, from a rounded peak in (a) to a spike in (d), with the last closely resembling the responses to H+ injection. This was a consistent finding, as expected if the EGTA effectively and rapidly converted the in-flowing Ca2+ into H+. The fast pHi decrease in the presence of EGTA must have been due to the chemical reaction of the Ca2+ with EGTA rather than due to the PMCA.
Figure 3. The effect of the injection of EGTA on Ca2+ and pHi transients.
In both experiments a cell was penetrated with two CsCl-filled microelectrodes to record and control the membrane potential, two injection electrodes filled with HCl or CaCl2 and EGTA. A, an experiment comparing Ca2+ transients before and after EGTA injection. The Ca2+ transients were caused by either depolarization to −10 mV or Ca2+ injections. B, an experiment in which the effect of EGTA on pHi changes was recorded. The 3 HCl injections (*) are shown as downward deflections, the two EGTA as upward. The pHi changes induced by the 4 depolarizations to 0 mV are indicated by the letters a–d. In both figures the clamp and injection current recording was restricted to ±15 nA.
Similar effects of EGTA were seen on the pHi increases caused by Ca2+ injection (experiment not shown). Not only were the pHi changes caused by Ca2+ injection faster, as in Fig. 3B, but they were larger. On average the pHi change after EGTA was 1.8 ± 0.19 (n= 10) times larger than that generated by the same injection before EGTA. Assuming that the PMCA and EGTA Ca2+ : H+ ratios are the same, this suggests that iontophoretic injections of Ca2+ into EGTA-loaded cells have a larger transport index than in untreated cells. Schwiening & Thomas (1996) did find that increasing the [Ca2+] in the test droplet, which was in any case buffered with BAPTA, lowered the Ca2+ transport index. I have therefore tried to measure the Ca2+ : H+ ratio in EGTA-loaded cells to minimize the increase in [Ca2+] at the electrode tip and maximize the transport index.
The effect of EGTA loading on VCa and pHi responses to Ca2+ extrusion
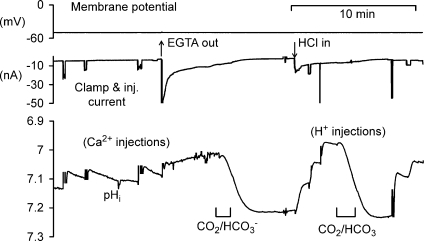
Figure 4 shows one of seven experiments in which both Ca2+ and H+ were injected into cells preloaded with about 20 μM EGTA (estimated from the injection charge and calculated cell volume, assuming a transport index of 0.01; see Thomas & Postma, 2006). The CaCl2 injection electrode had a high resistance and created electrical noise during the injections. In the part of the experiment illustrated, three Ca2+ injections were made, then the EGTA electrode was replaced with one filled with HCl, and four H+ injections were made. The rapid fall in pHi after insertion of the HCl electrode was due to leakage before the back-off current was set. The cell was exposed twice to bicarbonate-buffered saline to accelerate pHi recovery after it had fallen close to pH 7. In each of the seven similar experiments, the Ca2+ and H+ injection-induced pHi changes per unit injection charge were compared. The Ca2+ : H+ pH change ratio for equal injection charges ranged from 0.15 to 0.73, with an average of 0.39. To allow for the difference in transport numbers, this must be multiplied by 0.94/0.48, giving a value of 0.76. Since Ca2+ is divalent and H+ is monovalent, this charge ratio corresponds to a Ca2+ : H+ ratio of 1 : 1.5
Figure 4. Comparing the effect on pHi of Ca2+ and H+ injections in an EGTA-loaded cell.
The cell was injected with EGTA (by a current of 10 nA for 2 min) before the start of the record shown. After 3 injections of Ca2+, the EGTA electrode was withdrawn and normal Hepes-buffered Ringer was replaced briefly by bicarbonate-buffered Ringer to accelerate pHi recovery. Then an HCl microelectrode was inserted and used to make 4 injections of H+. Bicarbonate Ringer was again used to accelerate pHi recovery.
Acidifications generated by Ca2+ influx through channels
Injections of Ca2+ into the cell interior do not mimic the way that Ca2+ from outside the cell normally reaches the PMCA. A more physiological load is generated by depolarization, when the influx of Ca2+ occurs within submicron distances of the PMCA. I have therefore tried to measure the pump Ca2+ : H+ ratio for depolarization-induced Ca2+ loads. The major problem with this approach is the measurement of the total Ca2+ influx. The charge carried by the Ca2+ entry can be measured using the voltage clamp only if no other current changes occur. Unfortunately the Ca2+ entry itself opens K+ channels, through which a large outward current flows. Other K+ and H+ currents are activated by large depolarizations, beyond about 0 mV. Over the range from the holding potential to zero no currents other than Ca2+ and K+ seem to flow, as shown by removing external Na+ and Cl− (experiments not shown).
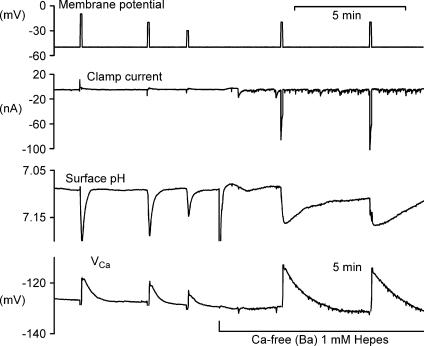
In an attempt to block the Ca2+-activated K+ channels a number of inhibitors were applied, including Cs+, tetraethylammonium, 4-aminopyridine and charybdotoxin, and the external Ca2+ was replaced with Ba2+ for a short period. This last did reduce the K+ current to the point where it was similar to the Ca2+ current. When the cells were depolarized in Ca2+-free Ba2+ Ringer solution, in which all the Ca2+ was replaced by Ba2+, the CaSM responded surprisingly well to intracellular Ba2+ (Fig. 5). The calcium ionophore ETH 129 was originally reported to be about 300 times less sensitive to Ba2+ than Ca2+ (Ammann et al. 1987). The baseline VCa in Ba2+ Ringer solution changed little, while the depolarization-induced transients appeared at least twice as large as those for the same depolarization in normal Ringer solution. (The second, fourth and fifth depolarizations in Fig. 5 were the same, to −20 mV for 5 s.) The Ba2+ transients decayed about 5 times slower than the Ca2+ transients. The fast surface pH changes in Ca2+-free Ba2+ solution were a little smaller than in normal Ringer solution, and also recovered more slowly.
Figure 5. Barium magnifies the effect of brief depolarizations on clamp current, surface pH and intracellular VCa.
For the first part of the records shown the preparation was bathed in normal snail Ringer but with only 1 mm Hepes buffer. After 3 depolarizations (to −10, −20 and −30 mV, respectively, the Ca2+ was replaced with Ba2+. Two more depolarizations were applied, both to −20 mV. Before the recordings shown, the preparation had been superfused with the Ba2+ solution for 30 min, followed by the Ca2+ saline for 10 min.
Currents carried by barium and the effects of its entry on pHi
Perhaps the most striking change resulting from the Ca2+-free Ba2+ superfusion in Fig. 5 was the appearance of large inward currents, presumably carried by Ba2+. It is indeed well established that, while Ba2+ blocks all K+ channels (Armstrong et al. 1982), it also flows through low voltage-activated Ca2+ channels more readily than Ca2+ itself, while Na+ does not enter significantly (Eckert & Lux, 1976). It can therefore be assumed that the inward current is carried only by Ba2+, and is uncontaminated by any outward K+ current.
The recovery of VCa after each depolarization in Ba2+ Ringer solution, coupled with the large surface pH changes, suggests that Ba2+ is extruded by the PMCA. In contrast, earlier workers have reported that Ba2+ is not pumped by the PMCA, and have even suggested that it inhibits it (Graf et al. 1982; Yamaguchi et al. 1989; Zhang et al. 1992; Przywara et al. 1993). The slower recovery than in normal Ringer solution implies that in snail neurones the PMCA extrudes Ba2+ more slowly than Ca2+. If both ions were present equally, Ba2+ would indeed appear inhibitory since it would reduce the rate of ATP consumption. Since the changes in surface pH reflect the rate of H+ extrusion, the extent and duration of the pH changes in Ba2+ show that the Ba2+ entry for a given depolarization was about 5 times that for Ca2+. In turn, the size of the VCa transient indicates that the CaSM is approximately equally sensitive to Ba2+ and Ca2+ in the ionic environment of the cytoplasm. (Outside the cell, in normal or Ca2+-free Ba2+ Ringer solution the CaSM is indeed much less sensitive to Ba2+ than Ca2+.)
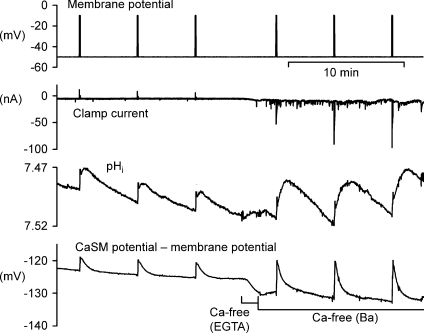
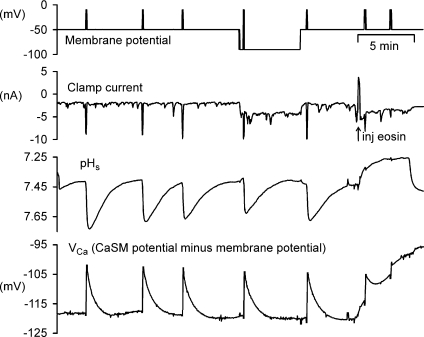
The pHi changes generated by the PMCA extruding Ba2+ are shown in Fig. 6. Both the pHi and VCa transients are much bigger in Ba2+ Ringer solution than in Ca2+ Ringer solution. Ba2+ does not inhibit pHi regulation, so the larger and slower recoveries of pHi again suggest that the PMCA extruded Ba2+, and took up H+, more slowly than Ca2+. That Ba2+ was indeed extruded and H+ taken up by the PMCA is shown by the result (representative of three) shown in Fig. 7. Throughout the part of this experiment shown, the cell was bathed in Ca2+-free Ba2+ Ringer solution and depolarized at intervals to allow Ba2+ entry. After the fifth depolarization a microelectrode was used to inject eosin, a potent blocker of the PMCA (Gatto & Milanick, 1993). VCa started to become more positive immediately, and there were only small VCa transient responses to two further depolarizations. The surface pH changes were completely blocked. The inward currents were reduced by eosin, possibly due to channel inactivation by Ca2+ traces or Ba2+ itself. This experiment also shows that Ba2+ extrusion and the corresponding H+ uptake is insensitive to a 40 mV hyperpolarization, applied before and after the 4th depolarization.
Figure 6. Barium magnifies both pHi and CaSM responses.
This shows part of an experiment to show the effect of Ba2+ on clamp current, pHi and VCa responses to brief depolarizations to −10 mV for 5 s. The responses to 3 depolarizations in normal Ringer were followed by the responses to 3 depolarizations in Ba2+ Ringer. The preparation was briefly superfused with Ca2+-free Ringer with 1 mm EGTA before the Ca2+-free (Ba2+) Ringer.
Figure 7. Both Ba2+ extrusion and surface pH increases are insensitive to hyperpolarization but are blocked by eosin.
The preparation was superfused throughout with Ca2+-free (Ba2+) Ringer, and was loaded with Ba2+ at intervals by depolarization to −10 mV for 5 s. Recovery from the 4th depolarization took place at a membrane potential of −90 mV. After the 5th Ba2+ load the cell was injected with eosin by a current of 10 nA for 10 s. Two further depolarizations were applied.
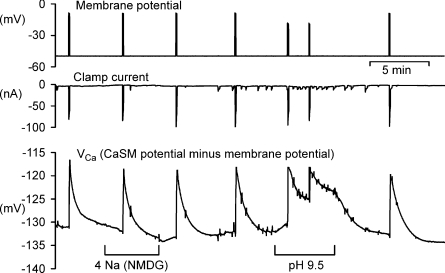
Further evidence that Ba2+ is extruded by the PMCA is shown in Fig. 8, which is representive of four similar results. Low Na2+ Ringer solution had no inhibitory effect on Ba2+ recovery after depolarizations in Ca2+-free Ba2+ Ringer solution, while pH 9.5 Ringer solution greatly slowed recovery. The inhibitory effect of high pH on Ca2+ extrusion by the PMCA in nerve cells was first shown by Benham et al. (1992).
Figure 8. Ba2+ extrusion is not inhibited by external low Na+ but is slowed by pH 9.5.
The preparation was superfused throughout with Ca2+-free (Ba2+) Ringer. Where shown this was replaced with low Na2+–Ba2+ Ringer or pH 9.5 Ba2+ Ringer. The first 4 and last depolarization was to −10 mV for 5 s, while the depolarizations in pH 9.5 were to −20 mV for 5 s.
Measuring the PMCA coupling ratio for Ba2+ : H+ exchange
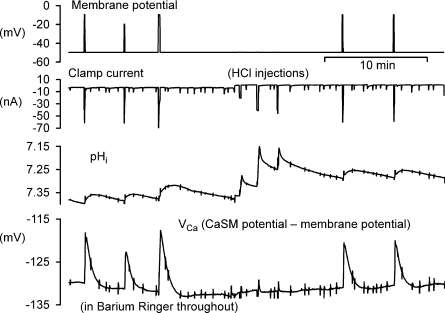
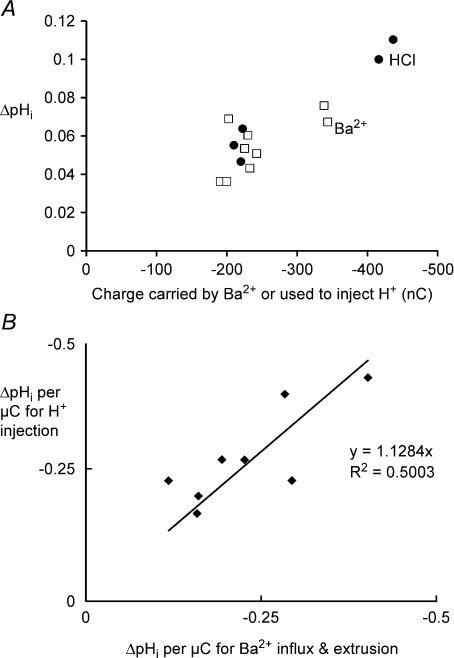
Assuming that the inward current flowing during depolarization in Ca2+-free Ba2+ Ringer solution is all carried by Ba2+ ions, the total Ba2+ entry can be estimated from the charge carried in during each depolarization. To estimate the H+ carried in by the PMCA during the subsequent extrusion of the Ba2+, the resulting pHi change must be measured. H+ can then be injected into the same cell, the pHi change measured, and the charge required to generate the Ba2+-induced pH change can be calculated. This assumes that the intracellular buffering power is essentially constant over the pHi range used, as previously concluded (Thomas, 1976). Part of an experiment in which this was done is shown in Fig. 9. In the part illustrated, three depolarizations in Ca2+-free Ba2+ Ringer solution were made. The charge carried by the entering Ba2+ was, respectively, 225, 190 and 338 nC. As the Ba2+ was extruded, the pHi changes were, respectively, 0.053, 0.036 and 0.076 units, or 0.24, 0.19 and 0.22 pH units μC−1 of Ba2+ charge. Three H+ injections were then made, using charges of 222, 436 and 220 nC, respectively, which caused pHi changes of 0.29, 0.25 and 0.21 units μC−1 of H+ charge, respectively. Finally, two more depolarizations are shown. The collected measurements for the whole experiment are shown in Fig. 10A. (The first depolarization in Ca2+-free Ba2+ Ringer solution was excluded from all such measurements as sufficient Ca2+ may still have been present to activate K+ channels.) The pHi changes per unit charge for both Ba2+ influx and extrusion and H+ injection are very similar.
Figure 9. Comparing the effects on pHi of Ba2+ extrusion with those of H+ injection.
The preparation was bathed in Ca2+-free (Ba2+) saline throughout. After depolarizations to −10, −20 and −10 mV for 5, 5 and 10 s, respectively, an HCl-filled microelectrode was inserted and used to make 3 injections of H+. Finally the depolarization to −10 mV for 5 s was repeated twice.
Figure 10. Comparing the effects of Ba2+ extrusion and HCl injection on pHi.
A, data from the experiment partially shown in Fig. 7. The pHi changes following Ba2+ extrusion for 9 depolarizations (□) and 5 HCl injections (•) are plotted against the charge carried by the Ba2+ influx or the charge used to inject the H+. B, the average pHi changes for H+ injection plotted against those caused by Ba2+ extrusion expressed per unit charge for 8 experiments. The average ratio between the pHi changes induced by Ba2+ and H+ was 0.89.
For the eight experiments of this type in which at least two depolarizations and two H+ injections in Ca2+-free Ba2+ solution were made, I plot in Fig. 10B the average pHi change per microcoulomb for H+ injection against the average for Ba2+ extrusion for each experiment. A line of best fit has a slope of 1.128, reinforcing the conclusion that the PMCA is electroneutral because it pumps 2 H+ in as it pumps each Ba2+ out.
Discussion
The results show that Ca2+ and Ba2+ extrusion by the PMCA, and the coupled surface pH changes, were both insensitive to an increase in membrane potential from −50 to −90 mV. While Ca2+ injections caused rather variable pHi changes, and Ca2+ influxes through channels were obscured by K+ currents, it was found that in Ca2+-free Ba2+ solutions the influx of Ba2+ ions was measurable as charge and was surprisingly easy to record with a CaSM. Ba2+ was clearly extruded by the PMCA, since the recovery of VCa after an influx was inhibited by eosin. The Ba2+ extrusion rate was about 5 times slower than for Ca2+. Ba2+ extrusion generated both intracellular and surface pH changes which were insensitive to membrane potential. The ratio of the pH change caused by the extrusion of unit charge of Ba2+ influx to that caused by unit charge of H+ injection was 0.85 ± 0.08 (s.e.m., n= 8), corresponding to a Ba2+ : H+ ratio of 1 : 1.7.
The finding that Ba2+ is extruded by the PMCA, even though at only 20% of the rate for Ca2+, is in contrast to earlier reports. Biochemical work on the effect of Ba2+ on the PMCA in preparations from red blood cells and mammalian synaptic membranes showed that it is activated some 50–300 times less by Ba2+ than by Ca2+ (Pfleger & Wolf, 1975; Duncan, 1976). Enzyme activation is of course not necessarily the same as actual extrusion of the ions from intact cells. More recent measurements with Fura 2 of intracellular Ba2+ in osteoblast-like cells and cells derived from pancreatic acini also suggest that Ba2+ ions are at best only poorly pumped out by the PMCA (Yamaguchi et al. 1989; Zhang et al. 1992). It may be that a significant rate of Ba2+ extrusion is seen perhaps because the work was done on intact cells, in which the PMCA is optimally active. The cytoplasmic composition in such cells may be much more favourable for Ba2+ extrusion. Alternatively the snail neurone PMCA may simply be different from that in the other preparations.
The finding that Ca2+ or Ba2+ extrusion by the PMCA is insensitive to a 40 mV hyperpolarization does not prove that the coupling ratio is 1 : 2, but does support it. Nevertheless the PMCA's evident insensitivity to hyperpolarization in these experiments suggests that quite large changes in membrane potential such as might occur as part of normal neuronal activity will not influence [Ca2+]i as long as channels do not open. That the PMCA is electroneutral has been widely reported for other cells, but almost as many reports have found that it is sensitive to membrane potential or generates a current.
Attempts to measure the coupling ratio for Ca2+ were fraught with difficulties, largely because Ca2+ is such a potent intracellular ligand. Mitochondria also take up Ca2+ ions avidly, probably in exchange for 1 H+ (Meech & Thomas, 1980), so it is likely that not all the injected Ca2+ reached the cell membrane to be extruded by the PMCA. On the other hand, all the Ca2+ entering through channels will initially be close to the PMCA, although some are likely to diffuse deep into the cell (Thomas & Postma, 2007) where again they may be taken up by mitochondria as shown in other neurones (Werth & Thayer, 1994). I have been unable to measure the Ca2+ influx as a current.
Indirect evidence for a Ca2+ : H+ ratio of 1 : 2 in these experiments comes from the shape of the pHi recovery from a Ca2+ influx in EGTA-loaded cells: it was the same as after H+ injection. This shows that essentially all the conversion of the entering Ca2+ to H+ occurred while it was rapidly reacting chemically with EGTA, while in the absence of EGTA the slower pHi change was generated only by the PMCA. Were the PMCA to take up only 1 H+ for each Ca2+, the pHi recovery would be faster than after an H+ injection.
It has long been established (Nishimura et al. 1962) that ATP hydrolysis releases H+ ions, but in my experiments on intact cells it seems likely that ATP is continuously regenerated by aerobic metabolism without changing pHi. Previous measurements in snail neurones of the effect of Na+ extrusion by the Na+ pump on pHi showed no detectable pHi change while large injections of Na+ were extruded (Thomas, 1982).
My measurements of the H+ uptake caused by Ba2+ extrusion were rather lower than expected for a 1 : 2 coupling ratio. In calculating the ratio I made assumptions. I assumed that all the inward current during a depolarization in Ca2+-free Ba2+ Ringer solution was carried by Ba2+ ions, and that there was no extra outward current. I have assumed that all the entering Ba2+ was extruded by the PMCA within a few minutes, rather than being taken up by mitochondria or the endo plasmic reticulum. Ba2+ apparently blocks Ca2+ release by the endoplasmic reticulum (Usachev et al. 1993) and in contrast to the reduction in Ca2+ transients after a caffeine application, Ba2+ transients were unaffected (author's data not shown). It is also noticeable that the inward current seen during the first depolarization after changing to Ca2+-free Ba2+ solution was smaller than during subsequent depolarizations (see Figs 5 and 6). This suggests that some K+ channels were still being activated by Ca2+ either not fully removed from outside or released from the endoplasmic reticulum. Depolarizations repeated at 5 min intervals in Ca2+-free Ba2+ solution produced essentially identical VCa transients, as seen in Fig. 7 for example. If there was any Ba2+ uptake by subcellular organelles it was non-saturable.
I have also assumed that the transport index for H+ iontophoresis was the same in an intact neurone as measured before in droplets (Thomas, 1976). The droplets contained 100 mm KCl and 20 mm NaHCO3 or NaOH with no buffer. I did not use a backing-off current, which was necessary in the present experiments to prevent H+ leakage between injections. Cytoplasmic buffering may have changed the transport index. Finally, in measuring the pHi change resulting from Ba2+ extrusion or H+ injection I assumed that linear extrapolation would be adequate. Since the effect of the H+ injection on pHi was faster than that of the PMCA, this assumption may have underestimated the effect of the PMCA. The normal pHi regulating system was somewhat inhibited by the bicarbonate-free Ringer solution, but not blocked.
Few previous measurements of the PMCA's sensitivity to membrane potential have been done with intact cells. Gassner et al. (1988) showed that Ca2+ extrusion from intact human red cells was faster at a membrane potential of +50 mV than at −50 mV. Others have found a variety of different PMCA coupling ratios and electrogenic properties with the PMCA reconstituted in membrane vesicles; recent reviews are available (Di Leva et al. 2008; Niggli & Sigel, 2008). DeSantiago et al. (2007) measured the PMCA coupling ratio in another large cell, the barnacle giant muscle fibre. They measured simultaneously the changes in radioactive Ca2+ efflux and pHi caused by stimulating or inhibiting the pump by changing extracellular pH. The range of pH used in their experiments was from 6.0 to 8.2. They found that the apparent Ca2+ : H+ coupling ratio was about 1 : 3 at pH 6.5, but only 1 : 1 at pH 8.2. The Ca2+ efflux was about 3 times faster at zero membrane potential than at −20 mV at pH 6.5. There are several possible explanations for the variable ratio.
Whatever the precise coupling ratio might be in snail neurones, it is clear from these results that the pump rate was not changed in the potential range −50 to −90 mV. This is physiologically important because it detaches the Ca2+ extrusion rate from changes in membrane potential. If the PMCA indeed pumps in 2 H+ ions for each Ca2+, it provides an important possible link between Ca2+ signalling and intracellular pH, which could provide a secondary signal itself. Since the properties of the Na+ pump and pHi regulating system are the same in mammalian as in snail neurones, there is no reason to think that the above results do not apply to all neurones.
Acknowledgments
I am grateful to the Wellcome Trust for financial support, and to Christof Schwiening and Ann Silver for helpful comments on the manuscript.
References
- Ammann D, Bührer T, Schefer U, Müller M, Simon W. Intracellular neutral carrier-based Ca2+ microelectrode with subnanomolar detection limit. Pflugers Arch. 1987;409:223–228. doi: 10.1007/BF00583469. [DOI] [PubMed] [Google Scholar]
- Armstrong CM, Swenson RP, Taylor SR. Block of squid axon K channels by internally and externally applied barium ions. J Gen Physiol. 1982;80:663–682. doi: 10.1085/jgp.80.5.663. [DOI] [PMC free article] [PubMed] [Google Scholar]
- Benham CD, Evans ML, McBain CJ. Ca2+ efflux mechanisms following depolarisation-evoked calcium transients in cultured rat sensory neurones. J Physiol. 1992;455:567–583. doi: 10.1113/jphysiol.1992.sp019316. [DOI] [PMC free article] [PubMed] [Google Scholar]
- Chesler M. Regulation and modulation of pH in the brain. Physiol Rev. 2003;83:1183–1221. doi: 10.1152/physrev.00010.2003. [DOI] [PubMed] [Google Scholar]
- DeSantiago J, Battle D, Khilnani S, Dedhia S, Kulczyk J, Duque R, Ruiz J, Pena-Rasgado C, Rasgado-Flores H. Ca2+/H+ exchange via the plasma membrane Ca2+ ATPase in skeletal muscle. Front Biosci. 2007;12:4641–4660. doi: 10.2741/2414. [DOI] [PubMed] [Google Scholar]
- Di Leva F, Domi T, Fedrizzi L, Lim D, Carafoli E. The plasma membrane Ca2+ ATPase of animal cells: structure, function and regulation. Arch Biochem Biophys. 2008;476:65–74. doi: 10.1016/j.abb.2008.02.026. [DOI] [PubMed] [Google Scholar]
- Duncan CJ. Properties of the Ca2+-ATPase activity of mammalian synaptic membrane preparations. J Neurochem. 1976;21:1277–1279. doi: 10.1111/j.1471-4159.1976.tb00344.x. [DOI] [PubMed] [Google Scholar]
- Eckert R, Chad JE. Inactivation of Ca channels. Prog Biophys Mol Bio. 1984;44:215–267. doi: 10.1016/0079-6107(84)90009-9. [DOI] [PubMed] [Google Scholar]
- Eckert R, Lux HD. A voltage-sensitive persistent calcium conductance in neuronal somata of Helix. J Physiol. 1976;254:129–151. doi: 10.1113/jphysiol.1976.sp011225. [DOI] [PMC free article] [PubMed] [Google Scholar]
- Gassner B, Luterbacher S, Schatzmann HJ, Wüthrich A. Dependence of the red blood cell calcium pump on the membrane potential. Cell Calcium. 1988;9:95–103. doi: 10.1016/0143-4160(88)90029-2. [DOI] [PubMed] [Google Scholar]
- Gatto C, Milanick MA. Inhibition of the red blood cell calcium pump by eosin and other fluorescein analogues. Am J Physiol Cell Physiol. 1993;264:C1577–C1586. doi: 10.1152/ajpcell.1993.264.6.C1577. [DOI] [PubMed] [Google Scholar]
- Graf E, Verma AK, Gorski JP, Lopaschuk G, Niggli V, Zurini M, Carafoli E, Penniston JT. Molecular properties of calcium-pumping ATPase from human erythrocytes. Biochemistry. 1982;21:4511–4516. doi: 10.1021/bi00261a049. [DOI] [PubMed] [Google Scholar]
- Guerini D, Coletto L, Carafoli E. Exporting calcium from cells. Cell Calcium. 2005;38:281–289. doi: 10.1016/j.ceca.2005.06.032. [DOI] [PubMed] [Google Scholar]
- Hao L, Rigaud JL, Inesi G. Ca2+/H+ countertransport and electrogenicity in proteoliposomes containing erythrocyte plasma membrane Ca-ATPase and exogenous lipids. J Biol Chem. 1994;269:14268–14275. [PubMed] [Google Scholar]
- Kennedy HJ, Thomas RC. Intracellular calcium and its sodium-independent regulation in voltage-clamped snail neurones. J Physiol. 1995;484:533–548. doi: 10.1113/jphysiol.1995.sp020684. [DOI] [PMC free article] [PubMed] [Google Scholar]
- Kennedy HJ, Thomas RC. Effects of injecting calcium-buffer solutions on [Ca2+]i in voltage-clamped snail neurons. Biophys J. 1996;70:2120–2130. doi: 10.1016/S0006-3495(96)79778-3. [DOI] [PMC free article] [PubMed] [Google Scholar]
- Mata AM, Sepulveda MR. Calcium pumps in the central nervous system. Brain Res Brain Res Rev. 2005;49:398–405. doi: 10.1016/j.brainresrev.2004.11.004. [DOI] [PubMed] [Google Scholar]
- Meech RW, Thomas RC. Effect of measured calcium chloride injections on the membrane potential and internal pH of snail neurones. J Physiol. 1980;298:111–129. doi: 10.1113/jphysiol.1980.sp013070. [DOI] [PMC free article] [PubMed] [Google Scholar]
- Meyer TM, Munsch T, Pape HC. Activity-related changes in intracellular pH in rat thalamic relay neurons. Neuroreport. 2000;11:33–37. doi: 10.1097/00001756-200001170-00007. [DOI] [PubMed] [Google Scholar]
- Milanick MA. Proton fluxes associated with the Ca pump in human red blood cells. Am J Physiol Cell Physiol. 1990;258:C552–C562. doi: 10.1152/ajpcell.1990.258.3.C552. [DOI] [PubMed] [Google Scholar]
- Niggli V, Sigel E. Anticipating antiport in P-type ATPases. Trends Biochem Sci. 2008;33:156–160. doi: 10.1016/j.tibs.2007.12.005. [DOI] [PubMed] [Google Scholar]
- Niggli V, Sigel E, Carafoli E. The purified Ca2+ pump of human erythrocyte membranes catalyzes an electroneutral Ca2+-H+ exchange in reconstituted liposomal systems. J Biol Chem. 1982;257:2350–2356. [PubMed] [Google Scholar]
- Nishimura M, Ito T, Chance B. Studies on bacterial photophosphorylation. Biochim Biophys Acta. 1962;59:177–182. III. A sensitive and rapid method of determination of photophosphorylation. [PubMed] [Google Scholar]
- Paalasmaa P, Kaila K. Role of voltage-gated calcium channels in the generation of activity-induced extracellular pH transients in the rat hippocampal slice. J Neurophysiol. 1996;75:2354–2360. doi: 10.1152/jn.1996.75.6.2354. [DOI] [PubMed] [Google Scholar]
- Pfleger H, Wolf H. Activation of membrane-bound high-affinity calcium ion-sensitive adenosine triphosphatase of human erythrocytes by bivalent metal ions. Biochem J. 1975;147:359–361. doi: 10.1042/bj1470359. [DOI] [PMC free article] [PubMed] [Google Scholar]
- Przywara DA, Chowdhury PS, Bhave SV, Wakade TD, Wakade AR. Barium-induced exocytosis is due to internal calcium release and block of calcium efflux. Proc Natl Acad Sci U S A. 1993;90:557–561. doi: 10.1073/pnas.90.2.557. [DOI] [PMC free article] [PubMed] [Google Scholar]
- Rossi JP, Schatzmann HJ. Is the red cell calcium pump electrogenic? J Physiol. 1982;327:1–15. doi: 10.1113/jphysiol.1982.sp014215. [DOI] [PMC free article] [PubMed] [Google Scholar]
- Salvador JM, Inesi G, Rigaud JL, Mata AM. Ca2+ transport by reconstituted synaptosomal ATPase is associated with H+ countertransport and net charge displacement. J Biol Chem. 1998;273:18230–18234. doi: 10.1074/jbc.273.29.18230. [DOI] [PubMed] [Google Scholar]
- Schwiening CJ, Kennedy HJ, Thomas RC. Calcium-hydrogen exchange by plasma-membrane Ca-ATPase of voltage-clamped snail neurones. Proc R Soc Lond B Bio Sci. 1993;253:285–289. doi: 10.1098/rspb.1993.0115. [DOI] [PubMed] [Google Scholar]
- Schwiening CJ, Thomas RC. Relationship between intracellular calcium and its muffling measured by calcium iontophoresis in snail neurones. J Physiol. 1996;491:621–654. doi: 10.1113/jphysiol.1996.sp021244. [DOI] [PMC free article] [PubMed] [Google Scholar]
- Smallwood JI, Waisman DM, Lafreniere D, Rasmussen H. Evidence that the erythrocyte calcium pump catalyzes a Ca2+: nH+ exchange. J Biol Chem. 1983;258:11092–11097. [PubMed] [Google Scholar]
- Thomas RC. The effect of carbon dioxide on the intracellular pH and buffering power of snail neurones. J Physiol. 1976;255:715–735. doi: 10.1113/jphysiol.1976.sp011305. [DOI] [PMC free article] [PubMed] [Google Scholar]
- Thomas RC. Snail neuron intracellular pH regulation. In: Nuccitelli R, Deamer D, editors. Intracellular pH: its Measurement, Regulation and Utilization in Cellular Functions. New York: Alan R. Liss; 1982. pp. 189–204. [Google Scholar]
- Thomas RC. Electrophysiological measurements using Ca2+-sensitive microelectrodes. In: Petersen O H, editor. Measuring Calcium and Calmodulin Inside and Outside Cells. Berlin: Springer; 2001. pp. 91–102. [Google Scholar]
- Thomas RC. The effects of HCl and CaCl2 injections on intracellular calcium and pH in voltage-clamped snail (Helix aspersa) neurons. J Gen Physiol. 2002;120:567–579. doi: 10.1085/jgp.20028665. [DOI] [PMC free article] [PubMed] [Google Scholar]
- Thomas RC, Postma M. Dynamic and static calcium gradients inside large snail (Helix aspersa) neurones detected with calcium-sensitive microelectrodes. Cell Calcium. 2007;41:365–378. doi: 10.1016/j.ceca.2006.07.010. [DOI] [PMC free article] [PubMed] [Google Scholar]
- Trapp S, Luckermann M, Kaila K, Ballanyi K. Acidosis of hippocampal neurones mediated by a plasmalemmal Ca2+/H+ pump. Neuroreport. 1996;7:2000–2004. doi: 10.1097/00001756-199608120-00029. [DOI] [PubMed] [Google Scholar]
- Usachev Y, Shmigol A, Pronchuk N, Kostyuk P, Verkhratsky A. Caffeine-induced calcium release from internal stores in cultured rat sensory neurons. Neuroscience. 1993;57:845–859. doi: 10.1016/0306-4522(93)90029-f. [DOI] [PubMed] [Google Scholar]
- Werth JL, Thayer SA. Mitochondria buffer physiological calcium loads in cultured rat dorsal root ganglion neurons. J Neurosci. 1994;14:348–356. doi: 10.1523/JNEUROSCI.14-01-00348.1994. [DOI] [PMC free article] [PubMed] [Google Scholar]
- Xiong ZQ, Saggau P, Stringer JL. Activity-dependent intracellular acidification correlates with the duration of seizure activity. J Neurosci. 2000;20:1290–1296. doi: 10.1523/JNEUROSCI.20-04-01290.2000. [DOI] [PMC free article] [PubMed] [Google Scholar]
- Yamaguchi DT, Green J, Kleeman GR, Muallem S. Properties of the depolarization-activated calcium and barium entry in osteoblast-like cells. J Biol Chem. 1989;264:197–204. [PubMed] [Google Scholar]
- Yamoah EN, Lumpkin EA, Dumont RA, Smith PJ, Hudspeth AJ, Gillespie PG. Plasma membrane Ca2+-ATPase extrudes Ca2+ from hair cell stereocilia. J Neurosci. 1998;18:610–624. doi: 10.1523/JNEUROSCI.18-02-00610.1998. [DOI] [PMC free article] [PubMed] [Google Scholar]
- Zhang B, Zhao H, Loessberg PA, Muallem S. Regulation of agonist-evoked [Ca2+] oscillation by intracellular Ca2+ and Ba2+ in AR42J cells. Am J Physiol Cell Physiol. 1992;262:C1125–C1133. doi: 10.1152/ajpcell.1992.262.5.C1125. [DOI] [PubMed] [Google Scholar]


