Abstract
MicroRNAs (miRNA) are short non-coding RNA molecules that regulate a variety of biological processes. The role of miRNAs in BMP2-mediated biological processes is of considerable interest. A comparative miRNA array led to the isolation of several BMP2-responsive miRNAs. Among them, miR-199a* is of particular interest, because it was reported to be specifically expressed in the skeletal system. Here we demonstrate that miR-199a* is an early responsive target of BMP2: its level was dramatically reduced at 5 h, quickly increased at 24 h and remained higher thereafter in the course of BMP2-triggered chondrogenesis of a micromass culture of pluripotent C3H10T1/2 stem cells. miR-199a* significantly inhibited early chondrogenesis, as revealed by the reduced expression of early marker genes for chondrogenesis such as cartilage oligomeric matrix protein (COMP), type II collagen, and Sox9, whereas anti-miR-199a* increased the expression of these chondrogenic marker genes. A computer-based prediction algorithm led to the identification of Smad1, a well established downstream molecule of BMP-2 signaling, as a putative target of miR-199a*. The pattern of Smad1 mRNA expression exhibited the mirror opposite of miR-199a* expression following BMP-2 induction. Furthermore, miR-199a* demonstrated remarkable inhibition of both endogenous Smad1 as well as a reporter construct bearing the 3-untranslated region of Smad1 mRNA. In addition, mutation of miR-199a* binding sites in the 3′-untranslated region of Smad1 mRNA abolished miR-199a*-mediated repression of reporter gene activity. Mechanism studies revealed that miR-199a* inhibits Smad1/Smad4-mediated transactivation of target genes, and that overexpression of Smad1 completely corrects miR-199a*-mediated repression of early chondrogenesis. Taken together, miR-199a* is the first BMP2 responsive microRNA found to adversely regulate early chondrocyte differentiation via direct targeting of the Smad1 transcription factor.
MicroRNAs (miRNAs)3 are a class of short (∼20–24 nucleotide) non-coding single-stranded RNA molecules that are important regulators of cellular gene expression. First discovered in 1993, they are thought to regulate the expression of approximately one-third of all mammalian genes (1). Functioning at the post-transcriptional level, miRNAs inhibit mRNA expression by binding to the 3′-untranslated region (3′-UTR) of mRNA before directing the repression of translation and/or mRNA degradation. They have been implicated as important regulators of a variety of biological processes including cell proliferation, differentiation, development, and tumorigenesis (2–9).
Mature single-stranded miRNA is generated from a long primary genomic transcript (pri-miRNA), which is processed in the nucleus by the enzymes Drosha and DGCR8, resulting in the excision of a stem loop structure. The resulting 60–80-nucleotide precursor miRNA (pre-miRNA) is exported into the cytoplasm by Exportin 5. In the cytoplasm, the RNase III enzyme Dicer processes the precursor miRNA to generate a short RNA duplex. One strand of the duplex is degraded, leaving a single-stranded mature miRNA molecule, which combines with members of the Argonaute protein family, to form the RNA-induced silencing complex (10).
miRNAs play an important role in differentiation and development across a whole range of organisms and tissue types. However, little is known about the precise role of miRNAs in cartilage development (10). It is known that miRNAs play a significant role in chondrogenic differentiation, because differential disruption of the Dicer gene in mice results in highly abnormal cartilage development (11). However, a specific miRNA that regulates chondrogenesis has yet to be identified. There have been various studies on the expression patterns of miRNA in various tissues. For example, miR-140 is exclusively expressed in the cartilage tissue of embryonic zebrafish (12). However, direct evidence of the role of miRNA in directing chondrogenic differentiation is lacking.
To determine the role of miRNAs in osteochondrogenic differentiation, we developed a miRNA expression profile of mesenchymal stem cells induced by bone morphogenic protein (BMP), by using a microarray approach. Using this profile, we were able to identify potential candidate miRNAs. After screening these candidates, we have obtained experimental evidence to present miR-199a* as a novel miRNA to be directly implicated in the chondrogenic differentiation process, acting as an inhibitor of early chondrogenesis. We were also able to provide evidence that miR-199a* inhibits early chondrogenesis by targeting and suppressing the expression of the Smad protein family 1 (Smad1), a key downstream mediator of BMP signaling and a major regulator of bone and cartilage development (13, 14).
EXPERIMENTAL PROCEDURES
Construction of Plasmids—The miR-199a* expression plasmid, pSuper199a* was generated using standard DNA techniques. The mouse miR-199a* precursor, including ∼160 bp of genomic flanking sequence, was cloned between the HindIII and XbaI restriction sites of the pSuper-Basic vector (Oligoengine) using the following primer pair: 5′-TTGATAAGCTTCTCCCTGGCCTGTACCATG-3′;5′-GATCTCGAGAAAAATGGTCTGGAAGTTCCCACTG-3′. The primers contained either a HindIII or XhoI (underlined) restriction site.
The anti-miR199a*-1 plasmid was generated by cloning a sequence complementary to the hairpin sequence of the precursor miR-199a* molecule. The following primer pair was used: 5′-GATCCCCTCAGGAGGCTGGGACATGTTTCAAGAGAACATGTCCCAGCCTCCTGATTTTTA-3′,5′-AGCTTAAAAATCAGGAGGCTGGGACATGTTCTCTTGAAACATGTCCCAGCCTCCTGAGGG-3′. Because there exists two distinct hairpin precursors for mir-199a*, a second plasmid (anti-miR199a*-2) was generated using the following primer pair: 5′-GATCCCCTCAGGACAATGCCGTTGTATTCAAGAGATACAACGGCATTGTCCTGATTTTTA-3′,5′-AGCTTAAAAATCAGGACAATGCCGTTGTATCTCTTGAATACAACGGCATTGTCCTGAGGG-3′. The control plasmid, pSuper-control was generated by cloning an unrelated miRNA into the pSuper plasmid using the following primer pair: 5′-GATCCCCATGGGTGTGAACCACGAGATTCAAGAGATCTCGTGGTTCACACCCATTTTTTA-3′,5′-AGCTTAAAAAATGGGTGTGAACCACGAGATCTCTTGAATCTCGTGGTTCACACCCATGGG-3′.
pGLSmad1, which contains the luciferase reporter gene adjacent to the Smad1 3′-UTR, was generated by cloning the Smad1 3′-UTR sequence into the XbaI site of the pGL3-Control vector (Promega) using the following primer pair: 5′-TAGACTCTAGAAAGACCTGTGGCTTCCGTCTC-3′,5′-CCGACTCTAGAAGTAGAGAAAAACCCTGCTAG-3′. Both primers contained a XbaI restriction site (underlined).
Site-directed Mutagenesis—pGLSmad1mut1 and pGLSmad1-mut2 were each derived from pGLSmad1 by mutating one of the two miR-199a* seed sites within the Smad1 3′-UTR sequence (see Fig. 5A for detail). The mutations were carried out using the QuikChange XL Site-directed Mutagenesis kit (Stratagene). Each mutation consisted of replacing four consecutive base pairs at the 3′ region of the seed site. The following primer pair was used for pGLSmad1mut1: 5′-ACGATAATACTTGACCTCTGTGACCATAATTTGGATTGAGAAACTGACAAGCCTTG-3′,5′-CAAGGCTTGTCAGTTTCTCAATCCAAATTATGGTCACAGAGGTCAAGTATTATCGT-3′; and for pGLSmad1mut2: 5′-TTCTGAAACTGTATGCTGGCTGTATATAAGTCAGAATGATGGCAGGCATATGC-3′,5′-GCATATGCCTGCCATCATTCTGACTTATATACAGCCAGCATACAGTTTCAGAA-3′. pGLSmad1mut1,2 was derived from pGLSmad1 by mutating both miR-199a* seed sites, using the primers described above.
FIGURE 5.
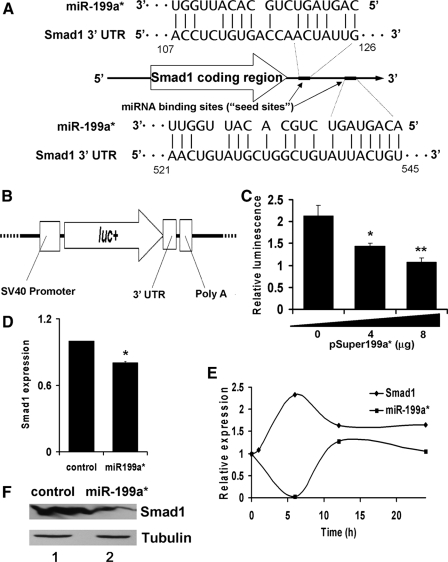
Repression of Smad1 by ectopic expression of miR-199a* in C3H10T1/2 cells. Panel A, schematic of miR-199a* inhibition of Smad1 expression. Inhibition of Smad1 occurs via a specific miRNA binding site (seed site) within the 3′-UTR of Smad1 mRNA. The 5′ end of mir-199a* contains a sequence complementary to the seed site. The seed sites are shown in relation to the coding region of Smad1 mRNA. Panel B, schematic of pGL3Smad1 reporter construct. The pGL3Smad1 vector was constructed by inserting a sequence that corresponds to the 3′-UTR of Smad1 mRNA, immediately downstream of the luc reporter of the pGL3-Control vector. Panel C, miR-199a* represses pGL3Smad1 reporter gene activity in a dose-dependent manner. C3H10T1/2 cells were transfected with 1.5 μg of pGL3Smad1 together with 1.5 μg of pSVGal internal control plasmid and varying amounts of pSuper199a* expression plasmid, as indicated. Data are the means of three independent cell culture experiments, with S.D. indicated. *, p < 0.05; **, p < 0.01 when compared with control. Panel D, repression of Smad1 mRNA level by ectopic miR-199a*, assayed by real-time PCR. Cells transfected with the empty pSuper vector alone (control) or with the miR-199a* overexpression plasmid were treated by BMP-2, as indicated. Smad1 mRNA expression was measured by quantitative real-time PCR; the expression level of BMP-2 untreated cells is set to 1. Data are the means of three independent cell culture experiments with S.D. indicated. *, p < 0.05. Panel E, early down-regulation of miR-199a* after BMP-2 exposure correlates with up-regulation of Smad1. C3H10T1/2 cells exposed to BMP-2 were harvested and lysed at various time points, as indicated. Smad1 mRNA and miR-199a* expression were measured via quantitative real-time PCR; the expression level of non-induced cells is set to 1. Panel F, repression of Smad1 protein level by ectopic miR-199a*, assayed by immunoblotting. Following transfection with pSuper199a* or a control plasmid, C3H10T1/2 cells were harvested after 24 h of BMP-2 exposure. Total cell lysates were subjected to immunoblotting analysis with anti-Smad1 or anti-tubulin antibody.
Total RNA and MicroRNA Isolation for Microarray—Total cellular RNA was purified for microarray analysis by a modified TRIzol reagent (Invitrogen) involving an enhanced precipitation by adding 1 volume of isopropyl alcohol to the extracted aqueous phase, precipitating at -20 °C overnight, and centrifuging the RNA for 30 min at 14,000 × g at 4 °C. For microRNA array profiling, the microRNA population was prepared by the TRIzol method as described above, followed by Flash-PAGE (Ambion) fractionation of total RNA according to the manufacturer's recommendations. The concentration, purity, and integrity of total RNA and fractionated small RNA population were determined by NanoDrop ND-1000 and Agilent 2100 Bioanalyzer.
Microarray MicroRNA and mRNA Profiling and Data Analysis—Ambion mirVana TM labeling and the oligonucleotide array system (15) were used to monitor expression profiles of ∼380 microRNAs in C2C12 cells, performed in duplicates. GeneSpring GX (Agilent Technologies, Palo Alto, CA) and the TM4 Microarray Software Suite (16) were used to identify differentially expressed microRNAs in dye-swap experiments. The miRBase Targets (17), TargetScan (18), PicTar (19), and miRNAviewer (20) miRNA target prediction algorithms were used to identify microRNA targets.
Real-Time PCR—Total RNA (including total microRNA) was harvested from C3H10T1/2 cells using the mirVana miRNA isolation kit (Ambion). The RNA was reverse transcribed using the TaqMan miRNA reverse transcription kit (Applied Biosystems) and miRNA-specific primers (Applied Biosystems). MicroRNA expression levels were then analyzed using the appropriate TaqMan miRNA assay (Applied Biosystems) as per the manufacturer's instructions. Quantitation of the ubiquitously expressed miRNA, snoRNA202, was performed as an endogenous control. To determine the expression levels of Col2a1 and cartilage oligomeric matrix protein (COMP), total RNA was analyzed using the ImProm-II Reverse Transcription System (Promega) followed by real-time PCR with SYBR Green chemistry. A reaction mixture containing the SYBR Green Master Mix (Applied Biosystems) and the appropriate primers was added to a 96-well plate, together with 1 μl of cDNA template, for a final reaction volume of 20 μl/well, and run for an initial step at 95 °C for 10 min, followed by 40 cycles of amplification at 95 °C for 15 s and 60 °C for 60 s. Absolute quantization of glyceraldehyde-3-phosphate dehydrogenase was performed as an endogenous control. All real-time PCR were carried out in an ABI prism 7500 PCR amplification system (PE Biosystems, Foster City, CA). Primer sequences are as follows: glyceraldehyde-3-phosphate dehydrogenase forward, 5′-ATGACATCAAGAAGGTGGTG-3′, glyceraldehyde-3-phosphate dehydrogenase reverse, 5′-CATACCAGGAAATGAGCTTG-3′; Col2a1 forward, 5′-TGGTGGAGCAGCAAGAGCAA-3′, Col2a1 reverse, 5′-CAGTGGACAGTAGACGGAGGAAA-3′; Smad1 forward, 5′-GCTTCGTGAAGGGTTGGGG-3′, Smad1 reverse, 5′-CGGATGAAATAGGATTGTGGGG-3′.
Reporter Gene Assay—Inhibition of Smad1 reporter constructs was assayed by co-transfection of C3H10T1/2 cells with pGL3Smad1 (1.5 μg), various amounts of pSupermir-199a*, and a pSVGal control plasmid (1.5 μg). Additionally, pSuper vector was used to bring the total amount of transfected DNA to 11 μg. Co-transfections were carried out using Lipofectamine 2000 (Invitrogen) in 6-well plates as per the manufacturer's instructions. Cultures were harvested after 48 h of incubation. Luciferase and β-galactosidase activities were assayed using the Tropix Galacto-Star Reporter Gene Assay system (Applied Biosystems) and Luciferase Assay Regent (Promega). Measurements were carried out in a Mini-Lum Luminometer (Bioscan). The assays were performed in triplicate.
Immunoblotting Analysis—To examine the expression of Sox9, Col2A1, and COMP in the course of chondrogenesis, total cell extracts prepared from micromass cultures of C3H10T1/2 cells were mixed with 5 × sample buffer (312.5 mm Tris-HCl (pH 6.8), 5% β-mercaptoethanol, 10% SDS, 0.5% bromphenol blue, 50% glycerol). Proteins were resolved on a 10% SDS-polyacrylamide gel and electroblotted onto a nitrocellulose membrane. After blocking in 10% nonfat dry milk in Tris-buffered saline, Tween 20 (10 mm Tris-HCl (pH 8.0), 150 mm NaCl, 0.5% Tween 20), blots were incubated with anti-Sox9, anti-COMP, or anti-Col 2 antibody (diluted 1:1000) for 1 h. Anti-tubulin antibody (diluted 1:2000) was used as a loading control. After washing, the respective secondary antibody (horseradish peroxidase-conjugated anti-rabbit immunoglobulin; 1:1000 dilution) was added, and bound antibody was visualized using an enhanced chemiluminescence system (Amersham Biosciences).
Chondrogenic Differentiation Assay—Cultures of C3H10T1/2 murine mesenchymal stem cells were maintained in standard 10-cm tissue culture dishes in Dulbecco's modified Eagle's medium supplemented with 10% fetal bovine serum, with a change of medium every 2–3 days. Cultures were stored in a humidified incubator at 37 °C and 5% CO2.
A modified micromass culture technique was carried out, as previously described (21–23). Transfections were carried out using Lipofectamine 2000 (Invitrogen) in 6-well plates as per the manufacturer's instructions. For each sample, 4 μg of plasmid and 10 μl of Lipofectamine 2000 was diluted with serum-free Dulbecco's modified Eagle's medium to reach a total volume of 500 μl. After incubation for 20 min at room temperature, the mixture was introduced into the well containing cells growing at ∼90% confluence in 2 ml of Dulbecco's modified Eagle's medium with 10% fetal bovine serum. Following transfection with the specified plasmids, the cells were incubated for 48 h. The cells were then trypsinized and brought into suspension at a density of 107 cells/ml. 10 μl of the suspension was placed into the center of each well on a standard 12-well polystyrene tissue culture plate. After incubation for 2 h at 37 °C and 5% CO2, wells were flooded with 1 ml of culture medium (supplemented with fetal bovine serum) containing 100 ng/ml recombinant BMP-2. Replacement with fresh medium containing BMP-2 was carried out every 2–3 days.
Mouse prechondrogenic ATDC5 cells were maintained in a medium consisting of a 1:1 mixture of Dulbecco's modified Eagle's medium and Ham's F-12 medium (Flow Laboratories, Irvine, UK) containing 5% fetal bovine serum (Invitrogen), 10 μg/ml human transferrin (Roche Applied Science), and 30 nm sodium selenite (Sigma) at 37 °C in a humidified atmosphere of 5% CO2 in air. ATDC5 cells transfected with either pSuper control encoding a nonrelated miRNA, pSuper-mir199a* or pSuper-anti-mir199a* plasmid, were seeded at a density of 3 × 10⁵ cells per well in 6-well cell-culture plates (Corning, Slangerup, Denmark). To induce chondrogenesis, cells were cultured in the medium supplemented with 10 μg/ml human insulin (Sigma) (24–26). The medium was replaced every 2–3 days. Within 3 days, both mRNA and protein of cells were collected for real-time PCR and Western blot assay.
RESULTS
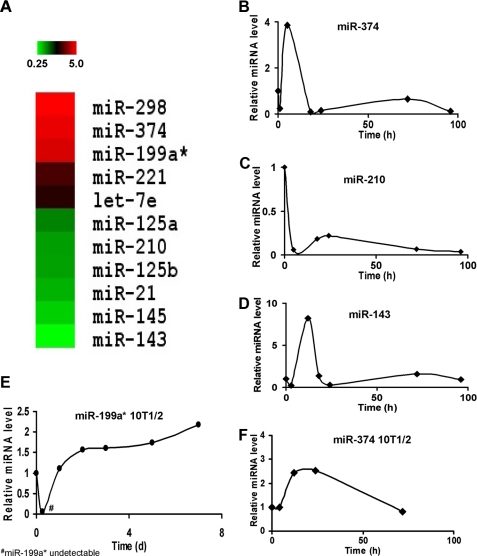
miRNAs Are Differentially Expressed following BMP-2 Treatment of C2C12 Cells—To identify candidate miRNAs that regulate bone and/or cartilage differentiation and development, the expression profile of numerous miRNAs was determined via commercial microarray. C2C12 cells were exposed to BMP-2 (200 ng/ml) and harvested within 24 h; total RNA was extracted and used for array analysis. miRNA expression patterns following BMP-2 treatment were then compared with reference levels obtained from cells prior to BMP-2 induction. Microarray analysis revealed multiple miRNAs that were either positively or negatively regulated by BMP-2 induction (Fig. 1A). Based on these results, the expression levels of selected miRNAs were assayed using real-time PCR in C2C12 cells at various time points following BMP-2 induction. The expression levels of miR-374, miR-210, and miR-143 were largely consistent with the microarray data (Fig. 1, B–D). Interestingly, although the microarray showed the expression of miR-374 and miR-143 to be increased and decreased, respectively, the TaqMan real-time PCR assay revealed that both miRNAs had similar expression profiles, characterized by a significant increase in expression during the first 12 h of BMP-2 induction, followed by a rapid decline to extremely low expression levels (Fig. 1, B and D).
FIGURE 1.
MicroRNA expression following BMP-2 induction. Panel A, expression profile of various micro-RNAs in response to BMP-2 induction. Total microRNA was isolated from BMP2-treated C2C12 cells and hybridized to a microarray chip. The brightest green shading represents a 75% down-regulation in microRNA expression, whereas the brightest red shading represents a 400% up-regulation. The microRNAs are grouped according to expression pattern. Panels B–D, real-time PCR measurement of miRNA expression following induction with BMP-2 in C2C12 cells. Relative miRNA expression levels were measured at various time points, as indicated, following BMP-2 treatment of C2C12 cells. Panels E and F, expression profile of miR-199a* and miR-374 following induction with BMP-2 in C3H10T1/2 cells. Relative miRNA expression levels were measured at various time points, as indicated, following BMP-2 treatment of C3H10T1/2 cells.
The microarray data showed that miR-199a* was significantly up-regulated at 24 h following BMP-2 induction, with expression levels that were ∼4-fold greater than those in untreated cells. miR-199a* is highly expressed in the embryonic skeletal system of a wide range of organisms (27–29). Therefore, using real-time PCR TaqMan® miRNA assays, we sought to verify the expression pattern of miR-199a* following BMP-2 treatment in C3H10T1/2 cells, a well established in vitro cell model for studying chondrogenesis (22, 30). At 6 h following BMP-2 treatment, the expression of miR-199a* was reduced below the limit of detection of the assay (Fig. 1E); however, at 24 h, miR-199a* levels had risen dramatically and continued to rise gradually over the following 6 days. The highest level of expression occurred on the 7th day of BMP-2 induction and was ∼2-fold greater than that for untreated C3H10T1/2 cells. In addition, to verify our results in other miRNAs, we also analyzed the expression pattern of miR-374 in BMP-2-treated C3H10T1/2 cells. Such analysis showed miR-374 levels to be significantly increased following BMP-2 treatment, as expected (Fig. 1F).
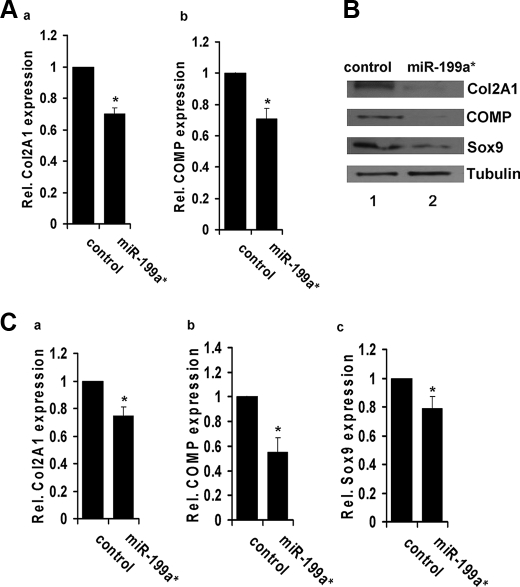
miR-199a* Overexpression Inhibits Chondrogenic Differentiation—To determine whether miR-199a* mediates chondrogenic differentiation, we constructed the miRNA expression plasmid, pSuper199a*, by cloning the miR-199a* precursor into the pSuper vector, followed by transfection into C3H10T1/2 cells, using techniques described previously (31). Real-time PCR analysis of C3H10T1/2 cells transfected with pSuper199a* revealed a significant decrease in the mRNA expression levels of chondrogenesis markers Col2A1 and COMP, when compared with control cells 24 h after induction with BMP-2 (100 ng/ml) (Fig. 2A). This suggests that miR-199a* functions as an inhibitor of the early stages of chondrogenic differentiation.
FIGURE 2.
Overexpression of miR-199a* inhibits chondrogenesis of C3H10T1/2 and ATDC5 cells. Panel A, miR-199a* inhibition of chondrogenic differentiation of a micromass culture of C3H10T1/2 cells. C3H10T1/2 cells were transfected with an empty pSuper vector (control) or pSuper199a*. After 24 h of treatment with BMP-2 (100 ng/ml), micromass cultures were lysed and the expression of chondrogenic differentiation markers, Col2a1 (a) and COMP (b), was measured via quantitative real-time PCR. Data in A and C are the means of three independent cell culture experiments with S.D. indicated. *, p < 0.05. Panel B, overexpression of miR-199a* inhibits chondrogenesis of ATDC5 cells, assayed by immunoblotting. Following transfection with pSuper199a* or control plasmid, ATDC5 cells were maintained in 10 μg/ml human insulin for 3 days, after which cultures were lysed and whole cell lysates were analyzed for expression of Col 2A1, COMP, and Sox9. Tubulin is used as an internal control. Panel C, overexpression of miR-199a* inhibits chondrogenesis of ATDC5 cells, assayed by real-time PCR. ATDC5 cells were processed as described in panel B and mRNA levels of Col2A1 (a), COMP (b), and Sox9 (c) were determined by real-time PCR.
Because the cell models used thus far have relied on BMP-2 to induce chondrogenesis, we next sought to determine whether the effects of miR-199a* were specific to the BMP-2 chondrogenic growth factor. To do so, we repeated the experiment using murine prechondrogenic ATDC5 cells that undergo chondrogenic differentiation in the presence of human insulin (10 mg/ml). We compared cells transfected with pSuper199a* or a control plasmid encoding an unrelated miRNA, pSuper-control. Both immunoblotting analysis (Fig. 2B) and real-time PCR (Fig. 2C) revealed a significant decrease in early chondrogenesis markers Col2A1, COMP, and Sox9 in this ATDC5 cell model. This suggests that miR-199a* functions as a mediator of early chondrogenesis, and not as a general response to BMP-2 signaling.
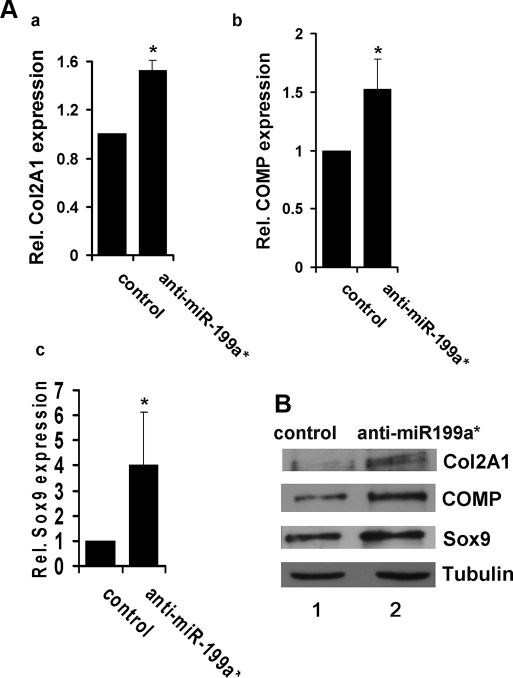
Inhibition of miR-199a* Enhances Chondrogenic Differentiation—To further define the role of miR-199a* in chondrogenic differentiation, we constructed a miRNA expression plasmid, anti-miR199a*-1, that generated a short RNA sequence complementary to the hairpin sequence of the miR-199a* precursor molecule. By binding to the miR-199a* precursor, the products of this plasmid would inhibit miR-199a* synthesis. Because two distinct precursors have been identified for miR-199a*, a second plasmid, anti-miR-199a*-2 was also generated. ATDC5 cells were transfected with either an equimolar mixture of anti-miR199a*-1 and anti-miR199a*-2 or pSuper-Control and chondrogenesis was induced. Both real-time PCR and Western blotting assays revealed a significant increase in chondrogenesis markers Col2A1, COMP, and Sox9, when compared with the control (Fig. 3, A and B).
FIGURE 3.
Suppression of miR-199a* enhances chondrogenesis of ATDC5 cells. Panel A, real-time PCR assay. Following transfection with anti-miR199a* plasmids or control plasmid, ATDC5 cells were maintained in 10 μg/ml human insulin for 3 days, after which cultures were lysed for real-time PCR analysis of chondrogenesis markers Col2A1 (a), COMP (b), and Sox9 (c). Data are the means of three independent experiments with S.D. indicated. *, p < 0.05. Panel B, immunoblotting analysis of chondrogenesis markers. ATDC5 cells were processed as described in panel A and protein levels of Col 2A1, COMP, Sox9, and Tubulin (serving as a loading control) were determined by Western blotting.
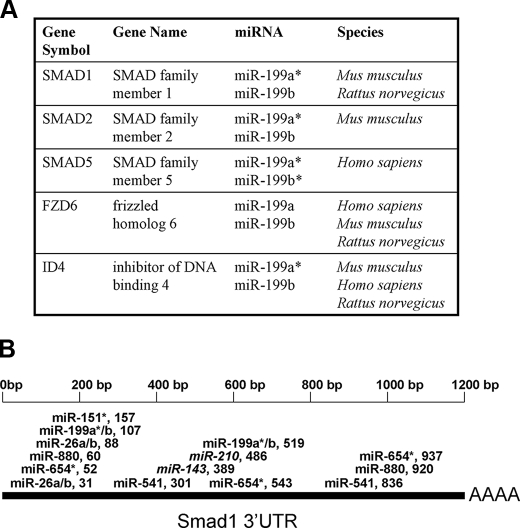
Smad Family 1 (Smad1) Is a Target of miR-199a*—The miRNA target prediction program miRanda was utilized to generate a list of predicted mRNA targets for miR-199a*. This list was then used to identify putative miRNA target genes that are coincidentally involved in BMP-2 signaling and chondrogenic differentiation. Members of the miR-199 family were predicted to target members of the Smad gene family. Smad1 and Smad5, which are known downstream mediators of BMP signaling in osteochondroprogenitor cells (3), were both identified as putative targets of miR-199a* (Fig. 4A). Smad1 is an established mediator of both osteoblastic and chondrogenic differentiation of progenitor cells in response to stimulation by BMPs (13, 14, 32). The putative repression of Smad1 mRNA expression by miR-199a* would hinder BMP-2 signaling, and thus serve to explain how overexpression of miR-199a* may inhibit BMP-2-induced chondrogenic differentiation.
FIGURE 4.
Predicted targets of differentially regulated miRNA during differentiation. Panel A, putative targets of the miR-199 family. Panel B, diagram of miRNA targeting Smad1 mRNA. Selected miRNA are featured according to their putative binding site in the Smad1 3′-UTR sequence. miRNAs that were up-regulated following C2C12 induction by BMP-2 are bolded. Down-regulated miRNAs are italicized.
miRNA inhibits mRNA expression by binding to a specific sequence with the 3′-UTR, also known as a “seed site.” Perfect complementarity of a particular miRNA to the seed site is thought to result in mRNA cleavage, whereas imperfect complementarity generally results in translational repression, without degrading the mRNA itself (33–35). miR-199a* binds to a seed site within the Smad1 3′-UTR with near, but not perfect complementarity (Fig. 5A), suggesting that it may not affect the level of Smad1 mRNA. However, imperfect complementarity can also result in mRNA cleavage, in certain cases (36–38). In addition, the Smad1 3′-UTR contains two putative miR-199a* seed sites, which would suggest a stronger association than if only one site were present (Fig. 4B). To determine whether miR-199a* cleaves Smad1 mRNA, the expression of Smad1 mRNA was measured via real-time PCR immediately following BMP-2 induction of C3H10T1/2 cells. The pattern of Smad1 mRNA expression was found to be the mirror opposite of miR-199a* expression following BMP-2 induction (Fig. 5E), suggesting that the early down-regulation of miR-199a* expression, immediately after BMP-2 treatment, may serve to release its suppression of Smad1 mRNA levels.
To test this hypothesis, the expression of Smad1 mRNA in cells transfected with pSuper199a* were compared with expression in control cells via real-time PCR. Smad1 mRNA expression was significantly lower in miR-199a* overexpressing cells (Fig. 5D). This provides evidence that miR-199a* may mediate Smad1 gene expression by targeting and degrading Smad1 mRNA. This was also confirmed via immunoblotting analysis, overexpression of miR-199a* resulted in decreased Smad1 protein levels (Fig. 5F). To further determine whether miR-199a* targets Smad1, we constructed the vector pGLSmad1 by cloning the Smad1 3′-UTR adjacent to a luciferase reporter gene (Fig. 5B). Co-transfection of the miR-199a* expression plasmid, pSuper199a* into C3H10T1/2 cells resulted in a significant suppression of luciferase gene expression, when compared with co-transfection with a control vector (Fig. 5C). This occurred in a dose-dependent manner, and indicates that miR-199a* acts as an inhibitor of Smad1 gene expression.
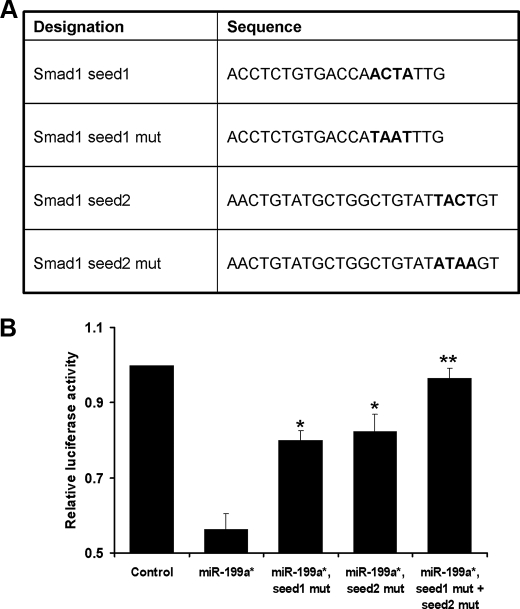
MicroRNAs are able to repress gene expression by binding to seed site sequences located within the 3′-UTR of mRNA. Thus, we hypothesized that the inhibition of luciferase reporter gene expression by miR-199a* should occur via binding of miR-199a* to seed sites within the Smad1 3′-UTR sequence of pGL3Smad1. To test this hypothesis, we mutated the two seed sites within pGL3Smad1 to generate 3 other reporter constructs (Fig. 6A). pGL3Smad1mut1 contained a mutation to one seed site, whereas pGL3Smad1mut2 contained a mutation to the other site. pGL3Smad1mut1, 2 contained mutations to both seed sites. As expected, miR-199a* significantly inhibited activity of the wild-type reporter gene pGL3Smad1, whereas mutation of either seed site largely abolished miR-199a*-mediated repression of reporter gene activity. Furthermore, mutation of both seed sites completely abolished this repression by miR-199a* (Fig. 6B). This provides strong evidence that miR-199a* acts as an inhibitor of Smad1 gene expression by direct binding to two distinct seed sites within the 3′-UTR sequence.
FIGURE 6.
Alteration of one or two seed sites in the 3-UTR of Smad1 mRNA results in a strong reduction or a complete loss of the miR-199a*-mediated repression of Smad1 expression. Panel A, diagrams show the alterations in the first and/or the second of the seed sites in the pGL3Smad1 reporter gene. Panel B, transient transfection assays in C3H10T1/2 cells. The reporter gene specified and the pSVgal internal control plasmid were transfected into C3H10T1/2 cells together with 3 μg of pSuper (CTR) or the pSuper199a* expression plasmid. At 48 h after transfection, the cultures were harvested and the luciferase and β-galactosidase activities were determined. Data are the means of three independent cell culture experiments, with S.D. indicated. *, p < 0.05; **, p < 0.001.
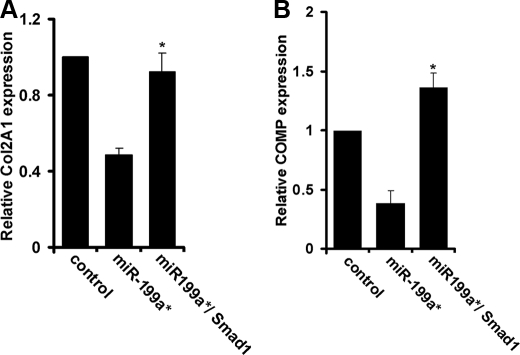
To further confirm the role of Smad1 in the miR-199a*-mediated inhibition of chondrogenic differentiation, we co-transfected C3H10T1/2 cells with pSuper199a* along with a Smad1 expression plasmid. When compared with cells transfected with pSuper199a* alone, these co-transfected cells expressed chondrogenesis markers Col2A1 and COMP at much higher levels (Fig. 7, A and B). Thus, the overexpression of Smad1 was able to reverse the inhibition of chondrogenic differentiation by miR-199a*, thus providing further evidence that miR-199a* mediates the inhibition of chondrogenesis via targeting to Smad1.
FIGURE 7.
Smad1 overcomes miR-199*-mediated inhibition of chondrocyte differentiation. C3H10T1/2 cells were either transfected with pSuper199a* or co-transfected with pSuper 199a* together with a Smad1 expression plasmid, as indicated. The micromass cultures were stimulated by BMP-2, and the expression of chondrogenic differentiation markers Col2A1 (Panel A) and COMP (Panel B) were assayed by real-time PCR. Means from three independent experiments are shown (error bars indicate S.D.). *, p < 0.05 when compared with cells transfected with pSuper199a* only.
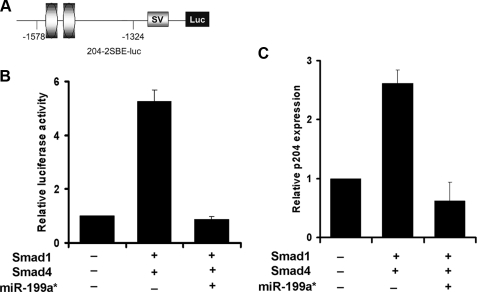
miR-199a* Inhibits Smad-dependent Transactivation of Its Target Gene—We next sought to determine whether miR-199a* inhibits Smad1-dependent transactivation of its target genes. p204, a member of the interferon-inducible p200 protein family, was previously found to be a direct target molecule of Smad transcription factors, including Smad1 and Smad4 (39). p204 plays an important role in both osteogenesis and chondrogenesis via its association with Cbfa1, pRb, Ids (inhibitor of DNA binding), and parathyroid hormone-related protein signaling (40–42). We thus examined whether miR-199a* inhibited Smad-dependent activation of the p204-specific reporter gene 204–2SBE-luc. Smad-binding elements (SBEs) containing segments from the 5′-flanking region of Ifi204 were linked to the upstream end of a region encoding luciferase in the PGL3 vector (Fig. 8A). In accordance with previous reports (39), co-transfection of C3H10T1/2 cells with 204–2SBE-luc and Smad1 and Smad4 mammalian expression plasmids, displayed markedly increased reporter gene activity when compared with cells transfected with 204–2SBE-luc alone. In contrast, the addition of pSuper199a* to the transfection mixture totally abolished Smad-dependent transactivation of the p204 reporter gene (Fig. 8B). These results suggest that miR-199a* efficiently represses Smad1-dependent transactivation via targeting to Smad1.
FIGURE 8.
miR-199a* inhibits Smad-dependent transactivation of p204 gene expression. Panel A, schematic of p204-specific reporter construct. The indicated segments from the 5′-flanking region of the p204 gene were linked to an SV40 promoter (SV) and a DNA segment encoding luciferase (Luc). Ovals represent SBEs. Panel B, miR-199a* inhibits Smad-mediated activation of p204-specific reporter genes. The indicated reporter gene construct was transfected into C3H10T1/2 cells together with either the indicated Smad expression plasmids (i.e. Smad1, Smad4) alone or in addition to pSuper199a*, as well as a β-galactosidase internal control plasmid. The luciferase activities were normalized to the β-galactosidase activities. The normalized values were then calibrated against control values, which were arbitrarily set as 1. Panel C, miR-199a* completely abolishes Smad-activated p204 expression in C3H10T1/2 cells. The indicated Smads expression plasmids and pSuper199a* were transfected into C3H10T1/2 cells. Total RNA was extracted and expression of p204 was assayed via real-time PCR. p204 expression was normalized against the endogenous control, glyceraldehyde-3-phosphate dehydrogenase. The normalized values were then calibrated against control values, which were arbitrarily set as 1. Means from three independent experiments are shown (error bars indicate S.D.).
To further confirm this hypothesis, C3H10T1/2 cells were transfected with Smad1 and Smad4 mammalian expression plasmids. This predictably resulted in the up-regulation of p204 expression, as determined by real-time quantitative PCR. The addition of pSuper199a* resulted in the reversal of Smad1 and Smad4-mediated p204 activation (Fig. 8C). This suggests that miR-199a*, through its inhibition of the Smads pathway, is able to inhibit the expression of downstream genes such as p204.
DISCUSSION
Chondrogenesis plays a fundamental role in skeletal patterning, bone formation, and joint development. Well orchestrated chondrogenesis is controlled exquisitely by cellular interactions with growth factors, surrounding matrix proteins, and other environmental factors that mediate cellular signaling pathways and transcription of specific genes in a temporal-spatial manner (43–45). A number of miRNAs are highly expressed in embryonic skeletal tissue, suggesting that they may play an important role in chondrogenesis via targeting to the molecules critical for chondrogenesis. For example, miR-140 was found to be expressed exclusively in the cartilage tissue of embryonic zebrafish, medaka, mice, and chickens (27, 29, 46). Although miR-140 is known to target genes relevant to cartilage biology, such as histone deacetylase 4, the exact role of miR-140 in chondrogenic differentiation has yet to be defined (46).
In addition to miR-140, miRNAs 146, 140*, 199a, 199a*, and 145 are all highly expressed in zebrafish embryonic skeletal elements (29). Interestingly, however, the only non-ubiquitously expressed miRNAs that are abundant in the developing cartilage of zebrafish, medaka, and chicken embryos, are miR-140, miR-199a, and miR-199a* (27, 29). Additional data obtained from recent experiments involving the cloning and sequencing of 64 mouse small RNA libraries extracted from different organs and tissues, showed that miR-199a* is differentially expressed in connective tissue cells (28, 47). Thus with the combination of the array (Fig. 1A) and real-time PCR data (Fig. 1E), miR-199a* emerged as a candidate with significant potential to be involved in the regulation of chondrogenic differentiation. Certainly, other miRNAs such as miR-374 were found to be differentially expressed following BMP-2 treatment (Fig. 1, A, B, and F). Although these miRNAs are not specific to skeletal tissue, it would be interesting to investigate their potential effects on chondrogenesis. In addition, we also performed a computer-based prediction of the targets of miR-374 and miR-298. No members of the Smad family were predicted to be their targets. Additionally, no significant overlaps in the targets of miR-298, miR-374, or miR-199a* were identified.
Our study has identified miR-199a* as an inhibitor of early chondrogenic differentiation. We report that overexpression of miR-199a* results in the inhibition of chondrogenic differentiation in C3H10T1/2 cells, as evidenced by the reduced expression of early chondrogenic markers, collagen type II α1 (Col2A1) and COMP. Furthermore, inhibition of miR-199a* results in enhanced expression of those same chondrogenic markers. COMP encodes a noncollagenous extracellular matrix protein that is highly expressed in cartilage. Sox9, a key regulator of chondrogenesis, binds directly to the COMP gene promoter, and activates its expression (30). Although we did not find a statistically significant reduction in Sox9 expression levels in C3H10T1/2 cells, this may be due to insufficient sampling, because Sox9 is known to be an essential transcription factor of chondrogenic differentiation. Alternatively, a recent study has found that the BMP-2/Smads pathway regulates Sox9 activity, but does not alter Sox9 mRNA expression levels (48). This may explain why we were unable to observe decreased Sox9 mRNA expression in C3H10T1/2 cells that were overexpressing miR-199a*. Nevertheless, in experiments involving a prechondrogenic cell line (ATDC5), Sox9 expression was significantly decreased following miR-199a* overexpression (Fig. 2, B and C). Although the reduction in chondrogenesis markers was often less than 40%, this may be due to incomplete transfection by Lipofectamine 2000. Previous experience has shown transfection rates as low as 25% with this system (data not shown).
The finding that miR-199a* also inhibits chondrogenesis in ATDC5 cells is particularly interesting. The clonal cell line ATDC5 exhibits type-II collagen expressing chondrogenic differentiation in the presence of human insulin. Thus, mediation of chondrogenesis by miR-199a* is not only restricted to BMP-2 stimulation.
We also reported that miR-199a* expression is decreased in early chondrogenesis, which coincides with the increased expression of Smad1 (Fig. 5E), a known downstream signaling molecule of BMP-2 (32, 48, 49). Thus, we propose that miR-199a* mediates early chondrogenesis by following the model proposed by Li et al. (50). In accordance with the model, a BMP-2-mediated reduction in miR-199a* expression serves to release the post-transcriptional repression of Smad1 by miR-199a*, thereby allowing BMP-2 mediated intracellular signals to reach their transcriptional targets and drive chondrogenesis. miR-199a* is able to repress Smad1 expression via its binding with near-perfect complementary to the Smad1 3′-UTR (Fig. 5A) (47). Although miRNAs that bind with less than perfect complementarity are generally thought to repress gene expression through translational inhibition, there is increasing evidence that mRNA cleavage may also be a mechanism of action for these miRNAs (36–38).
Although this study indicates that miR-199a* is a negative regulator of early chondrogenesis, the decrease in miR-199a* expression immediately following BMP-2 induction was followed by a gradual increase in miR-199a* levels over a few days (Fig. 1E). This finding would seem to suggest that miR-199a* may be necessary for the later stages of chondrogenesis, including chondrocyte hypertrophy and maturation.
Stimulation of C3H10T1/2 cells with BMP-2 resulted in the increased expression of Smad1 (Fig. 5E), a result that is consistent with previous findings, which identify Smad1 as an intracellular transducer of BMP-2 signaling (32, 48, 49). Smad1 is also an established mediator of osteoblast differentiation through the activation of target genes, including p204, a factor that binds Cbfa1, pRb, and Ids (40–42). We have shown that miR-199a* is able to mediate p204 expression, at least in the setting of chondrocyte differentiation. Thus, it is interesting to determine whether miR-199a* may also play an important role in osteogenesis. Intriguingly, a recent report shows that miR-26a inhibits osteoblast differentiation via targeting to Smad1 transcription factor (51).
miR-199a* is also predicted to target several other genes that are related to BMP-2 signaling, including frizzled homolog 6 (Fzd6) and inhibitor of DNA binding 4 (Id4) (Fig. 4A). FZD6 is a receptor involved in the canonical Wnt signaling pathway, which has been shown to play a key role in regulating chondrocyte and osteoblast differentiation (52–55). FZD6 exhibits altered expression in response to the induction of chondrogenesis (56). It remains to be determined whether Fzd6, as a target of miR-199a*, regulates chondrocyte differentiation. Id4 is part of a larger family of inhibitor of differentiation proteins that play a significant role in osteochondrogenic differentiation (30, 42, 57). Thus, miR-199a* may regulate chondrogenic and osteogenic differentiation by suppressing multiple target genes.
Although the focus of this study has been on chondrogenesis, it would be interesting to investigate the role of miR-199a* in osteoblast differentiation as well, particularly because Smad signaling is also involved in osteogenesis (13, 14, 40–42). Although various studies have localized miR-199a* expression to skeletal tissues (27–29), it remains to be determined whether miR-199a* is differentially expressed in cartilage, bone, or both. Future in vivo experiments in a mouse model are necessary to address this important question.
In conclusion, we demonstrate that several miRNAs are differentially regulated in response to BMP-2. Of these miRNAs, we report that miR-199a* acts as a negative regulator of early chondrogenic differentiation through its suppression of Smad1 transcription factor. To our knowledge, this is the first report showing that a specific microRNA, i.e. miR-199a*, plays a crucial role in the course of chondrogenesis as well as the molecular mechanism involved; in addition, this study also provides new insights into BMP/Smad signaling in controlling skeletogenesis.
This work was supported, in whole or in part, by National Institutes of Health Grants AR050620, AR053210, and AG029388. This work was also supported by a grant from the Arthritis National Research Foundation.
Footnotes
The abbreviations used are: miRNA, microRNA; BMP, bone morphogenetic protein; Cbfa1, core binding factor α-1; pRb, retinoblastoma protein; UTR, untranslated region; SBE, Smad-binding elements; Id, inhibitor of DNA binding or inhibitor of differentiation; FZD6, frizzled homolog 6; COMP, cartilage oligomeric matrix protein.
References
- 1.Lewis, B. P., Burge, C. B., and Bartel, D. P. (2005) Cell 120, 15-20 [DOI] [PubMed] [Google Scholar]
- 2.Chan, S. P., and Slack, F. J. (2006) RNA Biol. 3, 97-100 [DOI] [PubMed] [Google Scholar]
- 3.Chen, C. Z., Li, L., Lodish, H. F., and Bartel, D. P. (2004) Science 303, 83-86 [DOI] [PubMed] [Google Scholar]
- 4.Esau, C., Kang, X., Peralta, E., Hanson, E., Marcusson, E. G., Ravichandran, L. V., Sun, Y., Koo, S., Perera, R. J., Jain, R., Dean, N. M., Freier, S. M., Bennett, C. F., Lollo, B., and Griffey, R. (2004) J. Biol. Chem. 279, 52361-52365 [DOI] [PubMed] [Google Scholar]
- 5.Harris, T. A., Yamakuchi, M., Ferlito, M., Mendell, J. T., and Lowenstein, C. J. (2008) Proc. Natl. Acad. Sci. U. S. A. 105, 1516-1521 [DOI] [PMC free article] [PubMed] [Google Scholar]
- 6.Krichevsky, A. M., Sonntag, K. C., Isacson, O., and Kosik, K. S. (2006) Stem Cells 24, 857-864 [DOI] [PMC free article] [PubMed] [Google Scholar]
- 7.Sempere, L. F., Freemantle, S., Pitha-Rowe, I., Moss, E., Dmitrovsky, E., and Ambros, V. (2004) Genome Biol. 5, R13. [DOI] [PMC free article] [PubMed] [Google Scholar]
- 8.Yi, R., O'Carroll, D., Pasolli, H. A., Zhang, Z., Dietrich, F. S., Tarakhovsky, A., and Fuchs, E. (2006) Nat. Genet. 38, 356-362 [DOI] [PubMed] [Google Scholar]
- 9.Zhao, Y., Samal, E., and Srivastava, D. (2005) Nature 436, 214-220 [DOI] [PubMed] [Google Scholar]
- 10.Lin, E. A., and Liu, C. J. (2009) Front. Biosci. 14, 2757-2764 [DOI] [PMC free article] [PubMed] [Google Scholar]
- 11.Kobayashi, T., Lu, J., Cobb, B. S., Rodda, S. J., McMahon, A. P., Schipani, E., Merkenschlager, M., and Kronenberg, H. M. (2008) Proc. Natl. Acad. Sci. U. S. A. 105, 1949-1954 [DOI] [PMC free article] [PubMed] [Google Scholar]
- 12.Berezikov, E., Guryev, V., van de Belt, J., Wienholds, E., Plasterk, R. H., and Cuppen, E. (2005) Cell 120, 21-24 [DOI] [PubMed] [Google Scholar]
- 13.Chen, D., Zhao, M., Harris, S. E., and Mi, Z. (2004) Front. Biosci. 9, 349-358 [DOI] [PubMed] [Google Scholar]
- 14.Chen, D., Zhao, M., and Mundy, G. R. (2004) Growth Factors 22, 233-241 [DOI] [PubMed] [Google Scholar]
- 15.Shingara, J., Keiger, K., Shelton, J., Laosinchai-Wolf, W., Powers, P., Conrad, R., Brown, D., and Labourier, E. (2005) RNA (N. Y.) 11, 1461-1470 [DOI] [PMC free article] [PubMed] [Google Scholar]
- 16.Saeed, A. I., Sharov, V., White, J., Li, J., Liang, W., Bhagabati, N., Braisted, J., Klapa, M., Currier, T., Thiagarajan, M., Sturn, A., Snuffin, M., Rezantsev, A., Popov, D., Ryltsov, A., Kostukovich, E., Borisovsky, I., Liu, Z., Vinsavich, A., Trush, V., and Quackenbush, J. (2003) BioTechniques 34, 374-378 [DOI] [PubMed] [Google Scholar]
- 17.Griffiths-Jones, S., Saini, H. K., van Dongen, S., and Enright, A. J. (2008) Nucleic Acids Res. 36, D154-D158 [DOI] [PMC free article] [PubMed] [Google Scholar]
- 18.Lewis, B. P., Shih, I. H., Jones-Rhoades, M. W., Bartel, D. P., and Burge, C. B. (2003) Cell 115, 787-798 [DOI] [PubMed] [Google Scholar]
- 19.Krek, A., Grun, D., Poy, M. N., Wolf, R., Rosenberg, L., Epstein, E. J., MacMenamin, P., da Piedade, I., Gunsalus, K. C., Stoffel, M., and Rajewsky, N. (2005) Nat. Genet. 37, 495-500 [DOI] [PubMed] [Google Scholar]
- 20.John, B., Enright, A. J., Aravin, A., Tuschl, T., Sander, C., and Marks, D. S. (2004) PLoS Biol. 2, e363. [DOI] [PMC free article] [PubMed] [Google Scholar]
- 21.Liu, C. (2005) J. Musculoskelet. Neuronal Interact. 5, 340-341 [PMC free article] [PubMed] [Google Scholar]
- 22.Liu, C. J., Prazak, L., Fajardo, M., Yu, S., Tyagi, N., and Di Cesare, P. E. (2004) J. Biol. Chem. 279, 47081-47091 [DOI] [PubMed] [Google Scholar]
- 23.Liu, T., Gao, Y., Sakamoto, K., Minamizato, T., Furukawa, K., Tsukazaki, T., Shibata, Y., Bessho, K., Komori, T., and Yamaguchi, A. (2007) J. Cell. Physiol. 211, 728-735 [DOI] [PubMed] [Google Scholar]
- 24.Chen, L., Fink, T., Zhang, X. Y., Ebbesen, P., and Zachar, V. (2005) Differentiation 73, 350-363 [DOI] [PubMed] [Google Scholar]
- 25.Kong, L., and Liu, C. J. (2008) Cell. Mol. Life Sci. 65, 3494-3506 [DOI] [PMC free article] [PubMed] [Google Scholar]
- 26.Shukunami, C., Shigeno, C., Atsumi, T., Ishizeki, K., Suzuki, F., and Hiraki, Y. (1996) J. Cell Biol. 133, 457-468 [DOI] [PMC free article] [PubMed] [Google Scholar]
- 27.Ason, B., Darnell, D. K., Wittbrodt, B., Berezikov, E., Kloosterman, W. P., Wittbrodt, J., Antin, P. B., and Plasterk, R. H. (2006) Proc. Natl. Acad. Sci. U. S. A. 103, 14385-14389 [DOI] [PMC free article] [PubMed] [Google Scholar]
- 28.Landgraf, P., Rusu, M., Sheridan, R., Sewer, A., Iovino, N., Aravin, A., Pfeffer, S., Rice, A., Kamphorst, A. O., Landthaler, M., Lin, C., Socci, N. D., Hermida, L., Fulci, V., Chiaretti, S., Foa, R., Schliwka, J., Fuchs, U., Novosel, A., Muller, R. U., Schermer, B., Bissels, U., Inman, J., Phan, Q., Chien, M., Weir, D. B., Choksi, R., De Vita, G., Frezzetti, D., Trompeter, H. I., Hornung, V., Teng, G., Hartmann, G., Palkovits, M., Di Lauro, R., Wernet, P., Macino, G., Rogler, C. E., Nagle, J. W., Ju, J., Papavasiliou, F. N., Benzing, T., Lichter, P., Tam, W., Brownstein, M. J., Bosio, A., Borkhardt, A., Russo, J. J., Sander, C., Zavolan, M., and Tuschl, T. (2007) Cell 129, 1401-1414 [DOI] [PMC free article] [PubMed] [Google Scholar]
- 29.Wienholds, E., Kloosterman, W. P., Miska, E., Alvarez-Saavedra, E., Berezikov, E., de Bruijn, E., Horvitz, H. R., Kauppinen, S., and Plasterk, R. H. (2005) Science 309, 310-311 [DOI] [PubMed] [Google Scholar]
- 30.Liu, C. J., Zhang, Y., Xu, K., Parsons, D., Alfonso, D., and Di Cesare, P. E. (2007) Front. Biosci. 12, 3899-3910 [DOI] [PubMed] [Google Scholar]
- 31.Shi, B., Sepp-Lorenzino, L., Prisco, M., Linsley, P., deAngelis, T., and Baserga, R. (2007) J. Biol. Chem. 282, 32582-32590 [DOI] [PubMed] [Google Scholar]
- 32.Hatakeyama, Y., Nguyen, J., Wang, X., Nuckolls, G. H., and Shum, L. (2003) J. Bone Joint Surg. Am. 85, Suppl. 3, 13-18 [DOI] [PubMed] [Google Scholar]
- 33.Carrington, J. C., and Ambros, V. (2003) Science 301, 336-338 [DOI] [PubMed] [Google Scholar]
- 34.Doench, J. G., Petersen, C. P., and Sharp, P. A. (2003) Genes Dev. 17, 438-442 [DOI] [PMC free article] [PubMed] [Google Scholar]
- 35.Zeng, Y., Yi, R., and Cullen, B. R. (2003) Proc. Natl. Acad. Sci. U. S. A. 100, 9779-9784 [DOI] [PMC free article] [PubMed] [Google Scholar]
- 36.Kim, V. N. (2006) Genes Dev. 20, 1993-1997 [DOI] [PubMed] [Google Scholar]
- 37.Kim, V. N., and Nam, J. W. (2006) Trends Genet. 22, 165-173 [DOI] [PubMed] [Google Scholar]
- 38.Yekta, S., Shih, I. H., and Bartel, D. P. (2004) Science 304, 594-596 [DOI] [PubMed] [Google Scholar]
- 39.Liu, C. J., Chang, E., Yu, J., Carlson, C. S., Prazak, L., Yu, X. P., Ding, B., Lengyel, P., and Di Cesare, P. E. (2005) J. Biol. Chem. 280, 2788-2796 [DOI] [PubMed] [Google Scholar]
- 40.Luan, Y., Yu, X. P., Xu, K., Ding, B., Yu, J., Huang, Y., Yang, N., Lengyel, P., Di Cesare, P. E., and Liu, C. J. (2007) J. Biol. Chem. 282, 16860-16870 [DOI] [PubMed] [Google Scholar]
- 41.Luan, Y., Yu, X. P., Yang, N., Frenkel, S., Chen, L., and Liu, C. J. (2008) Mol. Biol. Cell 19, 2113-2126 [DOI] [PMC free article] [PubMed] [Google Scholar]
- 42.Zhang, Y., Kong, L., Carlson, C. S., and Liu, C. J. (2008) Cell Death Differ. 15, 1760-1771 [DOI] [PubMed] [Google Scholar]
- 43.Colnot, C. (2005) J. Cell. Biochem. 95, 688-697 [DOI] [PubMed] [Google Scholar]
- 44.Franz-Odendaal, T. A., and Vickaryous, M. K. (2006) Dev. Dyn. 235, 1244-1255 [DOI] [PubMed] [Google Scholar]
- 45.Goldring, M. B., Tsuchimochi, K., and Ijiri, K. (2006) J. Cell. Biochem. 97, 33-44 [DOI] [PubMed] [Google Scholar]
- 46.Tuddenham, L., Wheeler, G., Ntounia-Fousara, S., Waters, J., Hajihosseini, M. K., Clark, I., and Dalmay, T. (2006) FEBS Lett. 580, 4214-4217 [DOI] [PubMed] [Google Scholar]
- 47.Betel, D., Wilson, M., Gabow, A., Marks, D. S., and Sander, C. (2008) Nucleic Acids Res. 36, D149-D153 [DOI] [PMC free article] [PubMed] [Google Scholar]
- 48.Pan, Q., Yu, Y., Chen, Q., Li, C., Wu, H., Wan, Y., Ma, J., and Sun, F. (2008) J. Cell. Physiol. 217, 228-241 [DOI] [PubMed] [Google Scholar]
- 49.Denker, A. E., Nicoll, S. B., and Tuan, R. S. (1995) Differentiation 59, 25-34 [DOI] [PubMed] [Google Scholar]
- 50.Li, Z., Hassan, M. Q., Volinia, S., van Wijnen, A. J., Stein, J. L., Croce, C. M., Lian, J. B., and Stein, G. S. (2008) Proc. Natl. Acad. Sci. U. S. A. 105, 13906-13911 [DOI] [PMC free article] [PubMed] [Google Scholar]
- 51.Luzi, E., Marini, F., Sala, S. C., Tognarini, I., Galli, G., and Brandi, M. L. (2008) J. Bone Miner. Res. 23, 287-295 [DOI] [PubMed] [Google Scholar]
- 52.Chimal-Monroy, J., Montero, J. A., Ganan, Y., Macias, D., Garcia-Porrero, J. A., and Hurle, J. M. (2002) Dev. Dyn. 224, 314-320 [DOI] [PubMed] [Google Scholar]
- 53.Church, V. L., and Francis-West, P. (2002) Int. J. Dev. Biol. 46, 927-936 [PubMed] [Google Scholar]
- 54.Hartmann, C., and Tabin, C. J. (2001) Cell 104, 341-351 [DOI] [PubMed] [Google Scholar]
- 55.Lako, M., Lindsay, S., Bullen, P., Wilson, D. I., Robson, S. C., and Strachan, T. (1998) Hum. Mol. Genet. 7, 813-822 [DOI] [PubMed] [Google Scholar]
- 56.Yates, K. E. (2004) Osteoarthritis Cartilage 12, 497-505 [DOI] [PubMed] [Google Scholar]
- 57.Kulterer, B., Friedl, G., Jandrositz, A., Sanchez-Cabo, F., Prokesch, A., Paar, C., Scheideler, M., Windhager, R., Preisegger, K. H., and Trajanoski, Z. (2007) BMC Genomics 8, 70. [DOI] [PMC free article] [PubMed] [Google Scholar]


