Abstract
The crystal structure of the complex between the heme- and FMN-binding domains of bacterial cytochrome P450BM-3, a prototype for the complex between eukaryotic microsomal P450s and P450 reductase, has been determined at 2.03 Å resolution. The flavodoxin-like flavin domain is positioned at the proximal face of the heme domain with the FMN 4.0 and 18.4 Å from the peptide that precedes the heme-binding loop and the heme iron, respectively. The heme-binding peptide represents the most efficient and coupled through-bond electron pathway to the heme iron. Substantial differences between the FMN-binding domains of P450BM-3 and microsomal P450 reductase, observed around the flavin-binding sites, are responsible for different redox properties of the FMN, which, in turn, control electron flow to the P450.
Keywords: cytochrome P450 reductase, flavodoxin; protein–protein interaction
Cytochromes P450, a gene superfamily of heme proteins found in all eukaryotes, most prokaryotes, and Archaea (1), catalyze the monooxygenation of a wide variety of organic molecules. P450 reactions of biological significance include steroid biogenesis, drug metabolism, procarcinogen activation, xenobiotic detoxification, and fatty acid metabolism (2, 3). Electron transfer from a redox partner to the P450 is a key step in the P450 catalytic cycle. Bacterial and mitochondrial P450s receive electrons from a small soluble iron-sulfur protein, whereas the redox partner for mammalian microsomal enzymes is an FAD/FMN-dependent NADPH-cytochrome P450 oxidoreductase (CPR). In CPR, FAD serves as an electron acceptor from NADPH, whereas the FMN moiety interacts with and reduces the P450. The problem of redox partner recognition and mechanism of electron transfer has been one of the most important and intriguing in the area of P450 research, in particular, and in biological electron-transfer reactions, in general. The involvement of both electrostatic and hydrophobic forces in protein–protein interactions between P450s and their redox partners has been demonstrated (4–9). Although the structures of four bacterial P450s, putidaredoxin, adrenodoxin, and a soluble form of rat CPR are known (10–16), the questions of where and how P450s interact with electron donors and the precise nature of the electron-transfer mechanism remain to be answered.
Flavocytochrome P450BM-3 (119 kDa), a self-sufficient fatty acid monooxygenase from Bacillus megaterium (17, 18), consists of a heme- (BMP) and FMN/FAD-containing reductase domains linked together on a single polypeptide. Being a soluble multidomain electron-transfer protein, this enzyme represents an excellent model system for studying structure/function relationships in P450s and the mechanism of electron transfer. Expression of the individual domains and subdomains of P450BM-3 significantly facilitated studies on the mechanism of domain–domain interaction and interdomain electron transfer (19–25). The heme/FMN-containing domain of P450BM-3 (BMP/FMN, missing the FAD domain) was found to be the simplest model to follow the FMN to heme intramolecular electron transfer (24, 25). Here we report the crystal structure of a complex between the heme- and FMN-binding domains of P450BM-3, which we believe represents a specific electron-transfer complex.
Purification and Crystallization of BMP/FMN.
The 6-histidine tag-fused BMP/FMN was purified as described (25). Crystals of purified BMP/FMN were grown at room temperature by liquid–liquid free interface diffusion in a capillary. Ten microliters of the 450 μM protein solution in 50 mM KH2PO4 was overlaid on 10 μl of a solution containing 40% polyethylene glycol 8000, 100 mM Pipes (pH 6.8), and 200 mM NH4Cl. Data collection was performed at room temperature on a Siemens X-1000 area detector, at −170°C under nitrogen cold stream with an R-AXIS-IV imaging plate (Molecular Structure, The Woodlands, TX) and at −170°C on beamline 7-1 of the Stanford Synchrotron Research Laboratories. For cryogenic data collections, 25% ethylene glycol was used as a cryoprotectant. Crystals of BMP/FMN belong to space group P212121 with unit cell dimensions a = 58.8 Å, b = 94.6 Å, and c = 209.1 Å.
Structure Determination of BMP/FMN.
Diffraction data were processed with denzo and scalepack (26). The data set collected at −170°C at Stanford Synchrotron Research Laboratories was used for the final refinement. The structure was solved by isomorphous and molecular replacement methods (Table 1). Molecule A in the 1.65 Å cryogenic P450BM-3 heme domain data set (H.L., unpublished data, PDB ID code 1BU7) was used as a molecular replacement search model for the heme domain in BMP/FMN structure. The high-resolution data set was collected on beamline 7–1 of Stanford Synchrotron Research Laboratories using 30% ethylene glycol as a cryoprotectant. A total of 128,585 unique reflections were collected with 97% completeness and Rsym of 0.038. The structure was refined by using x-plor (27) and shelxl (28) with a final R = 0.197 and Rfree = 0.251, including 952 water and 14 ethylene glycol molecules. The molecule of Disulfovibrio vulgaris flavodoxin (29) with fragments 40–49, 60–69, 70–82, and 95–101 omitted was used as a search model for the FMN-binding domain of P450BM-3. The initial phases were based on the molecular replacement solution by using AMoRe (30), with a correlation coefficient of 0.596 and R factor of 0.460 for the polyalanine model of two copies of the heme domain and one FMN domain. A MeHgCl2 derivative was also prepared so that the single isomorphous replacement phases could be combined with molecular replacement phases by using sigmaa (30). The electron density was further modified by solvent flattening and noncrystallographic-symmetry averaging between two copies of the heme domain by using dm (30). The resulting electron-density map allowed fitting the side chains in the FMN domain. The subsequent model building and refinement were carried out with tom/frodo (31), x-plor and, at the final stage, shelxl. Coordinates have been deposited into the Protein Data Bank (PDB ID code 1BVY).
Table 1.
Data collection and structure determination
| Parameter | Native* | Native† | Native‡ | MeHgCl2† |
|---|---|---|---|---|
| Resolution, dmin, Å | 3.5 | 2.65 | 2.03 | 2.3 |
| Unique reflections, no. | 15,011 | 33,290 | 63,363 | 48,635 |
| Completeness, % | 91 | 96 | 83 | 93 |
| Redundancy | 2.3 | 3.5 | 2.7 | 3.2 |
| I/σ(I) at dmin | — | 2.9 | 3.0 | 3.3 |
| Rsym§ | 10.8 | 8.6 | 4.6 | 7.1 |
| Refinement statistics | d spacings, Å | R | Rfree | No. of reflections in refinement with F > 2σ(F) | Non-H atoms, no. | Solvent sites, no. | rms deviation
|
|
|---|---|---|---|---|---|---|---|---|
| Bond length, Å | Angular distances, Å | |||||||
| BMP/FMN model | 10 to 2.03 | 0.19 | 0.27 | 58,243 | 8,350 | 952 | 0.005 | 0.020 |
Data collected at room temperature on a Siemens X-1000 area detector.
Data collected at −170°C under nitrogen cold stream with an R-AXIS-IV imaging plate (Molecular Structure, The Woodlands, TX).
Data collected at −170°C at the beamline 7–1 of the Stanford Synchrotron Research Laboratories and used for the final refinement.
Rsym = ∑|I − 〈I〉|/∑I, where I is the observed intensity and 〈I〉 is the average intensity of multiple symmetry-related observations of that reflection.
Electrophoretic analysis of dissolved crystals revealed that the linker between the heme- and FMN-binding domains was proteolyzed. As a result, the asymmetric unit consists of two heme-domain molecules, A (residues 20–458) and B (residues 21–458), and only one flavin domain (residues 479–630). The N and C termini of the domains are not defined in the crystalline state. The two heme domains related by a noncrystallographic two-fold symmetry are virtually identical. When molecules A and B are superimposed, the rms deviation between equivalent Cα positions is 0.44 Å. The two domains are tightly associated and form the same type of dimer that was found in the crystal structures of substrate-free and substrate-bound heme domain of P450BM-3 (32, 33).
Interaction of the Heme- and FMN-domains of P450BM-3.
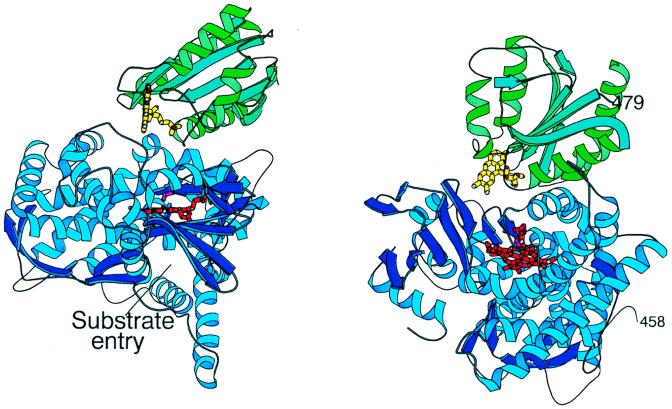
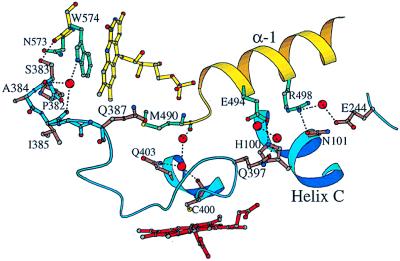
The crystal structure of the complex between the heme and FMN domains (BM3-FMN) of P450BM-3 is shown in Fig. 1. As predicted from sequence homologies (34, 35), BM3-FMN shares a similar fold with flavodoxins and the FMN domain of CPR (CPR-FMN), which consists of a central five-stranded parallel β-sheet (β1–β5) surrounded by four α-helices (α1–α4). Residues from α1-helix and the outer FMN-binding loop of BM3-FMN interact with the C- and L-helices and the peptide that precedes the heme-binding loop of BMP, respectively (Fig. 2). There are two direct hydrogen bonds, one salt bridge, and several water-mediated contacts between the two domains. The presence of only a few direct contacts in the 967 Å2 area of interface indicates that the interaction between the heme and flavin domains is not strong.
Figure 1.
Two views of the heme–FMN domain complex of cytochrome P450BM-3 with the heme domain (blue), flavin domain (green), the FMN (yellow), and the heme (red). The proximal side of the heme domain is defined as the surface of the protein closest to the heme ligand Cys-400 is shown in magenta. The distal surface forms part of the substrate-binding pocket. The last visible residue in the heme domain and the first visible residue in the flavin domain are labeled 458 and 479, respectively. The length of the missing linker, which was proteolized during crystallization, allows connection between the two domains.
Figure 2.
The heme–FMN domain interface. Blue and yellow colors are assigned to the backbones for the heme and flavin domains, respectively. Some of the solvent molecules mediating domain–domain interaction are shown in red. The dotted lines represent hydrogen bonds and salt bridges. The Pro-382–Cys-400 part of the heme-binding peptide provides a direct through-bond electron transfer pathway from the FMN to the heme.
The solvent-exposed part of the isoalloxazine ring of the FMN faces the interface between the two domains, with the methyl groups pointing toward the heme-binding loop (Fig. 2). The flavin and heme planes are nearly perpendicular. The 7-methyl group of the FMN is 4.1 and 4.0 Å away from the carbonyl oxygen of Ile-385 and amide nitrogen of Gln-387, respectively, and 18.4 Å away from the heme iron. The indole ring of Trp-574, shown to be critical for electron transfer from the FMN to the heme of P450BM-3 (36), is coplanar to the isoalloxazine ring of the FMN and shields a significant part of it from solvent. The two aromatic rings are only 3.3 Å apart and, as indicated by the presence of a broad absorption transition extending beyond 600 nm in the visible absorption spectrum of the oxidized BM3-FMN (22), form a charge-transfer complex. The indole ring of Trp-574 is less than 4 Å away from the carbonyl oxygen of Pro-382 and side chain of Ser-383. A well ordered water molecule at the interface serves as an H-bonded bridge between the indole nitrogen of Trp-574 and carbonyl oxygens of Ser-383 and Ile-385. The proximity of the isoalloxazine ring of the FMN and indole ring of Trp-574, with their conjugated π-orbitals, to the heme-binding peptide implicates the latter as the through-bond electron-transfer pathway from the flavin to the heme. Electrons could flow from the flavin and/or Trp-574 to the Pro-382–Gln-387 peptide and then directly to the heme iron through bonded orbitals via cysteinyl ligand (Cys-400) or, alternatively, through-space jumps via main- and side-chain atoms of Pro-392, Gly-393, and/or Arg-398, which are only 3.4, 3.6, and 3.1 Å, respectively, away from the porphyrin macrocycle.
The precise positioning of the methyl groups of the FMN toward the heme-binding loop, the most efficient and coupled pathway for electron flow to the heme iron, indicates that the complex between the two domains of P450BM-3 is specific. The manner of domain–domain interaction in the crystallographic complex is also consistent with previous studies on P450s. P450BM-3 is the only known bacterial P450 with Asn-381–Ala-389 insertion, which is characteristic of eukaryotic P450s. This region, as well as the proximal face of P450s, with its positively charged residues centered over the Cys ligand pocket, has been proposed as a docking site for redox partners (37, 38). This side of the P450 molecule, the closest approach to the heme iron, was found to provide positively charged residues critical for redox-partner interaction (39–42). It should be noted that the residue analogous to His-100 from the C-helix in P450BM-3, the only residue that forms a salt bridge in the complex, is conserved as a basic amino acid in P450s.
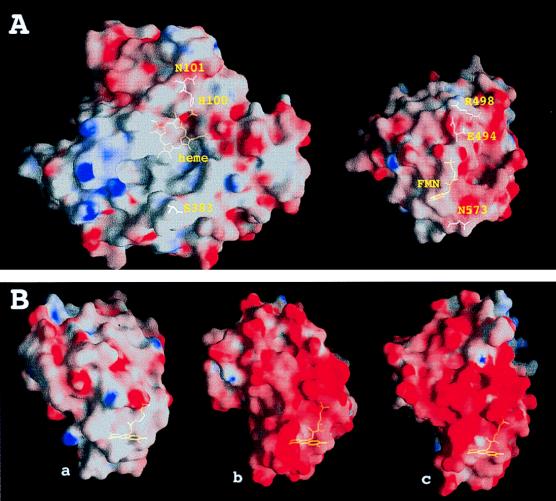
Calculation of surface potentials demonstrates that, indeed, the complex formation between BMP and BM3-FMN might be facilitated by long-range electrostatic attraction with the involvement of complementary charged surfaces on both molecules (Fig. 3A). In the flavin domain, acidic amino acids are clustered on the side of the molecule that faces and interacts with the positively charged proximal side of the heme domain.
Figure 3.
Electrostatic potential at the molecular surfaces in the interface between the heme and FMN domains of P450BM-3 (A) and around the flavin-binding site of the FMN domain of P450BM-3 and its structural and functional analogs (B). The diagrams were prepared with grasp (57). The deepest shades of blue and red correspond to potentials of ≥+16 kT and ≥−16 kT, respectively, whereas neutral points are colored white. The surfaces were made semitransparent to show cofactors and residues involved in the interaction. (A) To display the interacting surfaces between the heme and FMN domains of P450BM-3, the latter has been detached and rotated by 180°. (B) The proteins shown are (a) FMN domain of P450BM-3, (b) D. vulgaris flavodoxin (29), and (c) FMN domain of microsomal P450 reductase (16). All three are oriented approximately the same with the FMN-binding site facing the viewer.
Structural Differences Between BM3-FMN and Flavodoxins.
Analysis of the surface potentials reveals that the charge distribution in BM3-FMN dramatically differs from that of flavodoxins and CPR-FMN (Fig. 3B). The flavin-binding site of BM3-FMN is surrounded by mainly neutral and hydrophobic amino acid residues, whereas in flavodoxins and CPR-FMN, conserved negatively charged amino acid residues are clustered near the flavin. The asymmetric charge distribution results in a dipole moment along the axis passing through the FMN, which is thought to be important in the formation of electron-transfer complexes between flavodoxins and their redox partners (43–46).
In flavodoxins, in addition to redox-partner recognition, charged amino acid residues within and around the FMN-binding site are involved in modulation of the redox properties of the FMN by the differential stabilization/destabilization of the redox states of the flavin cofactor through both short- and long-range electrostatic interactions (47–49). In these proteins, the anionic FMN hydroquinone (hq) is formed in a relatively nonpolar environment, where steric hindrance to protonation of the flavin N1 atom and unfavorable electrostatic interactions introduced by negatively charged amino acid residues and coplanar aromatic π-stacking interactions in the FMN binding site destabilize the flavin hq and decrease the redox potential for the semiquinone (sq)/hq couple. The thermodynamic stabilization of the neutral FMN sq and destabilization of anionic hq is a key property of flavodoxins that function as one-electron carriers between other redox proteins, with the FMN cycling between the sq and hq forms (50).
In contrast, BM3-FMN destabilizes the FMN sq and stabilizes the FMN hq (22, 51, 52). As a result, the midpoint reduction potentials of the FMNox/sq and FMNsq/hq couples are switched compared with those of flavodoxins. A distinctly different charge distribution near the FMN-binding site in BM3-FMN (Fig. 3B) is one of the factors that could affect redox properties of the flavin. The lack of negative charges clustered near the FMN, but, instead, the presence of two basic amino acids, Lys-572 and Lys-580, located within 10 Å of the pyrimidine portion and N1 atom of the isoalloxazine ring of the flavin, are likely to contribute to the partial neutralization and stabilization of the anionic FMN hq in P450BM-3 and to cause the increase of the redox potential for the FMNsq/hq couple. The ionizable group of His-539 in the active center of BM3-FMN could also be protonated during the catalytic cycle, raising the total positive charge near the flavin. Redox-linked ionization of histidine, adjacent to the isoalloxazine ring, was shown to stabilize the FMN hq anion in D. vulgaris flavodoxin by the favorable through-space electrostatic interaction from the positive charge on the imidazole ring (53).
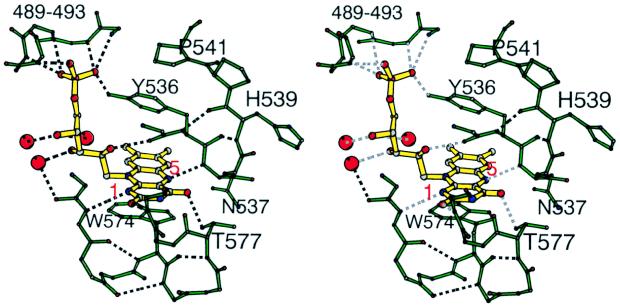
Another factor that may affect redox properties of the flavin in BM3-FMN is the rigidity of the inner FMN-binding loop, which does not allow this peptide to undergo a conformational change to form a new hydrogen bond and stabilize the neutral FMN sq. The flavin–protein interactions in the active site of BM3-FMN are shown in Fig. 4. Compared with flavodoxins and CPR, the primary differences in this region are (i) in BM3-FMN, the inner FMN-binding loop is one residue shorter and ends with two prolines; (ii) the peptide is stabilized by two hydrogen bonds between main-chain atoms and forms a tight hairpin-like turn; and (iii) in the oxidized BM3-FMN, the amide proton of Asn-537 forms a 2.65 Å hydrogen bond with N5 atom of the isoalloxazine ring. These structural features rigidify the inner loop of BM3-FMN relative to flavodoxins. On one-electron reduction, the peptide flip is observed in flavodoxins, involving a residue, usually Gly, corresponding to Asn-537 in BM3-FMN and resulting in formation of a new hydrogen bond between protonated N5 atom of the FMN and carbonyl oxygen of the peptide (54). This is unlikely to occur in BM3-FMN. The rigidity of the inner FMN-binding loop and the associated greater energetic cost in conformational adjustments as a function of redox state seem to be the factors that contribute to the destabilization of the FMN sq in BM3-FMN.
Figure 4.
Stereodiagram of the active site of the FMN domain of P450BM-3 showing the FMN, the backbone of two FMN-binding loops, side chains of key residues, and solvent molecules involved in the interaction.
Redox Potential Control of Electron Flow in P450BM-3 and Microsomal P450-Dependent System.
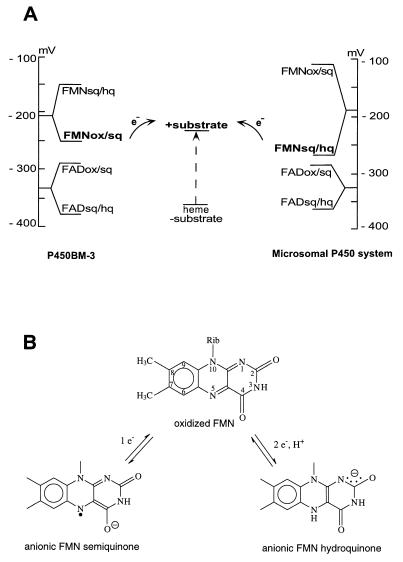
In P450BM-3, specific flavin–protein interactions evolved to modulate the redox potentials of the FMN in such a way that the flavin shuttles between the sq and fully oxidized states during catalytic turnover (Fig. 5). Using the low-potential FMN sq as an electron-donating species is the fastest and simplest way to reduce the heme iron. In the absence of substrate, the low redox potential of the heme will not allow electrons to flow to the heme iron and the catalytically inactive FMN hq will be formed, preventing the wasteful consumption of reducing equivalents and uncoupling of electron transfer from the monooxygenation reaction (51, 52). Substrate binding to the heme domain results in an increase in the heme redox potential, which allows the electron flow from the FMN sq to the heme to occur. During turnover, spatial separation of the flavins (55) and the close and precise positioning of the FMN toward the heme-binding loop further assist in repressing the formation of inactive FMN hq and securing the direct flow of electrons to the heme iron of P450BM-3. Thus, the tight coupling of the monooxygenation reaction and high turnover number in P450BM-3 (>4,000 min−1) is provided by both the redox potential control of electron flow to the heme iron and the mechanism of domain–domain interaction.
Figure 5.
Redox potential control of the electron flow in P450BM-3 and in microsomal P450-dependent system. (A) The FMN sq is the only species capable of reducing the heme iron of substrate-bound P450BM-3. In contrast, substrate-bound microsomal P450s can be reduced only by the FMN hq of microsomal P450 reductase. The midpoint potentials of the FAD and FMN of P450BM-3, as well as the reduction potentials for both half-reactions involving FAD, are given in ref. 52. Because the FMN sq is thermodynamically unstable and does not exist at equilibrium (25, 51), it is not possible to measure redox potentials for the FMNox/FMNsq and FMNsq/FMNhq half-reactions. Their estimates are shown, with the redox potential of the FMNox/FMNsq couple being lower than that of the substrate-bound heme domain (52). The redox potentials of the flavins of CPR are given as reported in ref. 56. (B) The chemical structures of the one- and two-electron reduced FMN moieties that reduce P450BM-3 and microsomal P450s, respectively, as discussed in A.
Microsomal CPR has evolved as a component of a multienzyme system, where it recognizes and reduces different P450 isoforms. Because microsomal P450s and CPR are structural and functional analogs to the heme and reductase domains of P450BM-3, they are likely to form a complex similar to what we have observed in P450BM-3. However, in oxidized CPR, the two flavin cofactors are only 3.5 Å apart, with the methyl groups of the FMN oriented toward the FAD (16). Thus, a structural rearrangement between the flavin domains must occur to make the FMN accessible for P450. The presence of a flexible hinge between the flavin domains could allow back-and-forth motions of CPR-FMN on its reduction and oxidation by P450. The conservation of the flavodoxin-like FMN-binding site in CPR serves a dual purpose in the intermolecular complex formation. First, CPR utilizes the FMN hq to reduce P450 (Fig. 5) (56). Delayed formation of the FMN hq in the redox cycle of CPR increases, to some extent, the probability of electron transfer to P450 because there will be more time for two redox partners to interact. Second, in the bimolecular reaction between CPR and P450, a strong negative potential on the surface around the FMN (Fig. 3B) facilitates complex formation. In self-sufficient P450BM-3, the covalent linker between the heme and reductase domains aids in the recognition between redox partners and abolishes the need for a strong electrostatic attraction. Taking into account that the FMN accepts electrons from the FAD most likely via methyl group edge of the isoalloxazine ring, some movements of the FMN domain during the catalytic cycle will be necessary to make the methyl group(s) accessible for the FAD.
Acknowledgments
We thank C. S. Raman for helpful discussions and Stanford Synchrotron Research Laboratories for the use of data collection facilities. H.Z. thanks J. Deisenhofer for his support. This work was supported by National Institutes of Health Grants 5T32 CA09054 (I.F.S.), GM33688 (T.L.P.), GM42614 (T.L.P.), GM50858 (J.A.P.), and GM43479 (J.A.P.) and the Howard Hughes Medical Institute (H.Z.).
ABBREVIATIONS
- P450BM-3
the soluble P450 isolated from Bacillus megaterium (the product of the CYP102 gene)
- BMP
the recombinantly expressed heme domain of P450BM-3
- BMP/FMN
the recombinantly expressed heme- and FMN-binding domain of P450BM-3
- FMN domain or BM3-FMN
the recombinantly expressed FMN-binding domain of P450BM-3
- FMN sq
one-electron reduced FMN semiquinone
- FMN hq
two-electron reduced FMN hydroquinone
- CPR
NADPH-cytochrome P450 reductase
- CPR-FMN
the FMN-binding domain of CPR
Footnotes
Data deposition: The atomic coordinates reported in this paper have been deposited in the Protein Data Bank, Biology Department, Brookhaven National Laboratory, Upton, NY 11973 (ID code 1BVY).
References
- 1.Nelson D R, Kamataki T, Waxman D, Guengerich F P, Estabrook R W, Feyereisen R, Gonzalez F J, Coon M J, Gunsalus I C, Gotoh O, et al. DNA Cell Biol. 1993;12:1–51. doi: 10.1089/dna.1993.12.1. [DOI] [PubMed] [Google Scholar]
- 2.Guengerich F P. J Biol Chem. 1991;266:10019–1022. [PubMed] [Google Scholar]
- 3.Porter T D, Coon M J. J Biol Chem. 1991;266:13469–13472. [PubMed] [Google Scholar]
- 4.Hintz M J, Peterson J A. J Biol Chem. 1981;256:6721–6728. [PubMed] [Google Scholar]
- 5.Bernhard R, Makower A, Janig G-R, Ruckpaul K. Biochim Biophys Acta. 1984;785:186–190. doi: 10.1016/0167-4838(84)90143-2. [DOI] [PubMed] [Google Scholar]
- 6.Nadler S G, Strobel H W. Arch Biochem Biophys. 1988;261:418–429. doi: 10.1016/0003-9861(88)90358-x. [DOI] [PubMed] [Google Scholar]
- 7.Stayton P S, Fisher M T, Sligar S G. J Biol Chem. 1988;263:13544–13548. [PubMed] [Google Scholar]
- 8.Voznesensky A I, Schenkman J B. J Biol Chem. 1992;267:14669–14676. [PubMed] [Google Scholar]
- 9.Shen S, Strobel H W. Arch Biochem Biophys. 1993;304:257–265. doi: 10.1006/abbi.1993.1347. [DOI] [PubMed] [Google Scholar]
- 10.Poulos T L, Finzel B C, Gunsalus I C, Wagner G C, Kraut J. J Biol Chem. 1985;260:16122–16130. [PubMed] [Google Scholar]
- 11.Ravichandran K G, Boddupalli S S, Hasemann C A, Peterson J A, Deisenhofer J. Science. 1993;261:731–736. doi: 10.1126/science.8342039. [DOI] [PubMed] [Google Scholar]
- 12.Hasemann C A, Ravichandran K G, Peterson J A, Deisenhofer J. J Mol Biol. 1994;236:1169–1185. doi: 10.1016/0022-2836(94)90019-1. [DOI] [PubMed] [Google Scholar]
- 13.Cupp-Vickery J R, Poulos T L. Nat Struct Biol. 1995;2:144–153. doi: 10.1038/nsb0295-144. [DOI] [PubMed] [Google Scholar]
- 14.Pochapsky T C, Ye X M, Ratnaswamy G, Lyons T A. Biochemistry. 1994;33:6424–6432. doi: 10.1021/bi00187a006. [DOI] [PubMed] [Google Scholar]
- 15.Müller A, Müller J J, Muller Y A, Uhlmann H, Bernhardt R, Heinemann U. Structure. 1998;6:269–280. doi: 10.1016/s0969-2126(98)00031-8. [DOI] [PubMed] [Google Scholar]
- 16.Wang M, Roberts D L, Paschke R, Shea T M, Masters B S, Kim J J. Proc Natl Acad Sci USA. 1997;94:8411–8416. doi: 10.1073/pnas.94.16.8411. [DOI] [PMC free article] [PubMed] [Google Scholar]
- 17.Nahri L O, Fulco A J. J Biol Chem. 1986;261:7160–7169. [PubMed] [Google Scholar]
- 18.Ruettinger R T, Wen L P, Fulco A J. J Biol Chem. 1989;264:10987–10995. [PubMed] [Google Scholar]
- 19.Li H Y, Darwish K, Poulos T L. J Biol Chem. 1991;266:11909–11914. [PubMed] [Google Scholar]
- 20.Oster T, Boddupalli S S, Peterson J A. J Biol Chem. 1991;266:22718–22725. [PubMed] [Google Scholar]
- 21.Boddupalli S S, Oster T, Estabrook R W, Peterson J A. J Biol Chem. 1992;267:10375–10380. [PubMed] [Google Scholar]
- 22.Sevrioukova I F, Truan G, Peterson J A. Biochemistry. 1996;35:7528–7535. doi: 10.1021/bi960330p. [DOI] [PubMed] [Google Scholar]
- 23.Govindaraj S, Poulos T L. J Biol Chem. 1997;272:7915–7921. doi: 10.1074/jbc.272.12.7915. [DOI] [PubMed] [Google Scholar]
- 24.Hazzard J T, Govindaraj S, Poulos T L, Tollin G. J Biol Chem. 1997;272:7922–7926. doi: 10.1074/jbc.272.12.7922. [DOI] [PubMed] [Google Scholar]
- 25.Sevrioukova I F, Truan G, Peterson J A. Arch Biochem Biophys. 1997;340:231–238. doi: 10.1006/abbi.1997.9895. [DOI] [PubMed] [Google Scholar]
- 26.Otwinowski Z, Minor W. Methods Enzymol. 1997;276:307–326. doi: 10.1016/S0076-6879(97)76066-X. [DOI] [PubMed] [Google Scholar]
- 27.Brünger A T. x-plor Manual. New Haven, CT: Yale Univ. Press; 1992. , Version 3.0. [Google Scholar]
- 28.Sheldrick G M, Schneider T R. Methods Enzymol. 1997;277:319–343. [PubMed] [Google Scholar]
- 29.Watt W, Tulinsky A, Swenson R P, Watenpaugh K D. J Mol Biol. 1991;218:195–208. doi: 10.1016/0022-2836(91)90884-9. [DOI] [PubMed] [Google Scholar]
- 30.Collaborative Computational Project 4. Acta Crystallogr D. 1994;50:760–763. [Google Scholar]
- 31.Jones T A. Methods Enzymol. 1985;115:157–171. doi: 10.1016/0076-6879(85)15014-7. [DOI] [PubMed] [Google Scholar]
- 32.Li H, Poulos T L. Acta Crystallogr D. 1995;51:21–32. doi: 10.1107/S0907444994009194. [DOI] [PubMed] [Google Scholar]
- 33.Li H, Poulos T L. Nat Struct Biol. 1997;4:140–146. doi: 10.1038/nsb0297-140. [DOI] [PubMed] [Google Scholar]
- 34.Porter T D, Kasper C B. Proc Natl Acad Sci USA. 1985;82:973–977. doi: 10.1073/pnas.82.4.973. [DOI] [PMC free article] [PubMed] [Google Scholar]
- 35.Porter T D. Trends Biochem Sci. 1991;16:154–158. doi: 10.1016/0968-0004(91)90059-5. [DOI] [PubMed] [Google Scholar]
- 36.Klein M L, Fulco A J. J Biol Chem. 1993;268:7553–7561. [PubMed] [Google Scholar]
- 37.Stayton P S, Poulos T L, Sligar S G. Biochemistry. 1989;28:8201–8205. doi: 10.1021/bi00446a035. [DOI] [PubMed] [Google Scholar]
- 38.Hasemann C A, Kurumbail R G, Boddupalli S S, Peterson J A, Deisenhofer J. Structure. 1995;3:41–62. doi: 10.1016/s0969-2126(01)00134-4. [DOI] [PubMed] [Google Scholar]
- 39.Stayton P S, Sligar S G. Biochemistry. 1990;29:7381–7386. doi: 10.1021/bi00484a005. [DOI] [PubMed] [Google Scholar]
- 40.Shimizu T, Tateishi T, Hatano M, Fujii-Kuriyama Y. J Biol Chem. 1991;266:3372–3375. [PubMed] [Google Scholar]
- 41.Wada A, Waterman M R. J Biol Chem. 1992;267:22877–22882. [PubMed] [Google Scholar]
- 42.Bridges A, Gruenke L, Chang Y T, Vakser I A, Loew G, Waskell L. J Biol Chem. 1998;273:17036–17049. doi: 10.1074/jbc.273.27.17036. [DOI] [PubMed] [Google Scholar]
- 43.Matthew J B, Weber P C, Salemme F R, Richards F M. Nature (London) 1983;301:169–171. doi: 10.1038/301169a0. [DOI] [PubMed] [Google Scholar]
- 44.Weber P C, Tollin G. J Biol Chem. 1985;260:5568–5573. [PubMed] [Google Scholar]
- 45.Jenkins C M, Genzor C G, Fillat M F, Waterman M R, Gómez-Moreno C. J Biol Chem. 1997;272:22509–22513. doi: 10.1074/jbc.272.36.22509. [DOI] [PubMed] [Google Scholar]
- 46.Feng Y, Swenson R P. Biochemistry. 1997;36:13617–13628. doi: 10.1021/bi971576c. [DOI] [PubMed] [Google Scholar]
- 47.Swenson R P, Krey G D. Biochemistry. 1994;33:8505–8514. doi: 10.1021/bi00194a015. [DOI] [PubMed] [Google Scholar]
- 48.Zhou Z, Swenson R P. Biochemistry. 1995;34:3183–3192. doi: 10.1021/bi00010a007. [DOI] [PubMed] [Google Scholar]
- 49.Zhou Z, Swenson R P. Biochemistry. 1996;35:15980–15988. doi: 10.1021/bi962124n. [DOI] [PubMed] [Google Scholar]
- 50.Mayhew S G, Tollin G. In: Chemistry and Biochemistry of Flavoenzymes. Müller F, editor. Vol. 3. Boca Raton, FL: CRC; 1992. pp. 389–426. [Google Scholar]
- 51.Sevrioukova I F, Shaffer C, Ballou D P, Peterson J A. Biochemistry. 1996;35:7058–7068. doi: 10.1021/bi960060a. [DOI] [PubMed] [Google Scholar]
- 52.Daff S N, Chapman S K, Turner K L, Holt R A, Govindaraj S, Poulos T L, Munro A W. Biochemistry. 1997;36:13816–13823. doi: 10.1021/bi971085s. [DOI] [PubMed] [Google Scholar]
- 53.Chang F C, Swenson R P. Biochemistry. 1997;36:9013–9021. doi: 10.1021/bi970783+. [DOI] [PubMed] [Google Scholar]
- 54.Ludwig M L, Pattridge K A, Metzger A L, Dixon M M, Eren M, Feng Y, Swenson R P. Biochemistry. 1997;36:1259–1280. doi: 10.1021/bi962180o. [DOI] [PubMed] [Google Scholar]
- 55.Sevrioukova I F, Peterson J A. Biochimie. 1996;78:744–751. doi: 10.1016/s0300-9084(97)82532-1. [DOI] [PubMed] [Google Scholar]
- 56.Vermilion J L, Ballou D P, Massey V, Coon M J. J Biol Chem. 1981;256:266–277. [PubMed] [Google Scholar]
- 57.Nicholls A, Honig B. garsp: Graphical Representation and Analysis of Surface Properties. New York: Columbia University; 1993. [Google Scholar]


