Abstract
Background and Objectives
Clinical trials increasingly use results of diagnostic tests as surrogate outcomes. Our objective was to answer the following questions: (1) is the parameter measured by the reference standard a valid surrogate? (2) How does the tests accuracy influence the estimate of the treatment benefit on surrogate? (3) Is it possible to correct the measured treatment effect given by results of inaccurate tests?
Methods and Setting
We reviewed the literature on asymptomatic deep venous thrombosis (DVT), detected by the reference standard and other imaging techniques, as surrogate for venous thromboembolism. The influence of test inaccuracy on the measurement of treatment benefit was calculated as a function of the patient baseline risk, the treatment effect model, and test performances.
Results
We show that: (1) asymptomatic DVT is correlated with clinical outcomes but is yet to be established as a surrogate; (2) inaccurate diagnostic test underestimates the treatment effect on surrogate; (3) the prevalence of the disease, the treatment effect model, and the accuracy of the test and the reference standard used to evaluate it need to be known to correct this underestimation.
Conclusion
Even when the surrogate end point is valid, without a reliable study of the diagnostic test we cannot quantify the true treatment effect.
Keywords: Diagnosis, Sensitivity and specificity, Clinical trials, Biologic markers, Surrogate end points, Venous thrombosis
1. Introduction
In the realm of clinical trials, diagnostic tests present an interesting alternative as generators of surrogates for more relevant clinical end points. New, less-invasive, diagnostic tests are used to evaluate biologic or anatomic markers as a surrogate for clinical end points. The theoretical bases of and practical recommendations for validation of surrogate end points have been reported [1-4]. As a proxy for the clinical end point, a surrogate should meet certain major criteria: (1) it should have a well-established relationship with clinical end points [5]; (2) from its changes induced by the treatment, it should be possible to derive an estimate of patient’s benefit (prediction criterion) [1]; (3) the treatment effect on the clinical outcome must be entirely explained by the treatment effect on the surrogate (the capture criterion); (4) the estimate of the clinical benefit based on the effect of the treatment on the surrogate must be independent from the nature of the treatment. The complexity of drug pharmacokinetics and pharmacodynamics and lack of reliable pathophysiologic and therapeutic models, however, make the validation of a surrogate difficult [6]. Notably, the use of nonvalidated surrogates in clinical trials has led to unexpected results, with instances where new therapies are eventually found harmful for patients [7].
Although attention has been paid to the evaluation and validation of biomarkers as surrogates for clinical events, the use of diagnostic tests results as surrogates has not been characterized.
We explored the use of asymptomatic deep venous thrombosis (DVT) after total hip replacement (THR), as a surrogate for clinical venous thromboembolism (VTE). The ultimate therapeutic objective of VTE prophylaxis is to prevent the occurrence of clinical VTE, that is, symptomatic fatal and nonfatal pulmonary embolism (PE), sudden death caused by PE, symptomatic DVT, or the eventual development of postthrombotic syndrome [8].
However, because of the low rate of clinical events after THR [9-12], particularly PE, no trial has been designed to show the reduction of clinical VTE with concomitant systematic evaluation of asymptomatic DVT. Warwick et al. [9] calculated that 28,000 patients would be necessary “to show halving of the fatal PE rate from 0.34 to 0.17% at the 95% significance level with 80% power.”
The low rate of clinical VTE and the potential causal relationship between asymptomatic DVT and PE are the main reasons for using asymptomatic DVTs as a surrogate end point for clinical VTE [13]. Venography [14] is generally accepted as the reference standard in detecting asymptomatic DVTs in clinical trials [15], although it has not been properly evaluated in this role because of the absence of a true reference. Venography allows the direct visualization of the veins from the calf to vena cava after opacification by contrast media. Nevertheless, venography presents several limitations: pain; induction of DVTs in up to 2%; general reliability [16-20]; and lack of reliability in special cases because of patient contraindication, patient refusal, or technical reasons [8,21]. Because of these limitations, regulatory directives accept that noninvasive diagnostic tests like ultrasound replace venography when “their relevance—especially their specificity—is justified” [15]. In this article, we assume that venography is a perfect reference standard and consider the following questions: (1) is asymptomatic DVT detected by the reference standard, that is, venography a valid surrogate for clinical venous thromboembolism? (2) How does the performance of an imperfect diagnostic test, that is, I-Fibrinogen scanning or ultrasonography influence the estimate of the treatment benefit on surrogate outcome? (3) Is it possible to correct the estimate of the treatment effect given by results of imperfect diagnostic tests to obtain the true treatment effect on surrogate end points?
2. Method
We reviewed the literature to verify whether asymptomatic DVT satisfies the three requirements of an established surrogate mentioned earlier.
To evaluate the influence of diagnostic inaccuracy on the measurement of treatment benefit, we calculated the treatment benefit as a function of the baseline risk, the treatment effect model, and test performance. Diagnostic test inaccuracy leads to nondifferential misclassification of disease in clinical trials. Nondifferential misclassification, a well-known phenomenon in epidemiology [22], biases the estimated treatment effect towards the null. The probability of experiencing a positive test in the control group of a clinical trial that utilizes a diagnostic test is: r0=(TP + FP)/N=(prev × se + ((1-prev)(1-sp))), where r0 is the risk in the control group, prev the prevalence of the disease, TP the number of True Positive, FP the number of False Positive, se and sp sensitivity and specificity of the test, and N the total number of subject in the control group.
In the treated group, the probability of having an event is reduced by a constant proportion θ in the multiplicative [r1 (m)] or a constant amount reduction θ in the additive model [r1(a)]: r1(m) = prev × θ se + (1 - θ prev)(1 - sp) r1(a) = (prev-θ) se + (1-(prev-θ))(1-sp)
The relative risk is obtained from:
Misclassifications can also occur when new tests are evaluated against imperfect reference standards. When both tests are evaluated in the same population, the baseline risk is obtained from: r0 = (prev (se1 × se2) + ((1-prev)(1-sp1)(1-sp2))), where se1 and sp1 are sensitivity and specificity of the reference standard and se2 and sp2 are true sensitivity and specificity of the new test [23]. When errors between the new and the reference tests are correlated (occur in the same patients) the baseline risk is obtained from: r0=(prev ((se1 × se2 + eb) + ((1-prev)((1-sp1)(1-sp2) + ea)), where eb is the covariance between the two tests when the true diagnosis is positive and ea is the covariance between the two tests when the true diagnosis is negative [24].
To find out whether true treatment effect could be measured after adjustment for test inaccuracy, we assessed the literature on the methodologic aspects of diagnostic test evaluation, with an emphasis on imaging techniques used for the diagnosis of asymptomatic DVT in clinical trials.
3. Results
3.1. Is asymptomatic DVT detected by the reference standard, that is, venography a valid surrogate for clinical venous thromboembolism?
3.1.1. Correlation between asymptomatic DVT and clinical VTE
Two early studies, one based solely on venography [25] and the other on I-Fibrinogen scanning and symptomatic DVT (with positive cases confirmed by venography) [26], have shown that after surgery most asymptomatic DVTs: (1) develop in the calf; (2) about 50% resolve spontaneously; and (3) rarely become symptomatic or lead to PE when limited to the calf region [26,27]. Studies on autopsy series, however, have reported that 13% of fatal PEs were associated with DVTs limited to the calf [28].
In one of these early studies performed after surgery [26], extension of thrombi to proximal veins in 9 out of 40 patients subsequently led to four cases of PE. A recent meta-analysis of seven [29] observational studies published from 1983 to 1997, including 457 patients with suspected or confirmed PE found that the rate of asymptomatic DVT was higher in angiography-proven PE [36% (22, 52%)] than in patients without PE [7% (3, 16%)] [29]. The asymptomatic DVT in these reports were diagnosed by plethysmography in one and ultrasonography in six studies.
There are no specific reports on the relationship between asymptomatic DVT and VTE after THR. We know, however, that in orthopedic surgery, the incidence of DVT systematically screened by venography ranges between 50 and 60% [30]. One study with 49.7 months follow-up of 51 patients after THR or knee replacement was inconclusive on whether patients with asymptomatic DVT were more likely to have symptomatic DVTs [31]. Nevertheless, clinical trials and observational studies have shown that patients with asymptomatic venous thrombosis in proximal veins are clearly at higher risk to develop clinical VTE [26,32-37].
Thus, there is a clear hemodynamic potential and a correlation between asymptomatic DVTs and subsequent clinical VTE but their causal relationship is yet to be confirmed. Notably, observational studies and clinical trials that have evaluated this relationship have not always used the reference standard technique to detect asymptomatic DVTs.
3.1.2. Treatment effect on asymptomatic DVT and VTE
Two systematic reviews have evaluated the role of Heparin and antiplatelet agents in preventing VTE after elective orthopedic surgery [35,36] and 30 randomized controlled trials have used low molecular weight heparin (LMWH) to prevent DVT after THR [30].
These studies have shown that:
The risk of asymptomatic DVT mainly detected by I-Fibrinogen scanning was lower in patients treated by Heparin [relative risk (RR) 0.44 (0.30, 0.64-75%)]. The risk of PE was reduced in all surgery. In orthopedic elective surgery results were nonconclusive, probably because the study lacks power [RR 1.2 (0.70, 2.1)], as no heterogeneity was detected between this and other subgroups [35].
Antiplatelet therapies decrease the risk of asymptomatic DVT detected by I-Fibrinogen scanning or venography [RR 0.80 (0.71, 0.92)] and tend to decrease the risk of PE [RR 0.74 (0.39, 1.39)] according to the antiplatelet trialists’collaboration [36]. With aspirin, the RR is 0.73 (0.59, 0.91) for DVT and 0.56 (0.23, 1.4) for PE. The differential effect on DVT and PE suggests that antiplatelets, and aspirin, might have a different efficacy on DVT and PE.
Only one clinical outcome study has compared in-hospital thromboprophylaxis by LMWH to Heparin after THR [38]. The risk of VTE was lower [RR 0.23 (0.08, 0.69)] in patients treated by LMWH during hospitalization. This risk reduction was significantly more important for DVT [RR 0.13 (0.03, 0.57)] compared to PE [RR 0.49 (0.04, 5.4)]. After 3 months follow-up the RR of VTE was 0.97 (0.67, 1.40). The risk of asymptomatic DVT is lower while on LMWH than with unfractionated heparin or placebo. The risk of developing an asymptomatic DVT while on LMWH is 27% less than with unfractionated heparin [RR 0.73 (0.58, 0.92)] and 54% less than with placebo [RR 0.46 (0.34, 0.61)].
Seven studies have evaluated the role of post discharge (up to 3 months) thromboprophylaxis after THR. Patients with negative venography at discharge have been treated randomly by LMWH, unfractionnated heparin, or placebo. LMWH or heparin seem to reduce asymptomatic DVT [RR 0.38 (0.25, 0.56)] and symptomatic VTE [RR 0.38 (0.24-0.61)] [39-41]. When two of these studies that have independently assessed symptomatic VTE from results of venography to avoid its overdiagnosis [42] are considered, RR tend to be decreased [RR 0.41 (0.14, 1.2)].
3.1.3. Estimate of clinical benefit on VTE from reduction of asymptomatic DVT
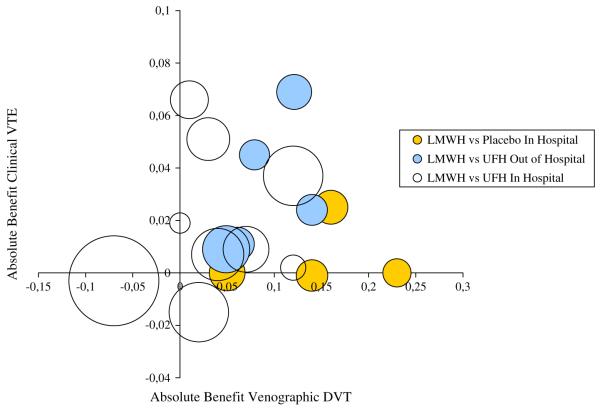
According to the capture principle, if asymptomatic DVT is a good surrogate for VTE, the entire clinical risk reduction of VTE observed in clinical trials should be explained by the treatment benefit on asymptomatic DVT [4]. To evaluate if the capture principle holds, clinical trials must be specifically designed to measure both clinical and surrogate outcomes. We are not aware of any studies specifically designed to evaluate both asymptomatic and clinical VTE. The clinical benefit could be indirectly evaluated, however, from the results of 13 in-hospital and 6 out-of-hospital thromboprophylaxis studies that reported both venographic and clinical outcomes. It should be pointed out that only two of the out-of-hospital studies have been designed to evaluate symptomatic VTE independently from results of venography. Therefore, most of these studies have potentially overstated the occurrence of clinical outcomes in patients with positive ultrasound or venography. The overdiagnosis of symptomatic VTE has been shown empirically in out-of-hospital studies [42].Figure 1 shows the scatter of absolute benefits (risk differences between treated and control groups) on asymptomatic DVT and clinical VTE for each study. The clinical benefit (weighted by the variance) seems to be correlated to venographic DVT in out-of-hospital studies (r = 0.5, P-value = .49). Nevertheless, the small number of studies in each category does not facilitate any clear conclusions, and from these data it is not possible to derive a precise estimate of the clinical benefit of thromboprophylaxis from the estimate of the treatment effect on DVT.
Fig. 1.
Risk differences of venographic DVT and clinical VTE measured by 29 randomized controlled trials; area of each study is proportional to the number of patients.
3.2. How does the performance of an imperfect diagnostic test, that is, I-Fibrinogen scanning or ultrasonography influence the estimate of the treatment benefit on surrogate outcome?
Nondifferential misclassification is a well-known phenomenon in epidemiology leading to systematic underestimation of treatment benefit [22]. An empirical example of the underestimation of treatment effect by I-Fibrinogen scanning compared to venography has been shown by Rodgers [43]. Ultrasonography has been recently used in clinical trials but is not yet generalized for detecting asymptomatic DVTs without confirmatory venography [44].
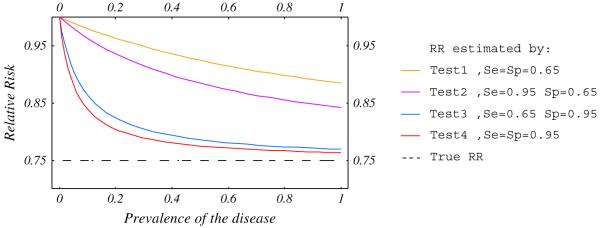
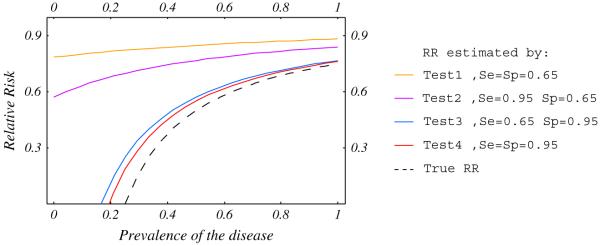
To fully understand how diagnostic test accuracy influences the measured treatment effect we modeled their relationship and examined four categories of tests: Test 1, poorly sensitive and specific (0.65); Test 2, highly sensitive (0.95) and poorly specific (0.65); Test 3, highly specific (0.95) and poorly sensitive (0.65) and test 4, highly sensitive and specific (0.95). The treatment effect could be multiplicative, where the RR is constant, or additive, where the risk difference is constant, regardless of the baseline risk [45]. Figures 2 and 3 show that in high risk patients, the RRs measured by accurate (Test 4) and highly specific (Test 3) tests are close to the “true RR” (dashed line). In low-risk patients the RR is dramatically under-estimated regardless of the diagnostic accuracy.
Fig. 2.
Relative risk estimated by diagnostic test as a function of baseline risk for RR = 0.75.
Fig. 3.
Relative risk estimated by diagnostic test as a function of baseline risk for a risk difference = 0.25.
These simulations show that (1) poorly performing tests underestimate the treatment effect, that is, LMWH is better than we think it is; (2) with low baseline risk the bias might be severe even with a good quality test, that is, venography might underestimate the benefit in low risk patients; (3) sensitivity, and to a greater extent specificity, influence the accuracy of relationship between test results and clinical outcome.
3.3. Is it possible to correct the estimate of the treatment effect given by results of imperfect diagnostic tests to obtain the true treatment effect on surrogate end points?
Because the accuracy of a diagnostic test influences the evaluation of treatment benefit, the knowledge of test performance is of the utmost importance when assessing a potential surrogate. The evaluation of diagnostic tests suffers from two major shortcomings: variability of accuracy indices, and the absence of reliable original studies.
3.3.1. Variability of diagnostic accuracy indices
For a fixed cutoff point, sensitivity and specificity of a test are generally considered to be intrinsic properties and constant. Empirical data, however, has challenged this belief.
Choi [46] has shown that according to causal modeling, three types of tests can be defined: (1) diagnostic tests: a disease leads to, or increases the probability of a positive test; (2) predictive test: a positive test indicates a condition or risk factor that will lead to or increase the probability of a disease; and (3) correlational test: disease and test are noncausally related and are both related to some underlying causal factor.
Only in the first case are sensitivity and specificity invariable, but we do not (or rarely) have such tests in medical practice. In predictive tests only the predictive value is constant and in correlational tests all indices vary.
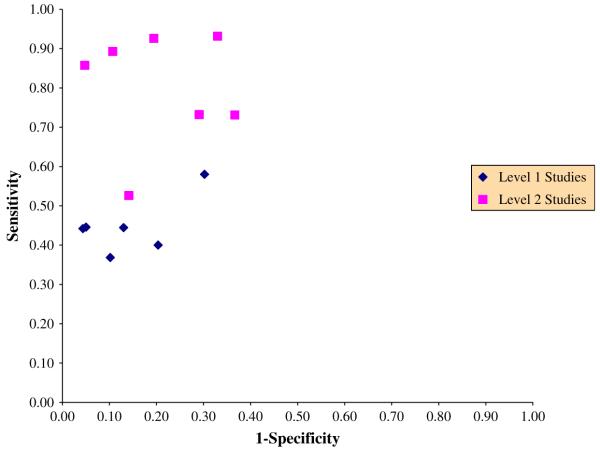
Figure 4 shows 13 studies evaluating the accuracy of I-Fibrinogen scanning compared to venography in post orthopedic surgery [47]. Level 1 studies, with blind evaluation of the two techniques, absence of verification bias, and consecutive enrollment of patients limit potential for bias. A large amount of variability is observed even within each group of studies.
Fig. 4.
Estimated sensitivity and 1-Specificity of I-Fibrinogen scanning compared to venography in postorthopedic surgery.
Furthermore, variability of sensitivity and specificity has been described in multiple clinical settings, between and within patient populations [48,49]. Even if some of this variability is explained by the variation in disease prevalence caused by, for example, referral pattern [50-52], it has been argued that the variation of these indices across the same patient subgroups preclude defining a single sensitivity or specificity for any particular group of patients [48]. As a result, receiver operating characteristic curves (ROC), area under the ROC, and logistic modeling with covariates that might influence test results have been proposed to calculate accuracy indices, because they are less sensitive to referral bias and threshold variations [48,53]. Mulherin et al. [54] proposed that investigators should discuss patient characteristics that might influence the accuracy of diagnostic tests while in the study design phase, and report the estimates of diagnostic accuracy for each subgroup. This approach is problematic because we rarely know mechanisms of disease or characteristics of patients that might influence the disease course a priori. Finally, to make results of studies of diagnostic tests more transferable, Irwig et al. [55] have identified questions to be considered when designing a study.
3.3.2. Lack of reliable studies of diagnostic tests
An evaluation of diagnostic test accuracy reports [56] and results of meta-analyses have contributed to show the low quality of diagnostic test studies. Design-related bias produced by these “low-quality” studies has also been shown empirically [57]. Nonetheless, because more attention has been paid in recent years to the evaluation of diagnostic tests and their report [58-60], the quality of primary studies is expected to improve.
As shown in Fig. 4, 6 out of 13 studies evaluating I-Fibrinogen scanning have minimized potential for bias. Level 2 studies clearly overstate the accuracy with a large variability of specificities and sensitivities. In Level 1 studies, sensitivities appear homogeneous (mean sensitivity 0.45 (0.43, 0.47), P-value for heterogeneity = .47). When large variability is observed between sensitivities or specificities, summary results should use methods to account for threshold variations and differences in patient characteristics, such as with a summary ROC method [61]. A pooled diagnostic odds ratio (DOR) can be calculated from these methods. The DOR is a single indicator of diagnostic accuracy,
it exceeds 1 when the test is more often positive in patients with the disease. When we consider I-Fibrinogen scanning, the DOR is 1.51 (0.54, 4.2) in Level 1 and 21.9 (7.6, 63) in Level 2 studies. The DOR cannot be used directly to calculate the probability of disease from a test result. It is only used to state a summary estimate of specificity for a given sensitivity and vice versa. In Level 1 studies, the variation in the cutoff to rate I-Fibrinogen scanning as positive does not appear to explain the observed heterogeneity. Therefore, other study or patient features might influence the accuracy and should be explored. As mentioned previously, the specificity is more important than the sensitivity in the underestimation of RR. Figure 3 shows that even in Level 1 studies, specificities are highly variable (70-96%, P-value of heterogeneity <.001) compared to the sensitivities (37-58%, P-value = .47) and one can hardly summarize these heterogeneous results.
3.3.3. The reference standard problem
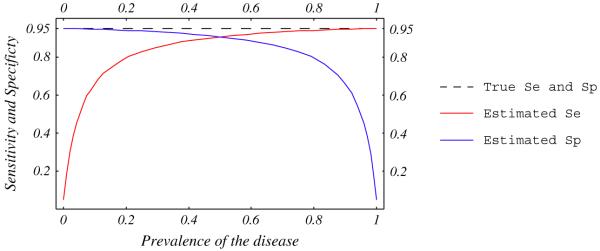
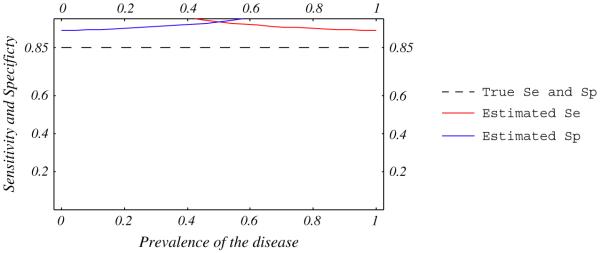
To evaluate a new test, its accuracy is generally compared to a reference test that is supposed to reliably establish the disease status. Reference tests are, however, often imperfect, leading to misclassifications. The bias introduced by this misclassification depends on the prevalence of the disease and the correlation between errors in new and reference tests [62,63]. Errors in two tests are independent when they do not occur in the same patients, and are correlated when both tests misclassify the same patients. Figures 5 and 6 show that the observed sensitivity and specificity of a new test compared to an imperfect reference is underestimated when errors are independent, and could be over- or underestimated when errors are correlated [23,62,63].
Fig. 5.
Estimated sensitivity and specificity of a test compared with an imperfect reference standard. True sensitivity and specificity of the test (dashed line) and the imperfect reference standard are 95%. Errors between tests are independent.
Fig. 6.
Estimated sensitivity and specificity of a test compared with an imperfect reference standard. True sensitivity and specificity of the test (dashed line) and the imperfect reference standard are 85 and 95%. Ten percent of ill patients are negative and 10% of well patients are positive with both tests.
When the accuracy of the reference standard and relationship between errors in both tests are known, the correction for this bias is straightforward. Accuracies of reference tests are, however, generally unknown. For example, the reference standard for the diagnosis of DVT is venography. This technique is invasive, painful, only moderately reliable with kappa ranging from 0.57 to 0.90 [16-20], presents some risk of complication, is not feasible in all patients [8], and has not been evaluated for accuracy. Several methods to correct estimates of test accuracy without knowing the true accuracy of the reference standard, in the absence of correlation between errors, have been reported [64]. Methods to correct for bias when errors are correlated have yet to be developed.
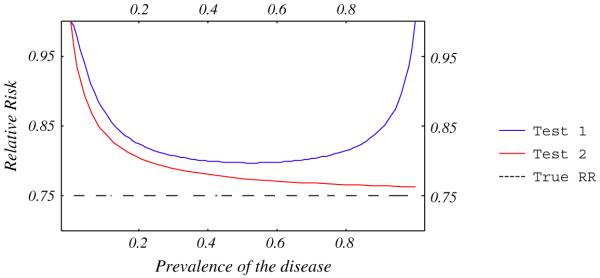
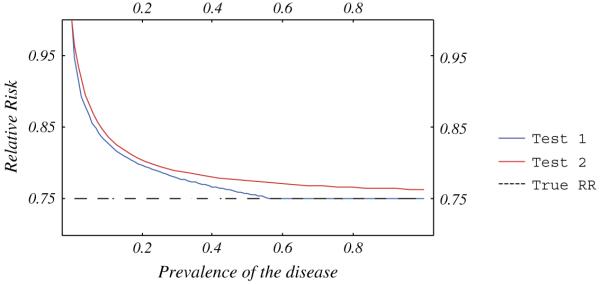
A diagnostic test that has been evaluated against an imperfect reference (Test 1, Fig. 7), systematically underestimates the RR compared to a test evaluated against a perfect reference (Test 2, Fig. 7). Figure 7 also shows that the RR estimated by Test 1 is highly influenced by extreme prevalences. Figure 8 shows that when errors occur in 10% of ill and 10% of well patients with both tests, Test 1 underestimates the RR less than Test 2, and is only sensitive to low prevalences.
Fig. 7.
Relative risk estimated by two tests with sensitivity and specificity = 95%. Accuracy of Test 2 has been compared to a perfect reference standard and Test 1 to an imperfect standard with sensitivity and specificity = 95%. Errors are independent between new and reference tests.
Fig. 8.
Relative risk estimated by two tests. Accuracy of Test 2 (sensitivity and specificity = 85%) has been compared to a perfect reference standard and Test 1 to an imperfect standard with sensitivity and specificity = 95%. Ten percent of ill patients are negative and 10% of well patients are positive with both tests.
4. Conclusion
From the literature that we reviewed, asymptomatic DVT appears to be a useful intermediary outcome, correlated with clinical VTE. Moreover, the treatment effect on the clinical VTE seems to be in the same direction than the treatment effect on asymptomatic DVT. Even if asymptomatic DVT is a valid surrogate for VTE, however, the inaccuracy of the test used for its diagnosis, bias the measured treatment benefit. Nondifferential misclassification has not been a source of concern, because the treatment benefit is systematically underestimated, leading to a conservative estimate of treatment effect [22]. It has been pointed out, however, that such misclassification is a serious problem because “the bias it introduces may account for certain discrepancies among epidemiologic studies,” “in interpreting studies that seems to indicate the absence of an effect” [22], and also, to derive an estimate of patient’s benefit [1].
The underestimation of the true treatment benefit is a function of the accuracy of the test, the baseline risk of the disease, and the nature of the treatment effect. Therefore, to quantify the underestimation, the prevalence of the disease, the treatment effect model of the tested intervention (multiplicative or additive), and the accuracy of the diagnostic test should be known. Nonetheless, the difficulty inherent in the evaluation of diagnostic tests and lack of reliable studies make any adjustment impossible. Systematic review of diagnostic tests could gainfully be used to evaluate the quality and summarize the accuracy of potentially unbiased studies with appropriate meta-analytic methods [65]. Unfortunately, as shown by recent meta-analyses, most studies are potentially biased or do not report in sufficient detail patient or study features that might influence diagnostic accuracy.
Knowledge of a disease pathway is not only necessary to establish surrogate end points, but also to identify which patient and disease characteristics might potentially influence the accuracy of diagnostic tests. With new developments in improving the methodology of diagnostic research [66], and pragmatic criteria developed to overcome limitations such as the absence of perfect reference tests [67], the quality and report of original diagnostic studies are expected to improve. Until then, meta-analysis is a reliable way to study the literature on the accuracy of diagnostic tests, evaluate its quality [68], and explore heterogeneity between results of original studies [69]. Ultimately, with improvements in the quality of original studies and meta-analytic techniques, meta-analyses may help with the design of therapeutic trials which use diagnostic tests to evaluate outcomes, and make necessary corrections in quantifying the true treatment benefit [8].
Acknowledgments
We wish to specially thank Dr. Patrick Mismetti and Dr. Patrice Nony for their helpful comments.
References
- [1].Boissel JP, Collet JP, Moleur P, Haugh M. Surrogate endpoints: a basis for a rational approach. Eur J Clin Pharmacol. 1992;43(3):235–44. doi: 10.1007/BF02333016. [DOI] [PubMed] [Google Scholar]
- [2].De Gruttola VG, Clax P, DeMets DL, Downing GJ, Ellenberg SS, Friedman L, et al. Considerations in the evaluation of surrogate endpoints in clinical trials. Summary of a National Institutes of Health workshop. Controlled Clin Trials. 2001;22(5):485–502. doi: 10.1016/s0197-2456(01)00153-2. [DOI] [PubMed] [Google Scholar]
- [3].Fleming TR, Prentice RL, Pepe MS, Glidden D. Surrogate and auxiliary endpoints in clinical trials, with potential applications in cancer and AIDS research. Stat Med. 1994;13(9):955–68. doi: 10.1002/sim.4780130906. [DOI] [PubMed] [Google Scholar]
- [4].Prentice RL. Surrogate endpoints in clinical trials: definition and operational criteria. Stat Med. 1989;8(4):431–40. doi: 10.1002/sim.4780080407. [DOI] [PubMed] [Google Scholar]
- [5].Prentice C. Are symptomatic endpoints acceptable in venous thromboprophylactic studies? Haemostasis. 1998;28(Suppl S3):109–12. doi: 10.1159/000022387. [DOI] [PubMed] [Google Scholar]
- [6].Boissel JP, Perret L, Bouvenot G, Castaigne A, Gerard-Coue MJ, Maillere P, et al. Clinical evaluation: from intermediate to surrogate criteria. Therapie. 1997;52(4):281–5. [PubMed] [Google Scholar]
- [7].Fleming TR, DeMets DL. Surrogate end points in clinical trials: are we being misled? Ann Intern Med. 1996;125(7):605–13. doi: 10.7326/0003-4819-125-7-199610010-00011. [DOI] [PubMed] [Google Scholar]
- [8].Leizorovicz A, Kassai B, Becker F, Cucherat M. The assessment of deep vein thromboses for therapeutic trials. Angiology. 2003;54(1):19–24. doi: 10.1177/000331970305400103. [DOI] [PubMed] [Google Scholar]
- [9].Warwick D, Williams MH, Bannister GC. Death and thromboembolic disease after total hip replacement. A series of 1162 cases with no routine chemical prophylaxis. J Bone Joint Surg Br. 1995;77(1):6–10. [PubMed] [Google Scholar]
- [10].Murray DW, Britton AR, Bulstrode CJ. Thromboprophylaxis and death after total hip replacement. J Bone Joint Surg Br. 1996;78(6):863–70. doi: 10.1302/0301-620x78b6.6714. [DOI] [PubMed] [Google Scholar]
- [11].Fender D, Harper WM, Thompson JR, Gregg PJ. Mortality and fatal pulmonary embolism after primary total hip replacement. Results from a regional hip register. J Bone Joint Surg Br. 1997;79(6):896–9. doi: 10.1302/0301-620x.79b6.7677. [DOI] [PubMed] [Google Scholar]
- [12].Douketis JD, Eikelboom JW, Quinlan DJ, Willan AR, Crowther MA. Short-duration prophylaxis against venous thromboembolism after total hip or knee replacement: a meta-analysis of prospective studies investigating symptomatic outcomes. Arch Intern Med. 2002;162(13):1465–71. doi: 10.1001/archinte.162.13.1465. [DOI] [PubMed] [Google Scholar]
- [13].Kearon C. Natural history of venous thromboembolism. Circulation. 2003;107(23 Suppl 1):I22–30. doi: 10.1161/01.CIR.0000078464.82671.78. [DOI] [PubMed] [Google Scholar]
- [14].DeWeese J, Rogoff S. Phlebographic patterns of acute deep venous thrombosis of the leg. Surgery. 1963;53:99–108. [PubMed] [Google Scholar]
- [15].The European Agency for the Evaluation of Medicinal Products Committee for Proprietary Medicinal Products (CPMP) Point to consider on clinical investigation of medicinal prophylaxis of intra- and post-operative venous thromboembolism risk. Available at: www.emea.eu.int/pdfs/human/ewp/070798en.pdf. Accessed October 2004.
- [16].Kalodiki E, Nicolaides AN, Al-Kutoubi A, Cunningham DA, Mandalia S. How “gold” is the standard? Interobservers’ variation on venograms. Int Angiol. 1998;17(2):83–8. [PubMed] [Google Scholar]
- [17].Borris LC, Lassen MR. Venography in deep venous thrombosis: postoperative screening of patients in prophylaxis studies. Haemostasis. 1993;23(Suppl 1):80–4. doi: 10.1159/000216913. [DOI] [PubMed] [Google Scholar]
- [18].Picolet H, Leizorovicz A, Revel D, Chirossel P, Amiel M, Boissel JP. Reliability of phlebography in the assessment of venous thrombosis in a clinical trial. Haemostasis. 1990;20(6):362–7. doi: 10.1159/000216151. [DOI] [PubMed] [Google Scholar]
- [19].Wille-Jorgensen P, Borris LC, Lassen MR, Jorgensen LN, Hauch O, Nehen AM, et al. Potential influence of observer variation in thromboprophylactic trials. Haemostasis. 1992;22(4):211–5. doi: 10.1159/000216321. [DOI] [PubMed] [Google Scholar]
- [20].Mantoni M, Strandberg C, Neergaard K, Sloth C, Jorgensen PS, Thamsen H, et al. Triplex US in the diagnosis of asymptomatic deep venous thrombosis. Acta Radiol. 1997;38(2):327–31. doi: 10.1080/02841859709172073. [DOI] [PubMed] [Google Scholar]
- [21].Samama MM, Cohen AT, Darmon JY, Desjardins L, Eldor A, Janbon C, et al. Prophylaxis in Medical Patients with Enoxaparin Study Group A comparison of enoxaparin with placebo for the prevention of venous thromboembolism in acutely ill medical patients. N Engl J Med. 1999;341(11):793–800. doi: 10.1056/NEJM199909093411103. [DOI] [PubMed] [Google Scholar]
- [22].Rothman KJ, Greenland S. Precision and validity in epidemiologic studies. In: Rothman KJ, Greenland S, editors. Modern epidemiology. 2nd ed. Lippincott-Raven; Philadelphia: 1998. pp. 127–33. [Google Scholar]
- [23].Valenstein PN. Evaluating diagnostic tests with imperfect standards. Am J Clin Pathol. 1990;93(2):252–8. doi: 10.1093/ajcp/93.2.252. [DOI] [PubMed] [Google Scholar]
- [24].Vacek PM. The effect of conditional dependence on the evaluation of diagnostic tests. Biometrics. 1985;41(4):959–68. [PubMed] [Google Scholar]
- [25].Nicolaides AN, Kakkar VV, Field ES, Renney JT. The origin of deep vein thrombosis: a venographic study. Br J Radiol. 1971;44(525):653–63. doi: 10.1259/0007-1285-44-525-653. [DOI] [PubMed] [Google Scholar]
- [26].Kakkar VV, Howe CT, Flanc C, Clarke MB. Natural history of postoperative deep-vein thrombosis. Lancet. 1969;2(7614):230–2. doi: 10.1016/s0140-6736(69)90002-6. [DOI] [PubMed] [Google Scholar]
- [27].Philbrick JT, Becker DM. Calf deep venous thrombosis. A wolf in sheep’s clothing? Arch Intern Med. 1988;148(10):2131–8. [PubMed] [Google Scholar]
- [28].Atri M, Herba MJ, Reinhold C, Leclerc J, Ye S, Illescas FF, et al. Accuracy of sonography in the evaluation of calf deep vein thrombosis in both postoperative surveillance and symptomatic patients. AJR. 1996;166(6):1361–7. doi: 10.2214/ajr.166.6.8633448. [DOI] [PubMed] [Google Scholar]
- [29].van Rossum AB, van Houwelingen HC, Kieft GJ, Pattynama PM. Prevalence of deep vein thrombosis in suspected and proven pulmonary embolism: a meta-analysis. Br J Radiol. 1998;71(852):1260–5. doi: 10.1259/bjr.71.852.10318998. [DOI] [PubMed] [Google Scholar]
- [30].Geerts WH, Heit JA, Clagett GP, Pineo GF, Colwell CW, Anderson FA, Jr, et al. Prevention of venous thromboembolism. Chest. 2001;119(1 Suppl):132S–75S. doi: 10.1378/chest.119.1_suppl.132s. [DOI] [PubMed] [Google Scholar]
- [31].Francis CW, Ricotta JJ, Evarts CM, Marder VJ. Long-term clinical observations and venous functional abnormalities after asymptomatic venous thrombosis following total hip or knee arthroplasty. Clin Orthop. 1988;(232):271–8. [PubMed] [Google Scholar]
- [32].White RH, Romano PS, Zhou H, Rodrigo J, Bargar W. Incidence and time course of thromboembolic outcomes following total hip or knee arthroplasty. Arch Intern Med. 1998;158(14):1525–31. doi: 10.1001/archinte.158.14.1525. [DOI] [PubMed] [Google Scholar]
- [33].White RH, Zhou H, Romano PS. Incidence of symptomatic venous thromboembolism after different elective or urgent surgical procedures. Thromb Haemost. 2003;90(3):446–55. doi: 10.1160/TH03-03-0152. [DOI] [PubMed] [Google Scholar]
- [34].Moser KM, LeMoine JR. Is embolic risk conditioned by location of deep venous thrombosis? Ann Intern Med. 1981;94(4 pt 1):439–44. doi: 10.7326/0003-4819-94-4-439. [DOI] [PubMed] [Google Scholar]
- [35].Collins R, Scrimgeour A, Yusuf S, Peto R. Reduction in fatal pulmonary embolism and venous thrombosis by perioperative administration of subcutaneous heparin. Overview of results of randomized trials in general, orthopedic, and urologic surgery. N Engl J Med. 1988;318(18):1162–73. doi: 10.1056/NEJM198805053181805. [DOI] [PubMed] [Google Scholar]
- [36].Antiplatelet Trialists’ Collaboration Collaborative overview of randomised trials of antiplatelet therapy—III: reduction in venous thrombosis and pulmonary embolism by antiplatelet prophylaxis among surgical and medical patients. BMJ. 1994;308(6923):235–46. [PMC free article] [PubMed] [Google Scholar]
- [37].White RH. The epidemiology of venous thromboembolism. Circulation. 2003;107(23 Suppl 1):I4–8. doi: 10.1161/01.CIR.0000078468.11849.66. [DOI] [PubMed] [Google Scholar]
- [38].Colwell CW, Jr, Collis DK, Paulson R, McCutchen JW, Bigler GT, Lutz S, et al. Comparison of enoxaparin and warfarin for the prevention of venous thromboembolic disease after total hip arthroplasty. Evaluation during hospitalization and three months after discharge. J Bone Joint Surg Am. 1999;81(7):932–40. doi: 10.2106/00004623-199907000-00005. [DOI] [PubMed] [Google Scholar]
- [39].Cohen AT, Bailey CS, Alikhan R, Cooper DJ. Extended thromboprophylaxis with low molecular weight heparin reduces symptomatic venous thromboembolism following lower limb arthroplasty—a meta-analysis. Thromb Haemost. 2001;85(5):940–1. [PubMed] [Google Scholar]
- [40].Eikelboom JW, Quinlan DJ, Douketis JD. Extended-duration prophylaxis against venous thromboembolism after total hip or knee replacement: a meta-analysis of the randomised trials. Lancet. 2001;358(9275):9–15. doi: 10.1016/S0140-6736(00)05249-1. [DOI] [PubMed] [Google Scholar]
- [41].Hull RD, Pineo GF, Stein PD, Mah AF, MacIsaac SM, Dahl OE, et al. Extended out-of-hospital low-molecular-weight heparin prophylaxis against deep venous thrombosis in patients after elective hip arthroplasty: a systematic review. Ann Intern Med. 2001;135(10):858–69. doi: 10.7326/0003-4819-135-10-200111200-00006. [DOI] [PubMed] [Google Scholar]
- [42].O’Donnell M, Linkins LA, Kearon C, Julian J, Hirsh J. Reduction of out-of-hospital symptomatic venous thromboembolism by extended thromboprophylaxis with low-molecular-weight heparin following elective hip arthroplasty: a systematic review. Arch Intern Med. 2003;163(11):1362–6. doi: 10.1001/archinte.163.11.1362. [DOI] [PubMed] [Google Scholar]
- [43].Rodgers A, MacMahon S. Systematic underestimation of treatment effects as a result of diagnostic test inaccuracy: implications for the interpretation and design of thromboprophylaxis trials. Thromb Haemost. 1995;73(2):167–71. [PubMed] [Google Scholar]
- [44].Leizorovicz A, Cohen AT, Turpie AG, Olsson CG, Vaitkus PT, Goldhaber SZ. Randomized, placebo-controlled trial of dalteparin for the prevention of venous thromboembolism in acutely ill medical patients. Circulation. 2004;110(7):874–9. doi: 10.1161/01.CIR.0000138928.83266.24. [DOI] [PubMed] [Google Scholar]
- [45].Boissel JP, Collet JP, Lievre M, Girard P. An effect model for the assessment of drug benefit: example of antiarrhythmic drugs in post-myocardial infarction patients. J Cardiovasc Pharmacol. 1993;22(3):356–63. doi: 10.1097/00005344-199309000-00003. [DOI] [PubMed] [Google Scholar]
- [46].Choi BC. Causal modeling to estimate sensitivity and specificity of a test when prevalence changes. Epidemiology. 1997;8(1):80–6. doi: 10.1097/00001648-199701000-00013. [DOI] [PubMed] [Google Scholar]
- [47].Lensing AW, Hirsh J. 125I-fibrinogen leg scanning: reassessment of its role for the diagnosis of venous thrombosis in post-operative patients. Thromb Haemost. 1993;69(1):2–7. [PubMed] [Google Scholar]
- [48].Moons KG, van Es GA, Deckers JW, Habbema JD, Grobbee DE. Limitations of sensitivity, specificity, likelihood ratio, and Bayes’ theorem in assessing diagnostic probabilities: a clinical example. Epidemiology. 1997;8(1):12–7. doi: 10.1097/00001648-199701000-00002. [DOI] [PubMed] [Google Scholar]
- [49].Hlatky MA, Pryor DB, Harrell FE, Jr, Califf RM, Mark DB, Rosati RA. Factors affecting sensitivity and specificity of exercise electrocardiography. Multivariable analysis. Am J Med. 1984;77(1):64–71. doi: 10.1016/0002-9343(84)90437-6. [DOI] [PubMed] [Google Scholar]
- [50].Diamond GA. Reverend Bayes’ silent majority. An alternative factor affecting sensitivity and specificity of exercise electrocardiography. Am J Cardiol. 1986;57(13):1175–80. doi: 10.1016/0002-9149(86)90694-6. [DOI] [PubMed] [Google Scholar]
- [51].Knottnerus JA, Leffers P. The influence of referral patterns on the characteristics of diagnostic tests. J Clin Epidemiol. 1992;45(10):1143–54. doi: 10.1016/0895-4356(92)90155-g. [DOI] [PubMed] [Google Scholar]
- [52].Brenner H, Gefeller O. Variation of sensitivity, specificity, likelihood ratios and predictive values with disease prevalence. Stat Med. 1997;16(9):981–91. doi: 10.1002/(sici)1097-0258(19970515)16:9<981::aid-sim510>3.0.co;2-n. [DOI] [PubMed] [Google Scholar]
- [53].Coughlin SS, Trock B, Criqui MH, Pickle LW, Browner D, Tefft MC. The logistic modeling of sensitivity, specificity, and predictive value of a diagnostic test. J Clin Epidemiol. 1992;45(1):1–7. doi: 10.1016/0895-4356(92)90180-u. [DOI] [PubMed] [Google Scholar]
- [54].Mulherin SA, Miller WC. Spectrum bias or spectrum effect? Subgroup variation in diagnostic test evaluation. Ann Intern Med. 2002;137(7):598–602. doi: 10.7326/0003-4819-137-7-200210010-00011. [DOI] [PubMed] [Google Scholar]
- [55].Irwig L, Bossuyt P, Glasziou P, Gatsonis C, Lijmer J. Designing studies to ensure that estimates of test accuracy are transferable. BMJ. 2002;324(7338):669–71. doi: 10.1136/bmj.324.7338.669. [DOI] [PMC free article] [PubMed] [Google Scholar]
- [56].Reid MC, Lachs MS, Feinstein AR. Use of methodological standards in diagnostic test research. Getting better but still not good. JAMA. 1995;274(8):645–51. [PubMed] [Google Scholar]
- [57].Lijmer JG, Mol BW, Heisterkamp S, Bonsel GJ, Prins MH, van der Meulen JH, et al. Empirical evidence of design-related bias in studies of diagnostic tests. JAMA. 1999;282(11):1061–6. doi: 10.1001/jama.282.11.1061. [DOI] [PubMed] [Google Scholar]
- [58].Bossuyt PM, Reitsma JB, Bruns DE, Gatsonis CA, Glasziou PP, Irwig LM, et al. Towards complete and accurate reporting of studies of diagnostic accuracy: the STARD initiative. BMJ. 2003;326(7379):41–4. doi: 10.1136/bmj.326.7379.41. [DOI] [PMC free article] [PubMed] [Google Scholar]
- [59].Sackett DL, Haynes RB. The architecture of diagnostic research. BMJ. 2002;324(7336):539–41. doi: 10.1136/bmj.324.7336.539. [DOI] [PMC free article] [PubMed] [Google Scholar]
- [60].Knottnerus JA, van Weel C, Muris JW. Evaluation of diagnostic procedures. BMJ. 2002;324(7335):477–80. doi: 10.1136/bmj.324.7335.477. [DOI] [PMC free article] [PubMed] [Google Scholar]
- [61].Moses LE, Shapiro D, Littenberg B. Combining independent studies of a diagnostic test into a summary ROC curve: data-analytic approaches and some additional considerations. Stat Med. 1993;12(14):1293–316. doi: 10.1002/sim.4780121403. [DOI] [PubMed] [Google Scholar]
- [62].Buck AA, Gart JJ. Comparison of a screening test and a reference test in epidemiologic studies. I. Indices of agreement and their relation to prevalence. Am J Epidemiol. 1966;83(3):586–92. doi: 10.1093/oxfordjournals.aje.a120609. [DOI] [PubMed] [Google Scholar]
- [63].Gart JJ, Buck AA. Comparison of a screening test and a reference test in epidemiologic studies. II. A probabilistic model for the comparison of diagnostic tests. Am J Epidemiol. 1966;83(3):593–602. doi: 10.1093/oxfordjournals.aje.a120610. [DOI] [PubMed] [Google Scholar]
- [64].Walter SD, Irwig L, Glasziou PP. Meta-analysis of diagnostic tests with imperfect reference standards. J Clin Epidemiol. 1999;52(10):943–51. doi: 10.1016/s0895-4356(99)00086-4. [DOI] [PubMed] [Google Scholar]
- [65].Kassai B, Boissel JP, Cucherat M, Sonie S, Shah NR, Leizorovicz A. A systematic review of the accuracy of ultrasound in the diagnosis of deep venous thrombosis in asymptomatic patients. Thromb Haemost. 2004;91(4):655–66. doi: 10.1267/THRO04040655. [DOI] [PMC free article] [PubMed] [Google Scholar]
- [66].Knottnerus JA. The evidence base of clinical diagnosis. BMJ Publishing Group; London: 2002. [Google Scholar]
- [67].Knottnerus JA, Muris J. Assessment of the accuracy of diagnostic tests: the cross-sectional study. In: Knottnerus JA, editor. The evidence base of clinical diagnosis. BMJ Publishing Group; London: 2002. pp. 39–59. [Google Scholar]
- [68].Irwig L, Macaskill P, Glasziou P, Fahey M. Meta-analytic methods for diagnostic test accuracy. J Clin Epidemiol. 1995;48(1):119–30. doi: 10.1016/0895-4356(94)00099-c. [DOI] [PubMed] [Google Scholar]
- [69].Lijmer JG, Bossuyt PM, Heisterkamp SH. Exploring sources of heterogeneity in systematic reviews of diagnostic tests. Stat Med. 2002;21(11):1525–37. doi: 10.1002/sim.1185. [DOI] [PubMed] [Google Scholar]


