

Abstract
The zona incerta (ZI) is at the crossroad of almost all major ascending and descending fiber tracts and targets numerous brain centers from the thalamus to the spinal cord. Effective ascending drive of ZI cells has been described, but the role of descending cortical signals in patterning ZI activity is unknown.
Cortical control over ZI function was examined during slow cortical waves (1–3 Hz), paroxysmal high-voltage spindles (HVSs), and 5–9 Hz oscillations in anesthetized rats. In all conditions, rhythmic cortical activity significantly altered the firing pattern of ZI neurons recorded extracellularly and labeled with the juxtacellular method. During slow oscillations, the majority of ZI neurons became synchronized to the depth-negative phase (“up state”) of the cortical waves to a degree comparable to thalamocortical neurons. During HVSs, ZI cells displayed highly rhythmic activity in tight synchrony with the cortical oscillations. ZI neurons responded to short epochs of cortical 5–9 Hz oscillations, with a change in the interspike interval distribution and with an increase in spectral density in the 5–9 Hz band as measured by wavelet analysis. Morphological reconstruction revealed that most ZI cells have mediolaterally extensive dendritic trees and very long dendritic segments. Cortical terminals established asymmetrical synapses on ZI cells with very long active zones.
These data suggest efficient integration of widespread cortical signals by single ZI neurons and strong cortical drive. We propose that the efferent GABAergic signal of ZI neurons patterned by the cortical activity can play a critical role in synchronizing thalamocortical and brainstem rhythms.
Keywords: oscillation, GABA, sensorimotor, thalamocortical, basal ganglia, rhythm
Introduction
Cortical output signals are conveyed to subcortical structures by deep-layer pyramidal cells. The signals originating in layer V pyramidal cells represent a major output of neocortex and are regarded as “motor” instructions (Guillery, 2003, 2005). This corticofugal activity controls subcortical centers and is fed back to the cortex via the basal ganglia output nuclei through the GABAergic control of thalamocortical (TC) neurons (the basal ganglia–thalamus loop). The impact of cortical efferents on their targets varies among subcortical structures and probably depends on the efficacy of the descending inputs and the resonant properties of the target neurons. The magnitude of coupling to cortical activity may change during diseased states (Bevan et al., 2002). Neuronal activity in the striatum, the subthalamic nucleus, and the external globus pallidus is strongly correlated with the cortical slow oscillation (Magill et al., 2000; Tseng et al., 2001; Kasanetz et al., 2002). However, neurons in the substantia nigra pars reticulata are less affected, but their activity becomes entrained by the slow cortical oscillation after lesioning the nigrostriatal dopaminergic fibers (Belluscio et al., 2003).
Recently, another subcortical structure, the zona incerta (ZI), has been identified as a major source of GABAergic input to the thalamus (Bartho et al., 2002). The ZI is innervated by collaterals of layer V pyramidal cells of widespread cortical regions (Mitrofanis and Mikuletic, 1999; Veinante et al., 2000). This arrangement allows the transformation of the corticofugal signal to an inhibitory input to the thalamus, a feature common to the output structures of the basal ganglia. Similar synaptic arrangements may explain the success of similar therapeutic intervention for the basal ganglia and ZI in various neurological diseases, including essential tremor (Murata et al., 2003), complex limb tremor accompanying multiple sclerosis (Alusi et al., 2001; Nandi et al., 2002), Tourette syndrome (Babel et al., 2001), and hemiballism (Krauss and Mundinger, 1996). Recent data suggest that both deep-brain stimulations and lesions to alleviate the symptoms of Parkinson's disease involve the ZI in addition to the subthalamic nucleus (Patel et al., 2003; Yelnik et al., 2003). In a comparative study, ZI stimulation was actually superior to the subthalamic nucleus in improving parkinsonism (Plaha et al., 2006).
Similar to basal ganglia, ZI has also been suggested to be involved in numerous nonmotor functions, including attention, orientation, and visceral and sexual activity, probably because of its rich connectivity with almost every center of the neuroaxis (for a review see (Mitrofanis, 2005). More recently, ZI was found to effectively reduce the spontaneous activity in the thalamus and exert a strong feedforward inhibition on peripherally evoked responses in relay cells (Trageser and Keller, 2004; Lavallee et al., 2005). To date, however, the role of cortical input in regulating ZI neuronal activity and the synaptic arrangement of the cortico-incertal pathway has not been investigated. Recent data indicated that cortical stimulation results in fast excitatory response of ZI neurons (Richard et al., 2003; A. Parent, personal communication). However, stimulation data are frequently difficult to interpret because of the multiple possible routes of action. Thus, in this study we used synchronized cortical oscillations as triggers to study the effect of the neocortex on ZI activity. The physiological data are complemented with the visualization and three-dimensional reconstruction of the recorded ZI cells and electron microscopic investigation of the cortico-incertal synapses.
Materials and Methods
All experimental procedures were performed according to the ethical guidelines of the Institute of Experimental Medicine, Hungarian Academy of Sciences and the European Union guidelines (directive 86/609/EEC), approved by the Ethical Committee (Hungarian and French, Comité Régional d'Ethique en Matière d'Expérimentation Animale, Strasbourg, France) and conformed to the National Institutes of Health Guide for the Care and Use of Laboratory Animals. Every precaution was taken to minimize stress and the number of animals used in each series of experiments.
In vivo electrophysiology
Urethane anesthesia.
The first series of experiments were conducted under urethane anesthesia [20% urethane (Sigma-Aldrich, St. Louis, MO) in saline (0.12–0.15 g/100 g body weight; n = 30)] in Wistar (n = 15) or Sprague Dawley (n = 14) rats. To achieve large-amplitude cortical local field potential (LFP), additional doses of ketamine (10 mg/kg, i.m.; Henry Schein, Melville, NY) were given to the rats (n = 21).
Monopolar tungsten electrodes (in vitro impedance, 0.8–1.2 MΩ; FHC, Bowdoinham, ME) were implanted in layer V of the primary somatosensory cortex (−2 mm posterior, 4 mm lateral from bregma; 1.5 mm deep from the cortical surface) to monitor cortical LFP and multiunit activity (MUA). A stainless steel reference screw was placed above the cerebellum. An extracellular broadband signal was amplified with 1000× gain, filtered between 0.1 and 5 kHz (BioAmp; Supertech, Pécs, Hungary) and digitized at 16.6 kHz (micro 1401 mkII; Cambridge Electronics Design, Cambridge, UK).
Cortical MUA was derived from the bandpass-filtered (0.8–5 kHz) LFP recordings by detecting deflections from baseline exceeding 3.5 SDs.
Pipettes for juxtacellular recordings of 20–60 MΩ were pulled from borosilicate capillary glass (1.5 mm outer diameter, 0.86 mm inner diameter; Sutter Instruments, Novato, CA) filled with 0.5 m NaCl or 0.5 m CH3COONa and 1.5–3% Neurobiotin (Vector Laboratories, Burlingame, CA) or 2–3% biocytin (Sigma-Aldrich). Electrodes were lowered into the thalamus and the ZI (3.6–4.3 mm posterior, 2.5 mm lateral from bregma; 4–6.2 and 6.8–7.2 mm deep for the thalamus and ZI, respectively) by a piezoelectric microdrive (6000 ULN; EXFO Burleigh, Quebec, Quebec, Canada). Neuronal activity was amplified by a DC amplifier (Axoclamp 2B; Molecular Devices, Foster City, CA) with 1000× gain, filtered between 0.1 and 5 kHz by a signal conditioner (Supertech) and digitized at 16.6 kHz (Cambridge Electronics Design). Recordings were made in the “extracellular” position for 30 min to 2 h, after which the capillary was advanced to reach the “juxtacellular” position for labeling (Pinault, 1996). Depolarizing current pulses of sufficient amplitude (0.5–8 nA) were applied to drive the cell firing for 2–10 min.
Neuroleptanalgesia.
In a second series of experiments (n = 10 Wistar rats), surgery was made under deep general anesthesia [40 mg/kg pentobarbital, i.p. (Sanofi, Libourne, France), and 50 mg/kg ketamine, i.m. (Merial, Lyon, France)]. Tracheotomy and catheterization of the penile vein were performed, and the animal was placed in a stereotaxic frame (David Kopf Instruments, Tujunga, CA). Before the end of the general pentobarbital–ketamine anesthesia, neuroleptanalgesia was initiated and maintained by a continuous intravenous injection (0.5 ml/h) of the following mixture: d-tubocurarine chloride (0.4 mg; Sigma-Aldrich, Saint-Quentin Fallavier, France), fentanyl (1 μg; Janssen, Boulogne-Billancourt, France), haldol (100 μg; Janssen), and glucose (25 mg). (The adequacy of the neuroleptanalgesia was established in the absence of neuromuscular blockade, but during all recordings, the animals were paralyzed). All rats were artificially ventilated (SAR-830; CWE, Ardmore, PA) in the pressure mode (8–12 cm of H2O; 60–65 breaths per minute) using an O2-enriched gas mixture (70–50% air/30–50% O2). The rat's rectal temperature was maintained at its physiological level (37–38.3°C) using a thermoregulated blanket (Fine Science Tools, Heidelberg, Germany). The LFP and the heart rate were under continuous monitoring to maintain a steady depth of anesthesia by adjusting the injection rate of the anesthetic solution. The coordinates for LFP electrodes were as follows: +4 mm anterior, 1.2 mm lateral from bregma. The recordings were by monopolar electrodes, and the reference electrode was in the occipital crest.
Glass micropipettes (20–70 MΩ) were filled with a solution containing 1.5% Neurobiotin (Vector Laboratories) dissolved in either 1 m CH3COOK or 1 m NaCl. The pipette was lowered with a stepping microdriver (EXFO Burleigh) into the thalamus or zona inerta. Electrophysiological data were processed with bandpasses of 0.1–1200 Hz for the LFP, of 0.1–6 kHz for unit activity (Cyber-Amp 380; Molecular Devices). Signals were digitized at a sampling rate of 25 kHz.
Histology
After a survival period of 1–5 h, all animals were perfused through the heart with 0.9% saline followed by a fixative containing 4% paraformaldehyde, 15% picric acid, and 0.1% glutaraldehyde in 0.1 m phosphate buffer (PB). After fixation, 50- or 80-μm-thick coronal brain sections were cut on a Vibratome (Vibratome, St. Louis, MO) and incubated with avidin–biotin–peroxidase complex (Vector Laboratories). The labeled cells were visualized using nickel-intensified diaminobenzidine (DAB) reaction. The sections containing the labeled neurons were dehydrated and embedded in Durcupan (ACM; Fluka, Buchs, Switzerland) or mounted from gelatin, dehydrated, and covered using Depex.
Three-dimensional reconstruction of the labeled neurons
The dendritic trees of the labeled neurons were reconstructed using Neurolucida 5.2 software (MBF Bioscience, Magdeburg, Germany). For the numerical analysis of the dendritic tree, the following shrinkage corrections were used: Durcupan-embedded material: x–y-axis, 1.1; z-axis, 2.2; gelatin-embedded material: x–y-axis, 1.1; z-axis, 5. These values were based on our measurements of tissue shrinkage as a result of fixation and the dehydration procedures.
Data analysis
Spike detection and data analysis were performed in Matlab (Mathworks, Natick, MA). Power spectra were estimated using Welch's method (Matlab pwelch function), with 2.44 Hz resolution. Autocorrelograms and cross-correlograms were computed using 10 ms time bins. In the urethane experiments for spike-triggered average (STA) and MUA cross-correlation analysis, the number of ZI spikes ranged from 42 to 15,826, and the number of cortical MUA spikes ranged from 239 to 49,344. In the neuroleptanalgized animals, a minimum of 100 spikes were required for the interspike interval and wavelet analysis.
To assess the degree of cortical modulation in ZI cells, two indices were used. To calculate the MUA index, the cortical MUA–ZI single-unit cross-correlogram was normalized to unit area and smoothed using a 55 ms Hamming window. The MUA index was defined as the SD of the smoothed and normalized cross-correlogram.
The STA index was computed as the amplitude of the central trough of the normalized STA of the cortical LFP triggered by the firing of a ZI unit.
Correlation between cortical activity and the firing pattern of ZI and thalamic relay neurons during the somatosensory 5–9 Hz oscillation were analyzed based on the continuous wavelet transformation (Muthuswamy and Thakor, 1998) of the cortical LFP and ZI or thalamic-unit signals. First, the LFP was down-sampled from 25 kHz to 250 Hz, and the unit time series containing the discriminated spike events was converted into a continuous signal by convolution with a sinc [sin(x)/x] function. Then, both signals were subjected to the following continuous wavelet transform:
 |
where xn is the time series, Ψ is the wavelet function, and * marks the complex conjugate. As a wavelet function, the Morlet wavelet was used (Torrence and Compo, 1998):
 |
To analyze the time-based correlation between the LFP and the spike train, the cross-wavelet spectrum of the two signals (X and Y) was calculated as follows:
To select epochs of 5–9 Hz activity in the LFP, the intensity function (expressing the time-dependent amplitude changes) of the 5–9 Hz frequency band was calculated by the summation of amplitude values falling in the 5–9 Hz range in the LFP wavelet. Summed amplitude values of 5–9 Hz events surpassing a threshold of mean + 2 × SD of the intensity function were selected, and the boundaries of segments were defined as mean + 0.2 × SD. The intensity function of the 5–9 Hz band also was calculated for the unit wavelet and the cross-wavelet of the unit and LFP signals. To determine the level of 5–9 Hz modulation, the mean amplitude of 5–9 Hz activity was determined in the selected 5–9 Hz epochs for LFP, unit, and cross-wavelets. To obtain the changes in the proportion of 5–9 Hz modulation in the entire spectrum, the relative intensity functions were also defined by dividing the summed 5–9 Hz amplitude with the summation of amplitude values over the entire frequency range, and mean relative amplitudes were calculated. Additionally, unit autospectra of 5–9 Hz and non-5–9 Hz segments were also calculated using the Welch method because it is realized in the “pwelch” built-in Matlab function. First, autocorrelograms were determined and smoothed by 250-point nonoverlapping windows (corresponding to a downsampling from 25 kHz, 0.04 ms bins to 100 Hz, 10 ms bins). Then, the spectra of the smoothed autocorrelograms were calculated by dividing the analyzed segments into eight parts with a 50% overlap between adjacent segments, followed by the convolution of the resulting windows by a Hamming window function and the calculation of a 128-point fast Fourier transform (frequency resolution, 0.78 Hz). For assessing the relative power density in the 5–9 Hz band, the sum of power values falling between 5 and 9 Hz was divided by the sum of the entire spectrum. To detect 5–9 Hz-related alterations in the activity level of ZI or thalamic neurons, the firing rate of the unit during the 5–9 Hz segments was determined, and interspike intervals coinciding with 5–9 Hz LFP activity were selected and compared with intervals of non-5–9 Hz periods using the Mann–Whitney U test. The comparison of absolute and relative 5–9 Hz amplitude values between segments dominated by 5–9 Hz activity and non-5–9 Hz segments also was accomplished using the Mann–Whitney U test. As a control, epochs of fast oscillation-dominated LFP activity were marked and wavelet transformed, and the above-detailed comparisons of 5–9 Hz absolute and relative amplitude values and interspike intervals were accomplished.
Anterograde tracing and electron microscopy
Six rats were anesthetized with Equithesin (chlornembutal, 0.3 ml/100 g) and received single or multiple injections of biotinylated dextran amine (BDA) or Phaseolus vulgaris leucoagglutinin (PHAL) via glass micropipettes (tip diameter, 20–50 μm). BDA was injected into three animals. In one rat, two injections were performed on each side; in another rat, two unilateral injections were made [bregma: −0.8 mm anteroposterior (AP), 4.5 mm lateral (L), −2.3 mm dorsoventral (DV) from pia; and −2.0 mm AP, 4.5 mm L, −2.5 mm DV from pia]. In the third rat, four BDA injections were made (bregma: −0.8 to −2.8 mm AP, 4.0–5.0 mm L, −1.5 to −2.0 mm DV). Three animals were given injections of PHAL; two of them received four unilateral injections, and one received a single injection using the coordinates above. The tracers were ejected with positive current pulses: BDA, 2 s duty cycle of 0.5–4.0 μA for 30 min; PHAL, 7 s duty cycle of 5 μA for 20 min. After a survival period of 5–7 d, rats were deeply anesthetized with Equithesin and perfused with physiological saline (2 min), followed by 100 ml of fixative containing 2% paraformaldehyde (TAAB, Aldermaston, UK) and 0.5% glutaraldehyde (EMS, Nyon, Switzerland) in acetate buffer, pH 6.0, for 3 min, and finally with 400 ml of fixative containing 2% paraformaldehyde and 0.5% glutaraldehyde in borate buffer, pH 8.5, for 50 min. Coronal sections of the diencephalon (50 μm thick) were cut on a vibratome, washed, cryoprotected in 30% sucrose in 0.1 m PB overnight, and freeze thawed in an aluminum foil boat over liquid nitrogen.
For BDA, sections through the ZI were incubated with the avidin-biotinylated horseradish peroxidase complex (ABC; Vector Laboratories) in Tris-buffered saline for 2 h and developed using DAB. Sections from animals that received injections of PHAL were first incubated with rabbit anti-PHAL (1:10,000; Vector Laboratories) overnight; the second layer was biotinylated goat anti-rabbit (1:300; Vector Laboratories) for 2 h, and the third layer was ABC followed by DAB. All sections were osmicated (1% OsO4 in PB for 45 min), dehydrated in ethanol and propylene oxide, and embedded in Durcupan. During dehydration, sections were treated with 1% uranyl acetate in 70% ethanol for 40 min. Retrograde labeling was observed in the thalamus [ventral posteromedial nucleus (VPM) and ventral posterolateral nucleus] in one of the BDA-injected animals (1–10 relay cells/section). Sections for the EM examination were prepared from the PHAL-labeled material. Cortico-incertal axons were reconstructed using a drawing tube.
To examine the ultrastructure of cortico-incertal terminals, selected sections containing labeled terminals were re-embedded, cut at 60 nm with an ultramicrotome (Leica Microsystem, Wetzlar, Germany), and mounted on copper grids. Light microscopy pictures were taken with a digital camera (DP 70; Olympus Optical, Tokyo, Japan). Electron micrographs were taken on a Hitachi (Tokyo, Japan) 7100 electron microscope, the negatives were scanned, and brightness and contrast were adjusted if necessary using Adobe Photoshop 7.0. Measurements were made using the software AnalySIS.
Results
Characterization of different LFP states under urethane anesthesia
Under urethane anesthesia, the depth of anesthesia varied spontaneously. Three LFP stages were distinguished in our study. In the first stage, typically present during light anesthesia, the LFP (Fig. 1A) was characterized by low-amplitude fast oscillations in the beta and gamma frequency ranges mixed with oscillations in the theta frequency range (Fig. 1A1), which were most likely volume conducted from the hippocampus. In this state, the neocortex did not express significant rhythmic activity (except in the low-amplitude gamma frequency range), as shown by the “flat” LFP and cortical MUA autocorrelograms (Fig. 1A2,A3).
Figure 1.

A–C, Characterization of different LFP states under light urethane anesthesia (A), slow oscillation (B), or paroxysmal HVS activity (C) induced by additional injection of ketamine. Raw LFP data recorded by deep cortical electrodes (A–C; top traces), the filtered and discriminated cortical multiunit activities (A–C; middle and bottom traces, respectively), power spectra (A1, B1, C1), autocorrelogram of the LFP (A2, B2, C2), and the cortical MUA (A3, B3, C3) are shown. A, Fast oscillation-dominated epochs are characterized by a low-amplitude LFP signal. In this state, the neocortex does not express significant synchronized, rhythmic activity, as shown by the flat autocorrelograms. B, During synchronized states, the LFP shows large-amplitude, irregular activity with a corresponding low-frequency (1–4 Hz) peak on the LFP power spectrum. A large peak at time 0 in the LFP and multiunit autocorrelograms indicate synchronized activity. C, Paroxysmal LFP activity is characterized by a highly regular ∼3.5 Hz oscillation visible in the power spectrum and the autocorrelograms.
In the second stage (Fig. 1B), which could occur either spontaneously or induced by additional administration of ketamine (see Materials and Methods), the LFP showed large-amplitude, irregular oscillations in the delta frequency range (1–4 Hz) (Fig 1B1–B3).
The third state (Fig. 1C) was characterized by large-amplitude, highly regular ∼3.5 Hz oscillations, as described previously (Buzsaki, 1991), as high-voltage spindles (HVSs). This pattern arose after the injection of ketamine in 20–30% of the animals.
Firing pattern of ZI cells under urethane anesthesia: correlation of unit activity and slow cortical oscillation
Thirty-five ZI cells were recorded extracellularly, followed by the juxtacellular labeling procedure (Pinault, 1996). Unequivocal correlation between the labeled cells and the recordings was available in 21 cases. In the remaining 14 cells, the position of the recorded neurons was determined by the depth measurements of histologically identified neurons recorded in the same animal. Of the 32 neurons, 21 cells were located in the dorsal sector of ZI, seven in the ventral sector, three in the rostral sector, and one in the caudal sector (Mitrofanis, 2005). For three cells, subnuclear distribution could not be determined.
The firing rate of ZI cells varied widely among different neurons between 0.08 and 41.67 Hz (mean, 10.58 ± 11.07 Hz) (Fig. 2; supplemental material 1, available at www.jneurosci.org as supplemental material). During fast oscillation-dominated epochs, the cells typically fired single spikes in a tonic or irregular manner (Fig. 3A1,B1,C1). Occasional high-frequency spike transients reached the frequency of 70 Hz, but this activity was rarely observed, as shown by the lack of short-latency peak in the autocorrelogram (Fig. 3Aa,Ba,Ca). The discharge activity during this state demonstrated no apparent relationship to the cortical LFP or cortical MUA, as evidenced by the flat spike-triggered LFP averages (Fig. 3Ac,Bc,Cc) and cross-correlograms (Fig. 3Ad,Bd,Cd).
Figure 2.
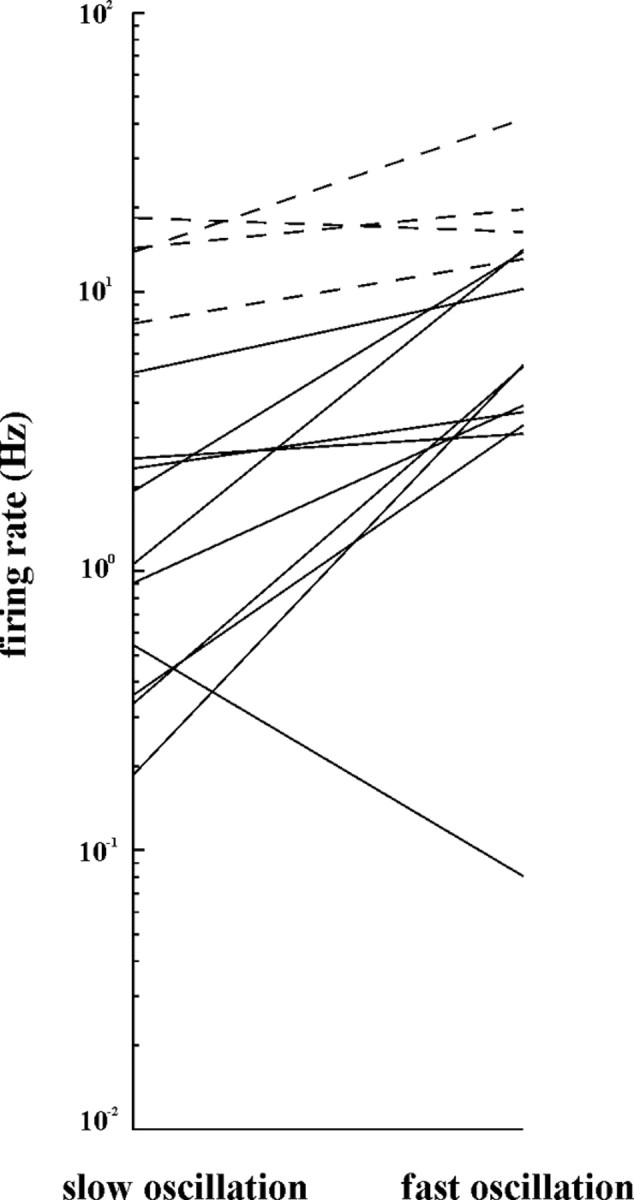
Changes in the firing frequency of individual tonic (dashed lines) and modulated (solid lines) ZI cells between synchronized and fast oscillation-dominated states. Note the higher frequency and less modulation of the tonic cells.
Figure 3.
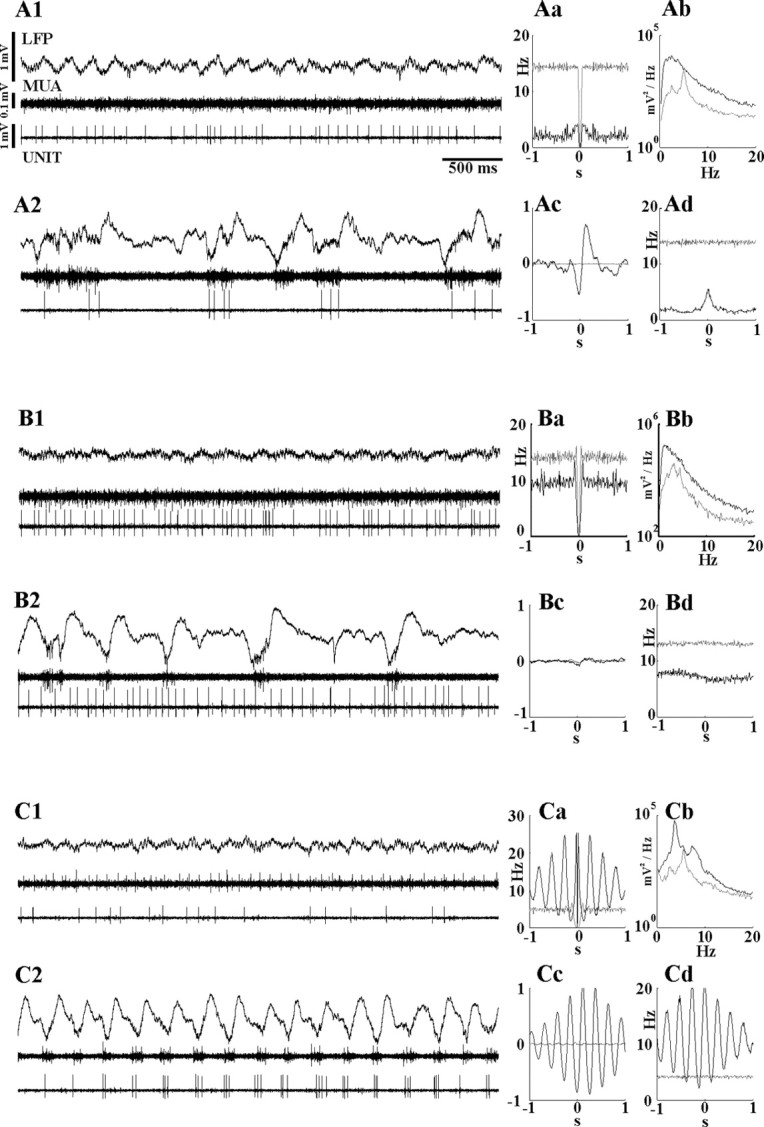
Firing patterns of ZI cells during normal (A, B) and paroxysmal (C) LFP states. A, B, Firing patterns of a rhythmic (A) and a tonic (B) neuron in ZI and their relationship to cortical activity during different LFP states. A1–B2, Raw LFP data, cortical MUA, and ZI unit activity are depicted together with the autocorrelogram of the unit activity (Aa, Ba), the power spectra of the LFPs (Ab, Bb), spike-triggered LFP averages (Ac, Bc), and cross-correlogram of cortical MUA and ZI unit activity (Ad, Bd). In Aa–Ad and Ba–Bd, gray and black lines indicate data obtained during fast oscillation-dominated and synchronized LFP, respectively. In A1 and B1, both neurons fire single spikes in a tonic manner during fast oscillation-dominated LFP states, with no apparent relationship to the deep cortical LFP or cortical MUA. During the synchronized state, the firing of the rhythmic cell (A) is locked to the depth-negative cortical waves (note the large amplitude of the normalized STA and the peak in Ad). The neuron in B continues to fire in a tonic manner unmodulated by the large-amplitude LFP events. C, The firing activity of a ZI cell is entrained by hypersynchronous cortical waves during paroxysmal cortical activity. Ca–Cd are as in A and B. A dorsal ZI cell fires irregularly during desynchronised cortical LFP (C1) but displays a strong 3.5 Hz oscillatory pattern during cortical paroxysmal activity (C2). Note the highly rhythmic ZI unit (Ca) activity and the strong phase-locking of the ZI cell to the downward deflection of the cortical waves (C2), also shown by the STA (Cc) and the cross-correlogram of the cortical multiunit and ZI unit activity (Cd). UNIT, ZI unit activity.
Twenty ZI neurons were examined under synchronized LFP states together with well discriminated cortical MUA. Power spectra (Fig. 3Ab,Bb,Cb; supplemental material 2, available at www.jneurosci.org as supplemental material) LFP autocorrelograms and cortical multiunit autocorrelograms (Fig. 3Ad,Bd,Cd) were used to select stable and comparable LFP epochs. With the emergence of slow waves, the tonic firing was replaced by rhythmic single spikes or clusters of spikes, which coincided with the slow cortical LFP waves (Fig. 3A2) in the majority of ZI neurons (16 of 20). The magnitude of modulation differed from cell to cell (see below, Comparison of incertal and thalamic unit activity during synchronized cortical oscillations). The maximum firing rate during upstate-associated spike clusters never exceeded 50 Hz, which is clearly distinct from the burst firing mode of TC cells characterized by high-frequency (400–500 Hz) spike clusters during slow cortical oscillation. During slow oscillations, the discharge frequency of ZI neurons was slower (1.53 ± 1.53 Hz) compared with fast oscillation-dominated LFP states (6.33 ± 4.79 Hz) (supplemental material 1, available at www.jneurosci.org as supplemental material). However, a small number (n = 3) of ultraslow ZI neurons (firing rate below 0.5 Hz) actually increased their firing rates as they locked their activity to the 1–3 Hz slow waves (Fig. 2).
ZI neurons, the activity of which was modulated by the slow waves, fired preferentially during the depth-negative phase (the “active” phase or “up state”) of the slow LFP oscillation (Steriade et al., 1993a) (Fig. 3A2). The firing rate of modulated ZI neurons during the up states approached the firing rate observed during the fast oscillation-dominated LFP states (3.88 ± 2.79 Hz vs 6.33 ± 4.79 Hz, respectively). To examine the timing of ZI neuronal activity relative to the firing of cortical cells, the peak of the cross-correlograms between ZI single-cell activity and MUA (Fig. 3Ad) was calculated. The average peak of the cross-correlogram was at 1.09 ms with little variability (±1.76 ms), which suggests the coupling of ZI neuron firing to cortical MUA.
Four of the 20 ZI neurons recorded during slow cortical oscillations did not change their tonic firing pattern with the occurrence of slow waves (Fig. 3B). These tonic cells were similar to those found recently in the anterior pretectal nuclei (APT) (Bokor et al., 2005) and were characterized by flat STA (Fig. 3Bc) and ZI-unit MUA cross-correlogram (Fig 3Bd). Neurons that were strongly modulated, and those that were not modulated by cortical activity could be recorded in the same track within the ZI relatively close to each other. The firing frequency of tonic cells was significantly higher during the fast oscillation-dominated LFP states (19.8 ± 8.81 Hz) than that of the rhythmic cells (6.33 ± 4.79) (p < 0.0001, two-sample t test), and they reacted with a smaller decrease in the firing rate with the emergence of slow waves in the LFP (16.9%) than rhythmic cells (75.8%) (Fig. 2).
The effect of paroxysmal events on ZI activity
Six of the 14 Sprague Dawley rats exhibited epochs of HVS activity spontaneously or after ketamine injection as described previously (Buzsaki, 1991), lasting from 30 s to 5 min during which the activity of seven ZI neurons was recorded. HVSs are characterized by highly synchronous discharges (∼3.5 Hz) of cortical neurons, followed by their virtual silence. Five of seven ZI neurons showed significant modulation by these paroxysmal events. Three of the affected neurons increased their firing activity considerably during HVS and fired single action potentials or small clusters of two to three spikes tightly coupled to every negative deflection of HVS (Fig. 3C2). Highly rhythmic unit firing was indicated by the multipeaked autospectra (Fig. 3Ca), whereas pronounced synchrony with the cortical activity was reflected by multiple high-amplitude side lobes in the STA and the MUA-unit cross-correlogram (Fig. 3Cc,Cd). Two cells were more active on the positive phase of HVS, whereas the remaining two cells were not affected. Interestingly, these latter two cells were entrained by the cortical activity when HVSs were replaced by normal slow LFP oscillations, suggesting either frequency-dependent resonant properties of ZI cells or that different oscillatory patterns activate different groups of cortico-incertal neurons.
Comparison of incertal and thalamic unit activity during synchronized cortical oscillations
TC neurons are known to be involved in cortical rhythm genesis (Steriade et al., 1993c). For the sake of comparison, we recorded from 21 TC cells (located in various nuclei including ventral posteromedial, posterior, ethmoid, and suprageniculate-limitans nuclei) under the same experimental conditions. TC cells exhibited tonic firing under fast oscillation-dominated LFP states with no apparent relationship to cortical activity (Fig. 4). The firing frequency during these states in different cells varied between 4.29 and 16.72 Hz (mean, 11.51 ± 4.92 Hz; SD). Ten TC neurons were recorded under spontaneous or ketamine-induced synchronized LFP states. Under this condition, the TC cells switched to burst firing mode (i.e., besides single spikes, the well described high-frequency bursts consisting of two to four action potentials were also generated as described previously in ketamine–xylazine-anesthetized cats) (Contreras and Steriade, 1995). TC cells were moderately synchronized to the LFP activity as shown by the medium-amplitude STA of cortical LFP and the more “noisy” cortical multiunit–TC unit cross-correlogram (Fig. 4Ac,Ad). During slow oscillations, the firing frequency decreased to 1.41 ± 4.92 Hz.
Figure 4.

Firing pattern of a TC cell and its relationship to cortical activity during different LFP states. A1, During the fast oscillation-dominated LFP state, the activity of the neuron is comparable to the ZI neurons (see Fig. 3) and is characterized by tonic, irregular single-spike firing. A2, Under the synchronized LFP state, the TC cell switches to burst firing mode (insets) linked to the negative deflections of the cortical LFP. Aa–Ad are as in Figure 3. Note the central peak in Aa, reflecting bursting in the synchronized state. Ac, Ad, The TC cell is moderately synchronized to the LFP activity as shown by the medium-amplitude STA (Ac) and the noisy cortical multiunit TC-unit cross-correlogram (Ad). UNIT, TC unit activity.
The magnitude of synchronization between ZI neurons and cortical activity was assessed by two separate measures: ZI (or TC) spike-triggered LFP average index (STA index) and single unit (ZI or TC) versus cortical multiunit cross-correlation index (MUA index) (see Materials and Methods), generated from the respective data. These measures enabled us to compare the synchrony of ZI and TC neurons to the LFP waves (Fig. 5). Because both parameters depend on the relationship between the unit and the cortical activity, the two indices were correlated. The four tonic ZI cells (20% of the ZI cells in this analysis) had the lowest synchrony values. Eleven of the 16 modulated ZI cells (55% of the cells) had synchrony values comparable to TC cells, whereas the remaining five modulated ZI neurons (25% of all cells) far exceeded those of the TC neurons. These data demonstrate that in these conditions, the activity of a large proportion of ZI cells are similarly or better synchronized to cortical slow oscillation than TC cells.
Figure 5.

ZI neurons are better synchronized to cortical activity than TC cells during slow oscillation under deep urethane/ketamine anesthesia. The amplitude of spike-triggered LFP average scores (STA index; see Materials and Methods) is plotted as a function of the MUA cross-unit scores (MUA index) for each ZI (filled circles) and TC (filled triangles) neuron. Because both parameters depend on the relationship between the unit and the cortical activity, they are strongly correlated. Tonic ZI cells (open circles) are characterized by the lowest values. Note that the majority of modulated ZI cells (filled circles) have similar or higher STA and MUA scores than TC cells.
Comparison of neuronal activity in different sectors of ZI
In our sample, the firing patterns observed in the two main sectors of ZI [dorsal (dZI) and ventral (vZI)] did not display systematic difference. Both vZI and dZI cells displayed similar heterogeneity. Modulated cells, which slowed down or speed up to lock their firing to the cortical up states or tonic cells that did not display rhythmic activity, were equally found in both sectors. The firing rate of vZI neurons varied between 0.08 and 41.67 Hz during fast oscillation-dominated states and between 0.19 and 14.53 Hz during slow oscillation states. The corresponding values of dZI cells were 0.3–18.4 and 3.1–16.4 Hz. Tonic cells were in the upper end of the spectrum (20–40 Hz) both in dZI and vZI. The three rostral and one caudal ZI (cZI) cells in our sample showed the behavior of rhythmic ZI cells.
Behavior of ZI cells under neuroleptanalgesia: correlation of unit activity and 5–9 Hz oscillation
The cortical influence on ZI neurons was also examined during the wake-related, cortically generated 5–9 Hz oscillations (Pinault et al., 2001, 2006; Pinault, 2003). Five to 9 Hz activity has a relatively short duration (0.5–2 s) and displays less synchrony across distant cortical areas than cortical slow oscillation, thus the former can be regarded as a “weaker” rhythmic cortical signal. Under neuroleptanalgesia, this rhythm alternates with small-voltage fast oscillations.
Nineteen ZI cells were recorded under neuroleptanalgesia, of which 15 recordings had sufficient quality and length for additional analysis. In two animals (four cells), oscillations slower than 5–9 Hz activity dominated the LFP during the recording periods. During these synchronized epochs, ZI cells fired single action potentials phase-locked to cortical activity similarly to urethane slow waves (supplemental material 3, available at www.jneurosci.org as supplemental material). Of the remaining 11 cells, 3 had slow discharge activity (average firing frequency was 3.95 Hz and 4.16 Hz during 5–9 Hz and non-5–9 Hz activity, respectively), and 8 exhibited fast tonic activity (average of 32.8 Hz and 34.5 Hz during 5–9 Hz and non-5–9 Hz activity, respectively) (supplemental material 4, available at www.jneurosci.org as supplemental material). The 8 fast cells were used for the wavelet analysis, whereas the distribution of interspike intervals was compared in 10 cells [8 fast and 2 slow neurons with a sufficient number (n > 100) of intervals for statistical comparison].
For uncovering differences in the firing pattern of units during 5–9 Hz and non-5–9 Hz epochs, three approaches were used: (1) comparison of interspike interval distributions; (2) calculation of unit autospectra; (3) wavelet-based analysis of power density changes in the 5–9 Hz band of unit recordings.
During the 5–9 Hz epochs, most ZI cells altered their activity (Fig. 6; supplemental material 4, available at www.jneurosci.org as supplemental material). All eight fast neurons changed their firing rate: five decreased their discharge frequency by 19.76% (range, 9.65–23.8%; suppressed group), and three increased their firing rate by 14.84% (range, 11.01–23.37%; activated group). In six of the eight fast cells, the distribution of interspike intervals was significantly different (p < 0.05, Mann–Whitney U test) between the 5–9 Hz and non-5–9 Hz epochs. The alteration of the firing pattern was manifested as the appearance of 100- to 200-ms-long interspike intervals during the 5–9 Hz LFP epochs (Fig. 6A4,B4) but also as a change in the number of high-frequency spike transients (lower boundary frequency, 100 Hz), as revealed by the analysis of the instantaneous frequency function. All neurons displayed high-frequency spike transients (up to 900 Hz) involving a varying number of spikes during both 5–9 Hz and non 5–9 Hz segments. Five to 9 Hz epochs were accompanied by a significant change in the rate of occurrence of these transients (supplemental material 5, available at www.jneurosci.org as supplemental material). Their rate decreased in three cells in the suppressed group, whereas it increased in four cells, three in the activated group and one in the suppressed group, during 5–9 Hz epochs. It should be noted that high-frequency spike transients were occasionally synchronized to 5–9 Hz waves, but exact phase coupling was not detected. For the remaining two slow cells, no change in the firing rate was detected, but in one of them, the interspike interval distribution changed significantly as a result of spike clustering.
Figure 6.

Firing pattern of ZI cells during 5–9 Hz oscillations. A, B, Two simultaneously recorded ZI neurons located in the left (A) and right (B) hemisphere during episodes of 5–9 Hz oscillations. LFP traces correspond to ipsilateral recordings (with respect to the unit). A1–A3, B1–B3, High-pass-filtered LFP (A1, B1; cutoff frequency, 0.5 Hz), unit activity (A2, B2), and spectral intensity (A3, B3) functions of the LFP (black) and the unit (gray) activity showing amplitude fluctuations in the 5–9 Hz band. A4, B4, Two-second periods of the recordings in A1–B2 are shown on an expanded time scale (top, LFP; bottom, unit). Five to 9 Hz and non-5–9 Hz epochs are marked by a thick and a double line, respectively. For the cell shown in A, the two bilaterally synchronous 5–9 Hz events induce parallel elevation of amplitudes in the 5–9 Hz band in both the LFP and unit activity (A3). The latter is caused by the clustering of spikes interrupted by longer pauses in the 5–9 Hz range (A4, right). The concurrently recorded neuron shown in B did not exhibit 5–9 Hz amplitude modulation in the spectral intensity function (B3). However, a robust reduction in unit firing can be detected, coinciding with the large-amplitude 5–9 Hz cortical activity (B4, left). Note the appearance of the 100–200 ms interspike intervals. Note also that the decrease in firing depends on the amplitude of cortical 5–9 Hz waves because the second smaller-amplitude episode is accompanied by only a slight decrease in firing activity (no visible gaps in B2).
Rhythmic modulation of ZI activity was examined by the analysis of autospectra. Only 1 of 10 ZI neurons exhibited phasic, synchronous discharge firing, characterized by spike clusters coupled to 5–9 Hz cortical waves indicated by a clear cut peak in the 5–9 Hz band (data not shown).
To examine the moment-to-moment variation of the 5–9 Hz component in the firing activity, wavelet-based time-frequency decomposition of the unit signal was accomplished. A significant increase in the spectral density in the 5–9 Hz band during 5–9 Hz oscillations relative to the non-5–9 Hz periods was demonstrated in all the eight fast ZI cells examined (Fig. 6A3,B3). The magnitude of increase varied widely from cell to cell (7–97%; mean, 27.1%).
In summary, cortical 5–9 Hz oscillations exerted robust influence on the recorded ZI neurons: frequency changes and 5–9 Hz modulation of the firing was observed in the majority of cells, whereas phase-locked clustered firing was found in the minority of the cases.
Dendritic architecture of ZI neurons
To establish a possible morphological substrate for the cortical influence on ZI neurons, the dendritic trees of 12 (dZI, n = 6; vZI, n = 3; cZI, n = 3) neurons have been reconstructed using the Neurolucida system (Fig. 7). ZI neurons had oval or fusiform cell bodies and three to five thick primary dendrites (Fig. 7D–F). Most of the dendrites were sparsely spiny. The spines were characterized by relatively long, thin necks and bulbous heads. The total dendritic lengths of nine ZI cells were between 4800 and 7200 μm. Two vZI and one cZI cells, however, had a dendritic length of only 2644, 2888, and 2707 μm, despite being well labeled. Whether these “simpler” neurons represent a separate ZI cell type remains to be established.
Figure 7.

Three-dimensional reconstruction of the dendritic arbor of a juxtacellularly recorded and labeled dZI neuron. A, Low-power coronal view of the ZI cell overlaid on the section that contained its soma. Note that its dendritic tree covers nearly the entire ZI in the mediolateral extent. B, The firing activity of the cell (below) together with the corresponding LFP trace (above). The curved arrow indicates a spindle episode. C, The dendrogram of the ZI cell demonstrates 300- to 600-μm-long dendritic segments in each primary dendrite. D–G, Coronal (D), sagittal (E), and dorsal (F) view of the dendritic tree and the polar histogram of the dorsal view (G) shows the extensive dendritic span in the mediolateral plane, whereas the DV and AP extent is more limited. Scale bars: A, 0.5 mm; D–F, 300 μm. Hb, Habenular nuclei; LD, laterodorsal nucleus; MD, mediodorsal nucleus; ml, medial lemniscus; nRT, reticular thalamic nucleus; VPL, ventral posterolateral nucleus; a, anterior; d, dorsal; l, lateral.
A common characteristic of ZI cells was the few branch points along the dendrites (mean number of branch points per primary dendrite was 1.34). A total of 41.3% of the primary dendrites had two or less nodes along its entire length. Dendritic segments between the branch points were frequently several hundred micrometers long (range, 1.3–1075.3 μm; mean, 95.76 μm) (Fig. 7C). The contribution of dendritic segments longer than 200 μm to the entire dendritic length was 71.9%. For comparison, the same value of a three-dimensional reconstructed relay cell located in the VPM was 5.1%. The average length and the range of the length of the first-, second-, third-, and fourth-order dendritic segments were 134.5 μm (2.3–768.1 μm), 186.1 μm (1.3–1075.3 μm), 145.3 μm (1.9–642.8 μm), and 119 μm (2.8–957.1 μm) [mean (range)], respectively. This indicates that long dendritic segments can occur in the first-, second-, third-, and fourth-order positions of the dendritic tree (Fig. 7C).
The dendrites of ZI neurons had extensive mediolateral extent (Fig. 7A). The mean dendritic span measured along the longest axis was 960.4 μm (range, 523.3–1318.2 μm). Examination of the dendritic arbors in three dimensions revealed a polarized organization of the dendritic tree (supplemental material 6, available at www.jneurosci.org as supplemental material). Several ZI neurons restricted the majority of their dendrites within a 200- to 300-μm-thick lamella. The average ratio of the dendritic span measured along the longest versus shortest axis perpendicular to it was 4.0 (range, 1.9–7.3). For dZI and cZI cells, the planes of the lamellae containing the dendrites were approximately coronal, sometimes being rotated caudally in its lateral part (n = 2) or rostrally in its dorsal part (n = 2). The DV extension of the dendritic trees in dZI and cZI cells was comparable or larger than their AP extent. The ventrally oriented distal dendrites of dZI cells crossed the dZI–vZI border. In contrast, all vZI cells in our study restricted their dendritic arbor to vZI; thus, their shortest axis was in the DV direction.
In our experiments, the dendritic trees of tonic cells (n = 4) were incompletely labeled and thus were not reconstructed. Observation of the proximal part of the dendritic tree revealed no systematic difference in soma size or number of primary dendrites between modulated and tonic cells.
Cortico-incertal synapses
After the injection of the anterograde tracer into the S1 somatosensory cortex (n = 6), labeled fibers innervated both the dZI and the vZI in an ∼1-mm-wide slab in the middle part of the structure as described previously (Mitrofanis and Mikuletic, 1999). The cortico-incertal fibers branched off the descending cortical fiber tracts and entered ZI at the border of ZI and reticular thalamic nucleus. After reaching ZI, they emitted long mediolaterally oriented collaterals. It was not uncommon to see 400- to 500-μm-long axon branches within a single 50-μm-thick coronal section (Fig. 8A). The cortico-incertal terminals were medium to large and were distributed unevenly along the axon. Long bouton-free segments alternated with small clusters of terminals. The terminals were often situated on small stalks (Fig. 8B).
Figure 8.
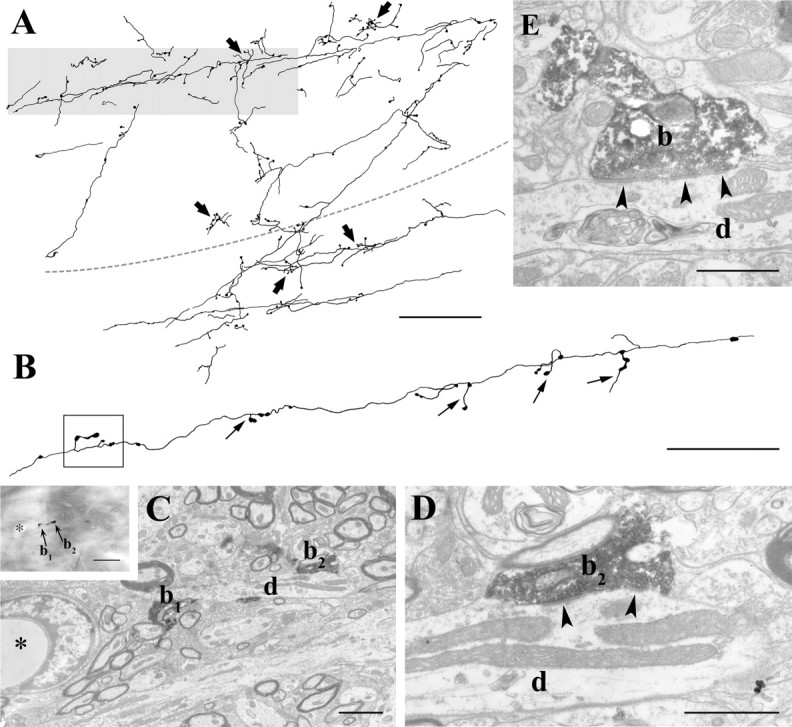
Light and electron microscopic features of the cortico-incertal pathway. A, Camera lucida drawing of anterogradely labeled cortico-incertal fibers from a single 50-μm-thick coronal section. Bouton-bearing axon collaterals run parallel to the plane of the section for several hundred micrometers. Terminals (arrows) are distributed unevenly in small clusters. The dashed line represents the dZI–vZI border. A single fiber in the gray shaded area is shown in B. Note that the boutons are frequently situated on short stalks. Correlated light and electron microscopic images of the terminals within the boxed area are shown in C and D. C, Two labeled cortical boutons (b1, b2) converge on the same postsynaptic ZI cell dendrite (d). The inset shows a high-power light microscopic image of the boutons; the asterisk labels a capillary used as a landmark. D, Bouton b2 establishes asymmetrical synapses on the dendrite via two release sites (arrowheads). E, High-power electron microscopic image of another cortico-incertal terminal displaying the characteristic long active zone and multiple release sites (arrowheads). Scale bars: A, 100 μm; B, 50 μm; C, 2 μm, 10 μm (inset); D, E, 1 μm.
Eighteen cortico-incertal terminals were examined at the electron microscopic level, of which the postsynaptic element could be unequivocally identified in 16 cases. The size of the terminals was medium to large (average major/minor axis, 1860.38/919.38 nm; range of major axis, 702–3320 nm; range of minor axis, 465–1365 nm). The 16 cortico-incertal terminal innervated 19 postsynaptic elements, nine proximal dendritic shafts, and the head of 10 spines. In two cases, one cortical terminal innervated the shaft as well as the spine emanating from it, and in one case, a single terminal innervated spines originating from different dendrites. In all other cases, only one postsynaptic element was revealed. The average diameter of all of the postsynaptic elements was 981.47nm (n = 21; range, 404–1793 nm). When measured separately, the average diameter of the identified postsynaptic dendritic shafts was 1426.77 nm (n = 9; range, 979–1793 nm), whereas the same value for postsynaptic spines was 617.1 nm (n = 10; range, 404–834 nm). Six of the 10 spines were different from the classical spines of cortical or striatal neurons in that they contained mitochondria and were quite large (average major diameter, 1147.83 nm; range, 834–1420 nm). All spines examined in serial sections received only a single excitatory input. These data indicate that the two major targets of cortical terminals in the ZI neuropil are thick dendrites (Fig. 8) and a specialized type of bulbous spines contacted by single cortical terminals.
Of the 16 cortico-incertal terminals, 12 innervated their postsynaptic targets with multiple synapses, but the exact number of the release sites could be established only in 11 cases; in the other five cases, the chromogene did not allow to determine the number of active zones. The average number of active zones was 2.09 (range, 1–4). The length of the individual asymmetrical synapses were unusually large (mean, 532.23 nm; range, 300–950 nm; n = 24) (Fig. 8E).
Discussion
The results of this study demonstrated that the firing pattern of ZI neurons is significantly modulated by the descending cortical inputs during rhythmic cortical activity. Cortical slow oscillations, HVSs, and 5–9 Hz activity effectively altered the discharge patterns of ZI cells, but with a high degree of variability among ZI neurons. The large dendritic span and the long dendritic segments of ZI neurons and the large cortico-incertal synapses may form the morphological substrate of the observed physiological patterns.
Cortical control of ZI activity
The synchrony between single-cell and cortical activity is usually explained by intrinsic pacemaker properties and synaptic interactions. The generator of both the slow and the 5–9 Hz oscillations is the neocortex (Steriade et al., 1993c; Pinault, 2003). Cortical neurons, including corticofugal layer V neurons, fire in tight synchrony with the active phase of these oscillations (Steriade et al., 1993a; D. Pinault, unpublished observation). The thalamus is also actively involved in the synchronization of these LFP events (Steriade et al., 1993b; Hughes et al., 2002; Pinault, 2003). HVSs are believed to arise as an interaction between the thalamus and neocortex. ZI is a target of the descending cortical paths but receives no thalamic input or other major forebrain afferents. Thus, the most likely source of rhythmic drive to ZI is the descending cortical fibers. These afferents arise from the layer V pyramidal cells of widespread cortical regions (Mitrofanis and Mikuletic, 1999). Our data confirm previous results demonstrating fast, glutamatergic activation of ZI cells after cortical stimulation (Richard et al., 2003; Parent, personal communication).
Exploration of intrinsic properties of the ZI neurons is limited. One study demonstrates the lack of low-threshold bursts in ZI cells (Zhang et al., 2003), which confirms the lack of 400–500 Hz bursts during slow oscillations in our experiments. ZI neurons were also found to respond to hyperpolarizing current with an inward sag current indicating Ih-mediated pacemaker currents in ZI cells (Zhang et al., 2003) and rebound actions potentials (Trageser et al., 2006). The contribution of these intrinsic features to phase-locking remains to be established.
Several ZI cells displayed hypersynchronous activity with the LFP during HVSs, which suggests the involvement of ZI in paroxysmal TC events. Indeed, TC cells of the intralaminar nuclei, which are postsynaptic to the GABAergic ZI cells (Bartho et al., 2002), displayed delayed firing relative to the cortical waves during spike and wave discharges in an experimental model of epilepsy (Seidenbecher and Pape, 2001), suggesting that phase-locked ZI cell firing may indeed alter the phase relationship of thalamic and cortical activity.
Certain ZI cells, however, displayed very little modulation by the cortical input, and neurons not responding to HVS-associated synchronous cortical volleys were nevertheless entrained by slow oscillation-related cortical activity. These observations can be explained by the selectivity in the cortico-incertal input, differential excitatory–inhibitory balance on single cells, or the heterogeneity of ZI cells. Similar heterogeneity in the firing pattern of ZI cells has been found recently in human parkinsonian patients (Merello et al., 2006).
Morphological background of the cortical influence
Both the dendritic architecture of ZI cells and the cortico-incertal terminals display several properties that probably help to establish the strong cortical modulation of single-cell activity. Most ZI cells had a polarized dendritic tree with extensive mediolateral extent. The orientation of the dendritic lamellae often ran parallel to the cortico-incertal collaterals, which helps to establish multiple contacts between a single cortical fiber and its postsynaptic ZI cell. Interestingly, cortical inputs from somatosensory, motor, and parietal cortical areas arrive in a topographic manner as mediolaterally restricted slabs (Mitrofanis and Mikuletic, 1999). The large dendritic fields of ZI cells apparently span territories with different cortical inputs, which will result in the convergence of distant cortical areas on a single cell; thus, ZI cells likely integrate synchronized cortical activity arising from distant sources.
The cortical fibers in ZI displayed features that are generally regarded as the signature of target selectivity (Freund and Antal, 1988; Acsady et al., 1996). Highly uneven distribution of the terminals along the axons and small clusters of terminals situated on a small stalk all indicate that cortico-incertal terminals sample the neuropil unevenly, and certain cell types or dendritic domains (i.e., proximal dendrites, spines) are selectively innervated. This suggests that the amount of cortical inputs varies from cell to cell, which may explain the variability in the degree of cortical synchronization among ZI cells.
All ZI cells had very few branch points along their dendrites and long large-diameter dendritic segments between the branch points. The cortical input mainly targeted thick dendrites or spines connected to them. The terminals had unusually large active zones. Because the size of the active zones is proportional with the number of postsynaptic receptors (Nusser et al., 1998), cortical excitation probably results in large-amplitude EPSPs in ZI cells. The resulting cortical EPSPs will invade the somatic region along the long, thick dendritic segments with little attenuation and high speed even when they arise at distant synapses.
In summary, our morphological data demonstrate that ZI neurons are optimized to effectively integrate various cortical (and subcortical; see below) signals impinging on distant sites of their dendritic tree. The organization of the dendritic structure may be one explanation why several incertal neurons were actually more coherent with cortical slow oscillation than TC cells, which evidently have active conductances to help synchronization (Hughes et al., 2002). The short dendritic span of relay cells (Ohara and Havton, 1994) allows sampling inputs from more restricted cortical areas. Distal EPSPs are attenuated more in TC cells during propagation to the soma along their thin dendrites (which receive the vast majority of the cortical inputs) with numerous branching points (Carnevale et al., 1997; Emri et al., 2001, 2003) than along thick ZI dendrites with few branch points.
ZI at the confluence of ascending and descending information
ZI is situated at the confluence of major ascending fiber tracts and the descending cortical input. Indeed, ZI has been reviewed recently as having connections with “almost every center of the neuroaxis” (Mitrofanis, 2005). Ascending trigeminal inputs have been shown to innervate GABAergic ZI cells with large terminals and multiple release sites (Lavallee et al., 2005), and ZI neurons are known to respond to peripheral stimulation with fast onset (Nicolelis et al., 1992; Lavallee et al., 2005). In our study, ZI neurons that showed synchronous firing with cortical activity also displayed peripheral receptive fields (data not shown), demonstrating the convergence of ascending and descending inputs on the same ZI cell. These data indicate that neurons downstream to ZI will be modulated by the combination of arousal-dependent tonic activity and sensory and cortically induced signals.
GABAergic efferents to the thalamus: comparisons with the basal ganglia
From the point of view of the thalamus, ZI and APT are parallel systems compared with the basal ganglia output nuclei. All of these nuclei transfer cortical signals as strong “extrareticular” GABAergic input to the thalamus, which significantly affects the firing behavior of relay cells (Ueki, 1983; Bokor et al., 2005; Lavallee et al., 2005). Basal ganglia target thalamic motor nuclei (Deniau et al., 1992; Sakai et al., 1998), whereas ZI and APT mainly innervate sensory territories (Bartho et al., 2002; Bokor et al., 2005). Importantly, under normal conditions, the neuronal activity of basal ganglia output nuclei (substantia nigra pars reticulata and entopedunclar nucleus) does not show strong synchrony with the cortical slow oscillations (Belluscio et al., 2003; Parr-Brownlie et al., 2005). In contrast, a sizeable portion of both APT (Bokor et al., 2005) and ZI cells (present study) are under the influence of cortical activity. This suggests that the strength of cortical effect on the extrareticular GABAergic control of TC cells may vary in different (motor vs sensory) loops and that under normal circumstances, sensory loops may more effectively resonate to cortical signals.
Reasons to synchronize
ZI has strong GABAergic output to several brain regions including higher-order thalamic nuclei (Bartho et al., 2002), superior colliculus (Ficalora and Mize, 1989; Kim et al., 1992), pontine nuclei (Border et al., 1986), and lower brainstem (Nicolelis et al., 1992). Recent data indicate that incerto-thalamic GABAergic fibers effectively block sensory transmission and significantly reduce spontaneous activity in their thalamic targets (Trageser and Keller, 2004; Lavallee et al., 2005). Indeed, in the posterior nucleus of the thalamus, a reliable relay of whisker stimulation could only be achieved after the lesion of ZI (Lavallee et al., 2005). This raises the important question how incertal inhibition is regulated in the intact, drug-free brain.
Recent studies demonstrated that asynchronous activity of interconnected GABAergic cells results in a random barrage of IPSPs, with the consequence of large resistance to action potential generation to incoming EPSPs (Foldy et al., 2004). This state is similar to what has been observed in intracellularly recorded relay cells of the posterior nucleus displaying continuous bombardment of IPSPs and a very low firing rate (Lavallee et al., 2005). However, as synchrony increases among the GABAergic cells, the downstream cells are exposed to temporal windows of IPSP barrages, and action potentials can be initiated during the IPSP-free periods. We propose that rhythmic LFP signals [e.g., during whisking (Crochet and Petersen, 2006)] may help to synchronize the firing activity of GABAergic ZI cells. As a result of this top-down cortical signal, ZI firing will be clustered, which may allow the opening of postsynaptic thalamic (or other subcortical) “gate” via generating short IPSP-free epochs. This will result in a rhythmic or time-locked sensory transmission of relay cells, which is contingent on cortical activity.
Footnotes
This work was supported by the Wellcome Trust (L.A. is the recipient of a Wellcome Trust International Senior Research Fellowship), the Hungarian Scientific Research Fund (OTKA T 049100), the Hungarian–French Scientific and Technological Cooperation Program, Institut du Cerveau et de la Moelle épiniere, and the National Institutes of Health. D.P. was supported by the French Institute of Health and Medical Research (Institut National de la Santé et de la Recherche Médicale), the University of Louis Pasteur (Faculté de Médecine), the Fondation Française pour la Recherche sur l'Epilepsie, the Electricité de France, the Marie Curie Research Training Program, and a Programme d'Actions Intégrées franco-hongrois (PAI Balaton, Egide, Paris, France). We thank Krisztina Faddi and Győző Goda for excellent technical assistance.
References
- Acsady L, Gorcs TJ, Freund TF. Different populations of vasoactive intestinal polypeptide-immunoreactive interneurons are specialized to control pyramidal cells or interneurons in the hippocampus. Neuroscience. 1996;73:317–334. doi: 10.1016/0306-4522(95)00609-5. [DOI] [PubMed] [Google Scholar]
- Alusi SH, Aziz TZ, Glickman S, Jahanshahi M, Stein JF, Bain PG. Stereotactic lesional surgery for the treatment of tremor in multiple sclerosis: a prospective case-controlled study. Brain. 2001;124:1576–1589. doi: 10.1093/brain/124.8.1576. [DOI] [PubMed] [Google Scholar]
- Babel TB, Warnke PC, Ostertag CB. Immediate and long term outcome after infrathalamic and thalamic lesioning for intractable Tourette's syndrome. J Neurol Neurosurg Psychiatry. 2001;70:666–671. doi: 10.1136/jnnp.70.5.666. [DOI] [PMC free article] [PubMed] [Google Scholar]
- Bartho P, Freund TF, Acsady L. Selective GABAergic innervation of thalamic nuclei from zona incerta. Eur J Neurosci. 2002;16:999–1014. doi: 10.1046/j.1460-9568.2002.02157.x. [DOI] [PubMed] [Google Scholar]
- Belluscio MA, Kasanetz F, Riquelme LA, Murer M Gustavo. Spreading of slow cortical rhythms to the basal ganglia output nuclei in rats with nigrostriatal lesions. Eur J Neurosci. 2003;17:1046–1052. doi: 10.1046/j.1460-9568.2003.02543.x. [DOI] [PubMed] [Google Scholar]
- Bevan MD, Magill PJ, Terman D, Bolam JP, Wilson CJ. Move to the rhythm: oscillations in the subthalamic nucleus-external globus pallidus network. Trends Neurosci. 2002;25:525–531. doi: 10.1016/s0166-2236(02)02235-x. [DOI] [PubMed] [Google Scholar]
- Bokor H, Frere SG, Eyre MD, Slezia A, Ulbert I, Luthi A, Acsady L. Selective GABAergic control of higher-order thalamic relays. Neuron. 2005;45:929–940. doi: 10.1016/j.neuron.2005.01.048. [DOI] [PubMed] [Google Scholar]
- Border BG, Kosinski RJ, Azizi SA, Mihailoff GA. Certain basilar pontine afferent systems are GABA-ergic: combined HRP and immunocytochemical studies in the rat. Brain Res Bull. 1986;17:169–179. doi: 10.1016/0361-9230(86)90113-9. [DOI] [PubMed] [Google Scholar]
- Buzsaki G. The thalamic clock: emergent network properties. Neuroscience. 1991;41:351–364. doi: 10.1016/0306-4522(91)90332-i. [DOI] [PubMed] [Google Scholar]
- Carnevale NT, Tsai KY, Claiborne BJ, Brown TH. Comparative electrotonic analysis of three classes of rat hippocampal neurons. J Neurophysiol. 1997;78:703–720. doi: 10.1152/jn.1997.78.2.703. [DOI] [PubMed] [Google Scholar]
- Contreras D, Steriade M. Cellular basis of EEG slow rhythms: a study of dynamic corticothalamic relationships. J Neurosci. 1995;15:604–622. doi: 10.1523/JNEUROSCI.15-01-00604.1995. [DOI] [PMC free article] [PubMed] [Google Scholar]
- Crochet S, Petersen CC. Correlating whisker behavior with membrane potential in barrel cortex of awake mice. Nat Neurosci. 2006;9:608–610. doi: 10.1038/nn1690. [DOI] [PubMed] [Google Scholar]
- Deniau JM, Kita H, Kitai ST. Patterns of termination of cerebellar and basal ganglia efferents in the rat thalamus. Strictly segregated and partly overlapping projections. Neurosci Lett. 1992;144:202–206. doi: 10.1016/0304-3940(92)90750-2. [DOI] [PubMed] [Google Scholar]
- Emri Z, Antal K, Gulyas AI, Megias M, Freund TF. Electrotonic profile and passive propagation of synaptic potentials in three subpopulations of hippocampal CA1 interneurons. Neuroscience. 2001;104:1013–1026. doi: 10.1016/s0306-4522(01)00136-1. [DOI] [PubMed] [Google Scholar]
- Emri Z, Antal K, Crunelli V. The impact of corticothalamic feedback on the output dynamics of a thalamocortical neurone model: the role of synapse location and metabotropic glutamate receptors. Neuroscience. 2003;117:229–239. doi: 10.1016/s0306-4522(02)00759-5. [DOI] [PubMed] [Google Scholar]
- Ficalora AS, Mize RR. The neurons of the substantia nigra and zona incerta which project to the cat superior colliculus are GABA immunoreactive: a double-label study using GABA immunocytochemistry and lectin retrograde transport. Neuroscience. 1989;29:567–581. doi: 10.1016/0306-4522(89)90131-0. [DOI] [PubMed] [Google Scholar]
- Foldy C, Aradi I, Howard A, Soltesz I. Diversity beyond variance: modulation of firing rates and network coherence by GABAergic subpopulations. Eur J Neurosci. 2004;19:119–130. doi: 10.1046/j.1460-9568.2003.03096.x. [DOI] [PubMed] [Google Scholar]
- Freund TF, Antal M. GABA-containing neurons in the septum control inhibitory interneurons in the hippocampus. Nature. 1988;336:170–173. doi: 10.1038/336170a0. [DOI] [PubMed] [Google Scholar]
- Guillery RW. Branching thalamic afferents link action and perception. J Neurophysiol. 2003;90:539–548. doi: 10.1152/jn.00337.2003. [DOI] [PubMed] [Google Scholar]
- Guillery RW. Anatomical pathways that link perception and action. Prog Brain Res. 2005;149:235–256. doi: 10.1016/S0079-6123(05)49017-2. [DOI] [PubMed] [Google Scholar]
- Hughes SW, Cope DW, Blethyn KL, Crunelli V. Cellular mechanisms of the slow (<1 Hz) oscillation in thalamocortical neurons in vitro. Neuron. 2002;33:947–958. doi: 10.1016/s0896-6273(02)00623-2. [DOI] [PubMed] [Google Scholar]
- Kasanetz F, Riquelme LA, Murer MG. Disruption of the two-state membrane potential of striatal neurones during cortical desynchronisation in anaesthetised rats. J Physiol (Lond) 2002;543:577–589. doi: 10.1113/jphysiol.2002.0024786. [DOI] [PMC free article] [PubMed] [Google Scholar]
- Kim U, Gregory E, Hall WC. Pathway from the zona incerta to the superior colliculus in the rat. J Comp Neurol. 1992;321:555–575. doi: 10.1002/cne.903210405. [DOI] [PubMed] [Google Scholar]
- Krauss JK, Mundinger F. Functional stereotactic surgery for hemiballism. J Neurosurg. 1996;85:278–286. doi: 10.3171/jns.1996.85.2.0278. [DOI] [PubMed] [Google Scholar]
- Lavallee P, Urbain N, Dufresne C, Bokor H, Acsady L, Deschenes M. Feedforward inhibitory control of sensory information in higher-order thalamic nuclei. J Neurosci. 2005;25:7489–7498. doi: 10.1523/JNEUROSCI.2301-05.2005. [DOI] [PMC free article] [PubMed] [Google Scholar]
- Magill PJ, Bolam JP, Bevan MD. Relationship of activity in the subthalamic nucleus-globus pallidus network to cortical electroencephalogram. J Neurosci. 2000;20:820–833. doi: 10.1523/JNEUROSCI.20-02-00820.2000. [DOI] [PMC free article] [PubMed] [Google Scholar]
- Merello M, Tenca E, Cerquetti D. Neuronal activity of the zona incerta in Parkinson's disease patients. Mov Disord. 2006;21:937–943. doi: 10.1002/mds.20834. [DOI] [PubMed] [Google Scholar]
- Mitrofanis J. Some certainty for the “zone of uncertainty”? Exploring the function of the zona incerta. Neuroscience. 2005;130:1–15. doi: 10.1016/j.neuroscience.2004.08.017. [DOI] [PubMed] [Google Scholar]
- Mitrofanis J, Mikuletic L. Organisation of the cortical projection to the zona incerta of the thalamus. J Comp Neurol. 1999;412:173–185. [PubMed] [Google Scholar]
- Murata J, Kitagawa M, Uesugi H, Saito H, Iwasaki Y, Kikuchi S, Tashiro K, Sawamura Y. Electrical stimulation of the posterior subthalamic area for the treatment of intractable proximal tremor. J Neurosurg. 2003;99:708–715. doi: 10.3171/jns.2003.99.4.0708. [DOI] [PubMed] [Google Scholar]
- Muthuswamy J, Thakor NV. Spectral analysis methods for neurological signals. J Neurosci Methods. 1998;83:1–14. doi: 10.1016/s0165-0270(98)00065-x. [DOI] [PubMed] [Google Scholar]
- Nandi D, Chir M, Liu X, Bain P, Parkin S, Joint C, Winter J, Stein J, Scott R, Gregory R, Aziz T. Electrophysiological confirmation of the zona incerta as a target for surgical treatment of disabling involuntary arm movements in multiple sclerosis: use of local field potentials. J Clin Neurosci. 2002;9:64–68. doi: 10.1054/jocn.2001.1012. [DOI] [PubMed] [Google Scholar]
- Nicolelis MA, Chapin JK, Lin RC. Somatotopic maps within the zona incerta relay parallel GABAergic somatosensory pathways to the neocortex, superior colliculus, and brainstem. Brain Res. 1992;577:134–141. doi: 10.1016/0006-8993(92)90546-l. [DOI] [PubMed] [Google Scholar]
- Nusser Z, Hajos N, Somogyi P, Mody I. Increased number of synaptic GABA(A) receptors underlies potentiation at hippocampal inhibitory synapses. Nature. 1998;395:172–177. doi: 10.1038/25999. [DOI] [PubMed] [Google Scholar]
- Ohara PT, Havton LA. Dendritic architecture of rat somatosensory thalamocortical projection neurons. J Comp Neurol. 1994;341:159–171. doi: 10.1002/cne.903410203. [DOI] [PubMed] [Google Scholar]
- Parr-Brownlie LC, Bergstrom DA, Itoga CAD, Hu CPS, Smith JR. Enhanced slow oscillations in neuronal activity of basal ganglia output nuclei after dopamine cell lesion in urethane anesthetized rats: exploring effects on ventrolateral thalamus and motor cortex. Soc Neurosci Abstr. 2005;31:299–214. [Google Scholar]
- Patel NK, Heywood P, O'Sullivan K, McCarter R, Love S, Gill SS. Unilateral subthalamotomy in the treatment of Parkinson's disease. Brain. 2003;126:1136–1145. doi: 10.1093/brain/awg111. [DOI] [PubMed] [Google Scholar]
- Pinault D. A novel single-cell staining procedure performed in vivo under electrophysiological control: morpho-functional features of juxtacellularly labeled thalamic cells and other central neurons with biocytin or Neurobiotin. J Neurosci Methods. 1996;65:113–136. doi: 10.1016/0165-0270(95)00144-1. [DOI] [PubMed] [Google Scholar]
- Pinault D. Cellular interactions in the rat somatosensory thalamocortical system during normal and epileptic 5–9 Hz oscillations. J Physiol (Lond) 2003;552:881–905. doi: 10.1113/jphysiol.2003.046573. [DOI] [PMC free article] [PubMed] [Google Scholar]
- Pinault D, Vergnes M, Marescaux C. Medium-voltage 5–9-Hz oscillations give rise to spike-and-wave discharges in a genetic model of absence epilepsy: in vivo dual extracellular recording of thalamic relay and reticular neurons. Neuroscience. 2001;105:181–201. doi: 10.1016/s0306-4522(01)00182-8. [DOI] [PubMed] [Google Scholar]
- Pinault D, Slezia A, Acsady L. Corticothalamic 5–9 Hz oscillations are more pro-epileptogenic than sleep spindles in rats. J Physiol (Lond) 2006;574:209–227. doi: 10.1113/jphysiol.2006.108498. [DOI] [PMC free article] [PubMed] [Google Scholar]
- Plaha P, Ben-Shlomo Y, Patel NK, Gill SS. Stimulation of the caudal zona incerta is superior to stimulation of the subthalamic nucleus in improving contralateral parkinsonism. Brain. 2006;129:1732–1747. doi: 10.1093/brain/awl127. [DOI] [PubMed] [Google Scholar]
- Richard SL, Tremblay E, Hirsch E, Feger J, Parent A. Glutamatergic neurotransmission in the rat zona incerta: electrophysiological, pharmacological and immunohistochemical study. Soc Neurosci Abstr. 2003;29:601–8. [Google Scholar]
- Sakai ST, Grofova I, Bruce K. Nigrothalamic projections and nigrothalamocortical pathway to the medial agranular cortex in the rat: single- and double-labeling light and electron microscopic studies. J Comp Neurol. 1998;391:506–525. doi: 10.1002/(sici)1096-9861(19980222)391:4<506::aid-cne7>3.0.co;2-4. [DOI] [PubMed] [Google Scholar]
- Seidenbecher T, Pape HC. Contribution of intralaminar thalamic nuclei to spike-and-wave-discharges during spontaneous seizures in a genetic rat model of absence epilepsy. Eur J Neurosci. 2001;13:1537–1546. doi: 10.1046/j.0953-816x.2001.01537.x. [DOI] [PubMed] [Google Scholar]
- Steriade M, Nunez A, Amzica F. A novel slow (<1 Hz) oscillation of neocortical neurons in vivo: depolarizing and hyperpolarizing components. J Neurosci. 1993a;13:3252–3265. doi: 10.1523/JNEUROSCI.13-08-03252.1993. [DOI] [PMC free article] [PubMed] [Google Scholar]
- Steriade M, Contreras D, Curro Dossi R, Nunez A. The slow (<1 Hz) oscillation in reticular thalamic and thalamocortical neurons: scenario of sleep rhythm generation in interacting thalamic and neocortical networks. J Neurosci. 1993b;13:3284–3299. doi: 10.1523/JNEUROSCI.13-08-03284.1993. [DOI] [PMC free article] [PubMed] [Google Scholar]
- Steriade M, McCormick DA, Sejnowski TJ. Thalamocortical oscillations in the sleeping and aroused brain. Science. 1993c;262:679–685. doi: 10.1126/science.8235588. [DOI] [PubMed] [Google Scholar]
- Torrence C, Compo G. A practical guide to wavelet analysis. Bull Am Meteorol Soc. 1998;79:61–78. [Google Scholar]
- Trageser JC, Keller A. Reducing the uncertainty: gating of peripheral inputs by zona incerta. J Neurosci. 2004;24:8911–8915. doi: 10.1523/JNEUROSCI.3218-04.2004. [DOI] [PMC free article] [PubMed] [Google Scholar]
- Trageser JC, Burke KA, Masri R, Li Y, Sellers L, Keller A. State-dependent gating of sensory inputs by zona incerta. J Neurophysiol. 2006;96:1456–1463. doi: 10.1152/jn.00423.2006. [DOI] [PMC free article] [PubMed] [Google Scholar]
- Tseng KY, Kasanetz F, Kargieman L, Riquelme LA, Murer MG. Cortical slow oscillatory activity is reflected in the membrane potential and spike trains of striatal neurons in rats with chronic nigrostriatal lesions. J Neurosci. 2001;21:6430–6439. doi: 10.1523/JNEUROSCI.21-16-06430.2001. [DOI] [PMC free article] [PubMed] [Google Scholar]
- Ueki A. The mode of nigro-thalamic transmission investigated with intracellular recording in the cat. Exp Brain Res. 1983;49:116–124. doi: 10.1007/BF00235546. [DOI] [PubMed] [Google Scholar]
- Veinante P, Lavallee P, Deschenes M. Corticothalamic projections from layer 5 of the vibrissal barrel cortex in the rat. J Comp Neurol. 2000;424:197–204. doi: 10.1002/1096-9861(20000821)424:2<197::aid-cne1>3.0.co;2-6. [DOI] [PubMed] [Google Scholar]
- Yelnik J, Damier P, Demeret S, Gervais D, Bardinet E, Bejjani BP, Francois C, Houeto JL, Arnule I, Dormont D, Galanaud D, Pidoux B, Cornu P, Agid Y. Localization of stimulating electrodes in patients with Parkinson disease by using a three-dimensional atlas-magnetic resonance imaging coregistration method. J Neurosurg. 2003;99:89–99. doi: 10.3171/jns.2003.99.1.0089. [DOI] [PubMed] [Google Scholar]
- Zhang L, Molnar M, Jones EG. Intrinsic and synaptic properties of GABAergic neurons in zona incerta and reticular nucleus. Soc Neurosci Abstr. 2003;29:60–64. [Google Scholar]