

Abstract
Background
Obesity and insulin resistance are growing problems in HIV-positive (HIV+) women receiving highly active antiretroviral therapy (HAART).
Objective
The objective was to determine the contribution of adipose tissue (AT) enlargement and distribution to the presence of insulin resistance in obese HIV+ women.
Design
Whole-body intermuscular AT (IMAT), visceral AT (VAT), subcutaneous AT (SAT), and SAT distribution (leg versus upper body) were measured by whole-body magnetic resonance imaging. Insulin sensitivity (SI) was measured with an intravenous glucose tolerance test in obese HIV+ women recruited because of their desire to lose weight (n = 17) and in obese healthy controls (n = 32).
Results
The HIV+ women had relatively less whole-body SAT and more VAT and IMAT than did the controls (P < 0.05 for all). A significant interaction by HIV status was observed for the relation of total SAT with SI (P < 0.001 for the regression’s slope interactions after adjustment for age, height, and weight). However, relations of IMAT, VAT, and SAT distribution (leg SAT as a percentage of total SAT; leg SAT%) with SI did not differ significantly between groups. For both groups combined, the best model predicting a low SI included significant contributions by both high IMAT and low leg SAT%, independent of age, height, and weight, and no interaction between groups was observed (overall r2 = 0.44, P = 0.0003).
Conclusion
In obese HIV+ women, high whole-body IMAT and low leg SAT% distribution are independently associated with insulin resistance.
Keywords: Subcutaneous adipose tissue, intermuscular adipose tissue, adipose tissue distribution, insulin resistance, HIV infection
INTRODUCTION
Insulin resistance is a central feature of the metabolic syndrome (1, 2). Generalized and regional lack of body fat in congenital lipodystrophies (3) and upper-body fat accumulation in obesity (4) have been shown to be associated with insulin resistance in HIV-positive (HIV+) individuals. A syndrome of fat redistribution consisting of peripheral fat loss (face, limbs, and buttocks) and central fat accumulation (abdomen, breast, and dorsocervical area) has been described in HIV+ men and women (5, 6). HIV+ men and women with fat redistribution were more insulin resistant than were those without such redistribution (7–19). Obesity has emerged as a growing problem in HIV+ individuals receiving highly active antiretroviral therapy (HAART) (20), particularly in women (21, 22). The influence of the enlargement and distribution of various adipose tissue (AT) compartments on the presence of insulin resistance has not been clearly established in obese HIV+ women. However, its influence could be important for assessing the response to interventions that alter body fat, which may be useful in HIV-negative (HIV−) but not in obese HIV+ women (5, 23–25).
Most studies reporting on the relation between fat distribution and insulin resistance have compared groups of HIV+ individuals with or without lipodystrophy as determined a priori by observational criteria (7, 8, 11–13, 17–19). Studies using continuous variables (9–11, 14–16) found correlations between lipodystrophy measured by dual-energy X-ray absorptiometry (DXA), ie, more trunk fat or less leg fat as a percentage of total body fat and insulin resistance in both HIV+ men and women (9, 11, 15–19). Whether these associations were similar in HIV+ and HIV− cohorts has not been noted (15). DXA did not separate fat in subcutaneous AT (SAT) from fat in the visceral AT (VAT) compartment or inside muscle and organs (26–28). Separation of AT depots at the waist level by computed tomography (CT) or magnetic resonance imaging (MRI) provided additional information (26, 27); however, the findings of both positive and negative associations of SAT and VAT areas at the waist level with insulin resistance (14, 16, 26, 27, 29, 30) may have been due to differences in sex or degree of overweight (29, 31). In previous studies in patients with HIV lipodystrophy, in which whole-body AT depots were measured by whole-body MRI, relations to corresponding insulin resistance indexes were not reported (32–35). In particular, a relation of insulin resistance to SAT distribution (ie, SAT of legs versus upper body) and to IMAT [ie, subfascial, intermuscular AT (IMAT)] measured by whole-body MRI has not been reported previously in HIV+ women (32–35). Higher IMAT was found to be independently associated with insulin resistance in healthy premenopausal women (28), and decreases in leg fat or thigh SAT were shown to be independently associated with unfavorable glucose and lipid concentrations in larger cohorts not characterized by HIV status (36, 37).
Therefore, the overall aim of this study was to determine the relations of total SAT, VAT, IMAT, and SAT distribution (legs versus upper body) measured by whole-body MRI in obese HIV+ women with insulin resistance. Specifically, we asked whether IMAT and SAT distribution were independently associated with insulin resistance in obese HIV+ women. We also determined whether such relations were similar to those found in healthy controls.
SUBJECTS AND METHODS
HIV+ subjects
The HIV+ women were recruited for a study of weight loss and exercise. The data presented here are the baseline data from a subset of the recruited subjects who were not diabetic and who had adequate venous access for testing (n = 17). The body mass index (BMI; in kg/m2) of the women was 30–38. Three of the women were non-Hispanic white, 3 were Hispanic, and 11 were African American. The HIV+ women were obese (BMI > 30) and clinically stable. Most of the subjects were on an antiretroviral drug regimen for ≥4 wk before enrollment and had no plans to change the regimen during the study period. The women were allowed to take their HIV medications as prescribed. Of the 17 HIV+ women whose data are presented here, 4 women were not receiving HAART, 13 were taking nucleoside reverse transcriptase inhibitors, 9 were taking protease inhibitors (PIs), and 9 were taking non-nucleoside reverse transcriptase inhibitors. Exclusion criteria were as follows: 1) any active opportunistic infection or malignancy, 2) pregnancy or breastfeeding, 3) uncontrolled hypertension, 4) history of MRI or any condition that would prevent exercise, 5) diabetes mellitus, and 6) a self-reported medical history of an eating disorder (eg, anorexia nervosa or bulimia nervosa), gallbladder disease, renal disease, active substance abuse, or methadone treatment. The women chosen for the present analysis were either pre- or perimenopausal and none of them were receiving estrogen replacement therapy. All subjects had an intravenous glucose tolerance test (IVGTT) performed within 10 d of the beginning of a regular menstrual period. The women were also weight stable for ≥6 wk before the measurements.
Healthy controls
The women in the control group 1 (n = 12) and in control group 2 (n = 20) were recruited for 2 other studies. Data from measurements that were identical to those performed for the HIV+ women (except for the insulin sensitivity measurements in control group 2; see below) were used in the analyses. For both control groups, everyone with a BMI ≥ 30 (obese, as in the HIV+ cohort) and for whom data were available was included in the study. In group 1, 5 of the women were non-Hispanic white, 1 was Hispanic, and 6 were African American. In group 2, 7 of the women were non-Hispanic white and 13 were African American. The women in both control groups were weight stable for 6 mo before the studies, were healthy, were premenopausal, were non-diabetic, had regular menstrual cycles, reported no medical problems, reported no symptoms, were taking no medications, and had normal results from blood count and chemistry panels. No HIV test was performed in these groups. All subjects signed an informed consent form; the protocol and consent form were approved by the St Luke’s–Roosevelt Hospital Institutional Review Board and Radiation Safety Committee.
Anthropometric measures
Body weight was measured to the nearest 0.1 kg (Avery Weigh-Tronix, Fairmont, MN) and height to the nearest 0.5 cm with a stadiometer (Holtain, Crosswell, United Kingdom).
Whole-body magnetic resonance imaging
AT compartments and skeletal muscle (SM) volumes were measured on a 1.5T MRI scanner (6X Horizon; General Electric, Milwaukee, WI) as described previously (38–40). The entire body was visualized on a scout coronal image (6X Horizon), and the axial level of L4–L5 was identified. The scans were acquired by using contiguous axial slices of 10-mm thickness at 40-mm intervals below L4–L5 to the toes, and above this level to the fingertips (≈40–50 images for women of average height). Images were then analyzed on a PC platform as described (28, 32–35, 38–40). Briefly, the procedure for calculating AT volume is to first measure the relevant tissue area in each slice with the use of threshold methods and manual delineation to draw boundaries among different tissues. The volume between slices is extrapolated from the area measurements. The following volumes were calculated: VAT, total SAT, and IMAT. We defined IMAT as the AT visible between the muscle groups and beneath the muscle fascia (38). The gray level intensity (threshold value) of the AT in the SAT region was first determined and used as reference. This threshold value was reduced by 20% to identify IMAT threshold.
In addition to whole-body results, regional values for subcutaneous AT were determined for the arms, legs, and upper and lower trunk. The regional subcutaneous AT volumes used in this article delineated SAT volume in the legs (leg SAT, ie, all SAT inferior to the greater trochanter, including the greater trochanter area) and SAT volume in the upper body (upper SAT, ie, all SAT superior to the level of the trochanter, including the arms). The MRI scans were read at the New York Obesity Research Center Image Reading Center at St Luke’ Roosevelt Hospital Center. The CV on repeated readings of the same 2 scans by observers analyzing the images was 3.8% for TAT, 3.4% for SAT, 9.7% for VAT, 2.2% for SM, and 7.3% (estimate) for IMAT.
Insulin sensitivity index determined by intravenous glucose tolerance test
The Bergman minimal model was used to quantify SI (MINMOD 2.0; copyright RN Bergman, 1986; 41). This measurement was made in all subjects during the follicular phase of the menstrual cycle. Glucose (0.3 g/kg, 50% dextrose injection; Abbott, North Chicago, IL) was administered intravenously at time 0 min. This was followed by an injection of tolbutamide (Orinase Diagnostic, Upjohn, Kalamazoo, MI) at time 20 min in control group 2. In the HIV+ group and in control group 1, 0.03 units insulin/kg (Humulin R; Lilly Inc, Indianapolis, IN) was used due to the lack of availability of tolbutamide. Blood samples, collected through a catheter placed in the contralateral arm, occurred at fasting and at 26 time points over the 3 h after glucose administration. Plasma glucose and insulin were measured in all samples, and the SI was calculated from these values with the nonlinear mathematical model of glucose disappearance. Studies in the literature have shown that the SI measured at 20 min in the same subject with the use of IVGTT with intravenous insulin is lower than the SI measured with the use of IVGTT with intravenous tolbutamide; however, the difference between methods (14%) appears to be constant throughout the range of insulin sensitivity in nondiabetic subjects (42). Therefore, we used a 14% lower value than that determined by the computer program for the subjects who had an IVGTT with tolbutamide at 20 min (control group 2), and the data were pooled. Furthermore, we computed possible interactions with the IVGTT method using a categorical factor denoting the IVGTT method for all relevant analyses (see Data analysis below).
Data analysis
Data were expressed as means ± SDs for t test comparisons in the 3 experimental groups and were expressed as means ± SEMs for the analysis of covariance (ANCOVA) results. Log transformations were used for variables for which deviation from normality of distribution was found. Independent t tests were used to compare measurements in the HIV+ group with those of control groups 1 and 2. Because there were 3 groups being compared by t test, a Bonferroni adjustment was used. Regression lines between dependent variables and covariates were tested for interactions before ANCOVA was performed. A general linear model was used to test interactions between slopes of regression for continuous variables in the HIV+ group compared with the control groups. Although use of a mathematical correction to compute SI in control group 2 does not ensure that values would be comparable between groups, the literature suggests that rank-order correlation comparisons are preserved independently of the IVGTT method (42). In addition, as described above, a categorical factor denoting the IVGTT method (HIV+, HIV− group 1, and HIV− group 2) was entered in the ANCOVA and general linear model analyses of SI, and possible interactions were computed and reported if present. Analyses were done by using STATISTICA 6.0 (Statsoft Inc, Tulsa, OK). P < 0.05 was considered to be statistically significant.
RESULTS
Subject characteristics and whole-body MRI and metabolic measurements are shown in Table 1. The HIV+ women were less heavy and had less SAT than did the women in control group 1 but had significantly more VAT than did the women in both control groups (Table 1). Fasting glucose and insulin and insulin sensitivity values in the HIV+ group did not differ significantly from those of either control group.
TABLE 1.
Subject characteristics and whole-body magnetic resonance imaging (MRI) and metabolic measurements in HIV-positive (HIV+) and control women1
| HIV+ group (n = 17) | Control group 1 (n = 12) | Control group 2 (n = 20) | |
|---|---|---|---|
| Age (y) | 39.5 ± 7.5 | 36.7 ± 6.3 | 37.2 ± 6.4 |
| Weight (kg) | 91.5 ± 10.1 | 106.8 ± 9.92 | 91.7 ± 10.6 |
| BMI (kg/m2) | 34.8 ± 3.1 | 38.6 ± 2.82 | 34.1 ± 3.4 |
| SM (L)3 | 23.3 ± 3.6 | 25.0 ± 3.7 | 24.4 ± 3.3 |
| SAT (L)3 | 41.2 ± 9.8 | 52.9 ± 8.72 | 40.1 ± 6.8 |
| Upper SAT (L)4 | 24.3 ± 4.7 | 32.1 ± 5.02 | 23.4 ± 4.9 |
| Leg SAT (L)5 | 16.9 ± 5.6 | 20.8 ± 4.8 | 16.7 ± 3.0 |
| VAT (L)3 | 3.7 ± 1.2 | 2.4 ± 0.92 | 2.7 ± 1.02 |
| IMAT (L)3 | 2.3 ± 0.7 | 2.2 ± 0.5 | 1.9 ± 0.7 |
| Fasting glucose (pmol/L) | 5.4 ± 0.6 | 5.3 ± 0.4 | 5.2 ± 0.4 |
| Fasting insulin (pmol/L) | 132 ± 107 | 84 ± 21 | 86 ± 32 |
| SI (μU · mL−1 · 10−4 · min−1)6 | 1.6 ± 1.2 | 1.3 ± 0.9 | 2.2 ± 1.2 |
All values are x ¯ ± SD. SM, skeletal muscle; SAT, subcutaneous adipose tissue; VAT, visceral adipose tissue; IMAT, intermuscular adipose tissue; SI, insulin sensitivity index.
Significantly different from the HIV+ group, P < 0.0166.
Measured by whole-body MRI.
Includes SAT of the arms and trunk above the level of the greater trochanter.
Includes all SAT inferior to the level of the greater trochanter.
Calculated by the minimal model program (copyright RN Bergman, 1986; 41) from data obtained during intravenous glucose tolerance tests (insulin modified for the HIV+ group and control group 1 and tolbutamide modified for control group 2). Because a mathematical correction was used to calculate SI in control group 2 (42) and because of a lack of homogeneity of variances for fasting insulin, t tests (Bonferroni adjusted) were used for comparisons between the 3 groups.
The relative AT distribution (relative accumulation of AT in SAT, VAT, and IMAT compartments) in HIV+ women compared with that in the women in the 2 control groups combined is shown in Table 2. In contrast with Table 1, the data in the control groups were combined because measurement methods and group variances were homogenous. Data for individual AT compartment sizes (SAT, VAT, and IMAT) were adjusted for degree of overweight and for total AT. SAT was lower and both VAT and IMAT were higher in the HIV+ group than in the controls after adjustment for age, height, weight, and total AT (P < 0.05). Differences persisted after additional adjustment for SM volume. Upper- versus lower-body SAT distribution was calculated as leg SAT as a percentage of total SAT (leg SAT%). In unadjusted analyses, leg SAT% was not significantly different between the HIV+ group and the control group. However, the relation between leg SAT% and body weight or total AT differed significantly between the HIV+ and control groups (P < 0.05 for both). In the controls, correlations were r = −0.2 (P = 0.27) for body weight and r = −0.24 (P = 0.18) for total AT. In the HIV+ group, correlations were r = 0.47 (P = 0.054) for body weight and r = 0.64 (P = 0.006) for total AT, ie, lower values for leg SAT% were seen at lower degrees of adiposity in the HIV+ group, whereas this was not the case for the controls. Similar results were obtained for upper SAT as a % of total SAT (data not shown).
TABLE 2.
Adipose tissue distribution in HIV-positive (HIV+) and control women1
| HIV+ women (n = 17) | Control women (n = 32) | P | |
|---|---|---|---|
| SM (L)2 | 23.9 ± 0.7 | 24.4 ± 0.5 | 0.566 |
| SAT (L)3,4 | 42.8 ± 0.3 | 44.1 ± 0.2 | 0.003 |
| Leg SAT% (of total AT)5 | 35.0 ± 1.3 | 37.0 ± 1.0 | 0.21 |
| Leg SAT% (of total SAT)5 | 40.1 ± 1.3 | 40.8 ± 1.0 | 0.65 |
| VAT (L)3,4 | 3.5 ± 0.2 | 2.6 ± 0.2 | 0.007 |
| IMAT (L)3,4 | 2.4 ± 0.1 | 2.0 ± 0.1 | 0.043 |
All values are x ¯ ± SEM. SM, skeletal muscle; SAT, subcutaneous adipose tissue; VAT, visceral adipose tissue; IMAT, intermuscular adipose tissue. All SAT inferior to the level of the greater trochanter.
Values adjusted for age, height, and weight.
Measured by whole-body magnetic resonance imaging.
Values adjusted for age, height, weight, total AT, and SM.
Leg SAT as a percentage of total adipose tissue (SAT + VAT + IMAT) or as a percentage of total SAT. Values were unadjusted.
The relations of AT compartment sizes and AT distribution with SI are shown in the figures. Specifically, the relations of SI—adjusted for age, weight, and height—with total SAT are shown in Figure 1, with VAT are shown in Figure 2, with IMAT are shown in Figure 3, with leg SAT% are shown in Figure 4, and with VAT:SAT are shown in Figure 5. Analyses were also performed for upper SAT as a percentage of total SAT and for the absolute values of leg SAT and upper SAT, but no additional information was obtained. We computed the residual values of SI in a general linear model after adjustment for age, height, and weight. Because SI was measured with 2 different methods (using insulin for the HIV+ women and the women in control group 1 and using tolbutamide for those in control group 2), a group factor (HIV+ group, control group 1, and control group 2) was initially entered in the analyses. Because no interactions between the control groups were observed, the results are shown for the control groups combined, with HIV status (positive or negative) entered as a factor in the model. We determined whether any of the AT measures significantly contributed to the additional variance in SI after these adjustments and whether significant interactions were observed in these relations between the HIV+ and healthy controls.
FIGURE 1.
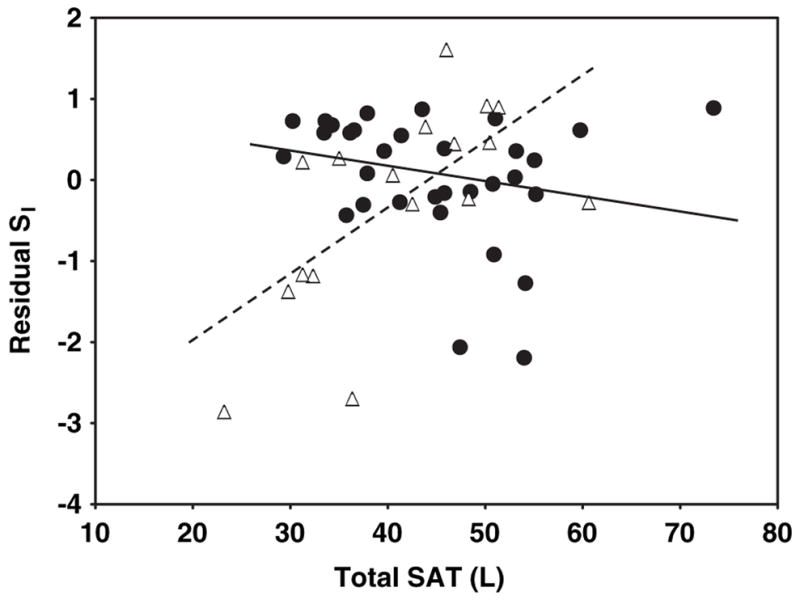
Relation between residual insulin sensitivity (SI) and total subcutaneous adipose tissue (SAT) in HIV-positive (HIV+; △) and control (●) women. SI values were log transformed for normality. Residual SI is the difference between the observed and the expected values of SI, calculated through multiple regression as a function of age, height, and weight. SAT was measured by whole-body magnetic resonance imaging. P < 0.001 for interaction of slopes by HIV status. r = 0.64 (P = 0.006) for HIV+ women and r = −0.22 (P = 0.2) for control women.
FIGURE 2.
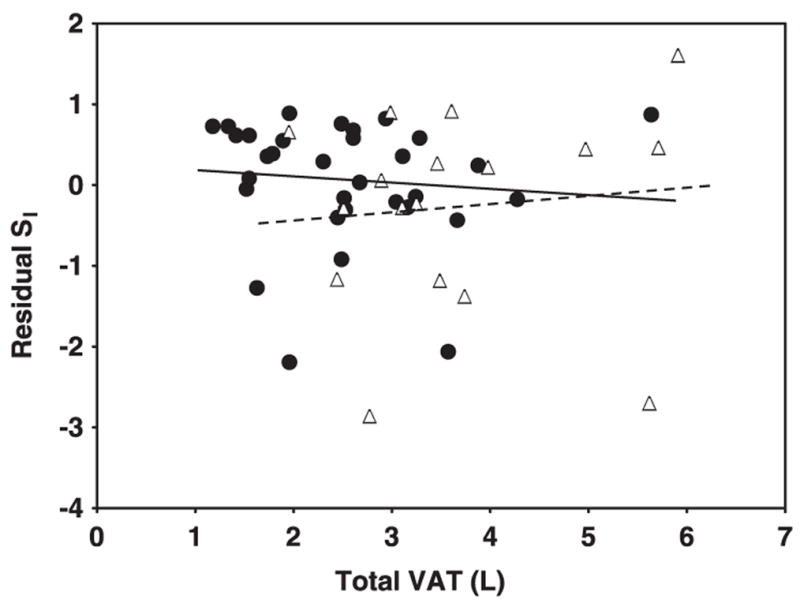
Relation between residual insulin sensitivity (SI) and visceral adipose tissue (VAT) in HIV-positive (HIV+; △) and control (●) women. SI values were log transformed for normality. Residual SI is the difference between the observed and the expected values of SI, calculated through multiple regression as a function of age, height, and weight. VAT was measured by whole-body magnetic resonance imaging. P = 0.54 for interaction of slopes by HIV status.
FIGURE 3.
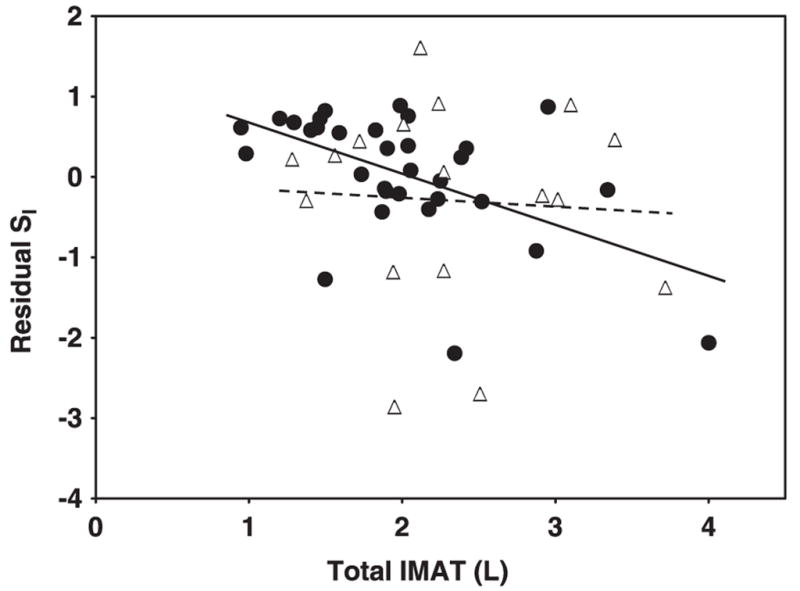
Relation between residual insulin sensitivity (SI) and inter-muscular adipose tissue (IMAT) in HIV-positive (HIV+; △) and control (●) women. SI values were log transformed for normality. Residual SI is the difference between the observed and the expected values of SI, calculated through multiple regression as a function of age, height, and weight. IMAT was measured by whole-body magnetic resonance imaging. P = 0.25 for interaction of slopes by HIV status.
FIGURE 4.
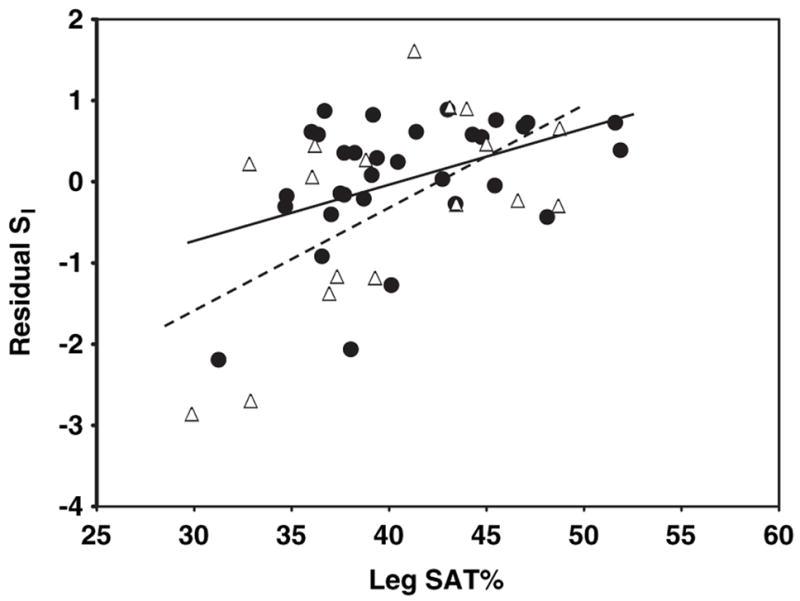
Relation between residual insulin sensitivity (SI) and sub-cutaneous adipose tissue (SAT) as a percentage of total SAT (leg SAT%) in HIV-positive (HIV+; △) and control (●) women. SI values were log transformed for normality. Residual SI is the difference between the observed and the expected values of SI, calculated through multiple regression as a function of age, height, and weight. Leg SAT (inferior to the greater trochanter) was measured by whole-body magnetic resonance imaging. P = .22 for interaction of slopes by HIV status.
FIGURE 5.
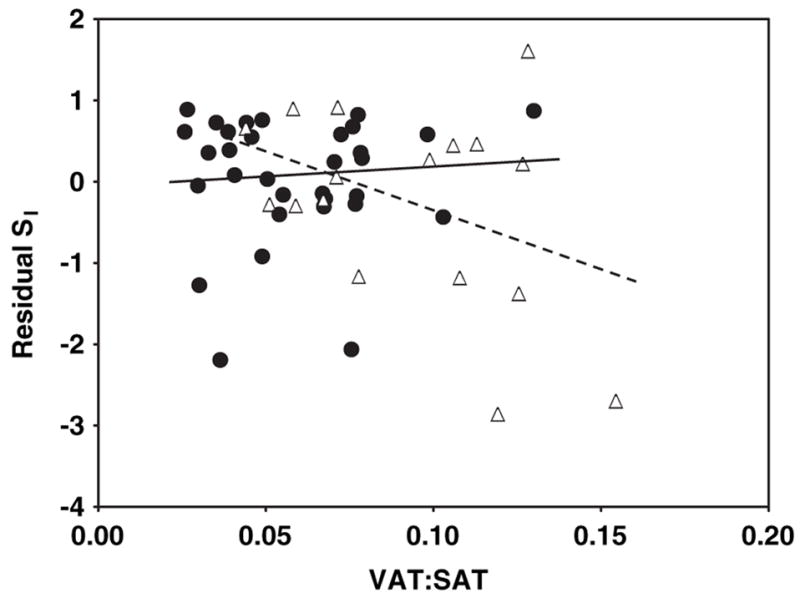
Relation between residual insulin sensitivity (SI) and the ratio of visceral to subcutaneous adipose tissue (VAT:SAT) in HIV-positive (HIV+; △) and control (●) women. SI values were log transformed for normality. Residual SI is the difference between the observed and the expected values of SI, calculated through multiple regression as a function of age, height, and weight. VAT:SAT was measured by whole-body magnetic resonance imaging. P = 0.08 for interaction of slopes by HIV status.
A significant interaction by HIV status was observed for the relations of total SAT with residual SI (after adjustment for age, height, and weight; Figure 1; P < 0.001 for slope interaction). For total SAT, a positive relation was observed in the HIV+ women (Figure 1; r = 0.64, P = 0.006), whereas the relation in the controls was negative albeit not significant (Figure 1; r = −0.22, P = 0.2). No significant interactions by HIV status were found for the relations of VAT, IMAT, leg SAT%, and VAT: SAT with residual SI: P = 0.54 (Figure 2), P = 0.25 (Figure 3), P = 0.22 (Figure 4), and P = 0.08 (Figure 5) for slope interactions, respectively. For both groups combined, the best model predicting a low SI included significant contributions by both high IMAT and low leg SAT% (independent of age, weight, and height) and with no interaction between groups (overall r2 = 0.44, P = 0.0003). Neither VAT nor VAT:SAT was independently associated with SI in any of the models.
DISCUSSION
Associations between insulin resistance and both fat reduction and fat accumulation (7–9, 11–19) have been reported in previous cross-sectional studies in HIV+ individuals with lipodystrophy. Determining which aspect of fat distribution best represents increased insulin resistance in this HIV+ population is more difficult to assess in obese individuals, and a separate evaluation by sex is needed (34). Therefore, in this study we reported the relation between AT distribution and insulin resistance in obese HIV+ women and in obese healthy controls. A unique aspect of our study was the measurement of whole-body IMAT and of SAT distribution, which allowed the separation of superficial SAT in the trunks and legs (upper-body SAT above the level of the greater trochanter and leg SAT below this level), independent of accumulation of IMAT, VAT, or other fat depots, such as intramyocellular lipid (28).
Consistent with previous reports, we found no decrease in the absolute amounts of AT but significant AT redistribution with relatively less SAT and more VAT and IMAT in the obese HIV+ women than in the controls (35). In previous studies that used DXA, higher absolute and relative amounts of trunk fat accumulation were found in HIV+ women with lipodystrophy (9–11, 32, 43), in contrast with lower absolute amounts of total body and lower relative amounts of limb fat in HIV+ men with lipodystrophy (10, 13, 14, 32, 44). By CT or MRI, the increase in trunk fat in HIV+ women was attributed to an increase in VAT (32–35). Although lower absolute amounts of SAT have not been reported in HIV+ women as they have been in men (13, 14, 33), a lower ratio of abdominal SAT to VAT area (13, 14, 32), which suggests fat redistribution, was found in both sexes. This is the first report to address IMAT measurements in obese HIV+ women. The limb fat characterized in previous studies that used DXA included both leg IMAT and intramyocellular lipid in addition to SAT (32–35). We found a relative increase in IMAT and a relative decrease in leg SAT in our obese HIV+ women, which suggests that IMAT may have biologic characteristics different from those of SAT.
We also found that the relation between whole-body IMAT and insulin resistance did not differ significantly between the obese HIV+ group and the control group and that a high IMAT was independently associated with insulin resistance in both groups. These findings confirm our previous reports in HIV− women, which suggest that IMAT plays an important role in influencing insulin sensitivity independent of HIV status (28). Although reports regarding differences between VAT and SAT in HIV− individuals have been published (45), reports regarding the biologic characteristics of IMAT in HIV− or HIV+ are lacking (28, 38–39). The influence of IMAT on insulin action may be due to its proximity to the muscle cells, similar to the effects of intramyocellular lipids (27). However, relatively greater amounts of IMAT may also reflect other characteristics of whole-body AT, such as abnormalities in the largest storing depot, SAT. Further studies are clearly needed to characterize whole-body IMAT in both HIV+ and HIV− individuals.
We found that the association between absolute SAT accumulation and SI was significantly different between the HIV+ and control groups. In contrast with results in the control group and with previous reports in HIV− obese women (4), the relation of absolute SAT accumulation with SI was positive in the HIV+ obese women in the present study. These findings were replicated even if absolute values of regional SAT (upper body or leg) were used (not shown). However, SAT distribution, ie, a relatively low amount of leg SAT (expressed as a percentage of total SAT), was similarly related to a low SI (insulin resistance) in both the obese HIV+ and the control groups. These relations were independent of VAT or IMAT. Differential characteristics of SAT in the upper versus the lower body could explain this finding. Gluteal and leg AT display increased glucose transport capacity, decreased sensitivity to lipolytic agents, and increased sensitivity to antilipolytic agents (46, 47)—in short, a higher capacity to store fat than the abdominal SAT. Less leg SAT could therefore reflect qualitative changes in overall SAT (more insulin resistance with decreased capacity to store), which could underlie the relation between SAT distribution and insulin resistance in both upper-body obese HIV− and HIV+ lipodystrophy. Indeed, recent data from 2 large studies in individuals not characterized by HIV status show associations between lower relative amounts of leg fat or thigh SAT and unfavorable glucose and lipid concentrations, independent of higher abdominal fat (36, 37).
We found VAT accumulation was not independently associated with insulin resistance in the groups of women studied. The relation between VAT and SI was negative in the controls and positive in the HIV+ group but was not statistically different in the 2 groups; neither of the calculated slopes was statistically different from zero. Although HIV+ women with lipodystrophy were reported to have increased VAT and to be more insulin resistant than HIV+ women without lipodystrophy (9, 11, 32), except for earlier studies in lean men and women (16, 30), most studies have not shown an independent relation between increased VAT and insulin resistance in HIV+ women (15, 26, 31). Therefore, our results in obese women could not be generalized to HIV+ men with lipodystrophy or to leaner HIV+ women. Still, it is of note that none of the previous studies made measurements of IMAT or SAT distribution.
Because HAART may directly alter both insulin sensitivity (48, 49) and AT metabolism (35, 50), it is not surprising that we found differences between the HIV+ and control groups in the relations of certain AT depots (ie, whole-body SAT) with insulin resistance; one could argue that such relations in HIV− lipodystrophy should not be compared with those in healthy obese controls. However, the similarities we found in the relations of IMAT and SAT distribution with insulin resistance in both obese HIV+ and obese controls suggest that a partly common pathophysiologic mechanism may underlie these relations for both groups. For example, the relation between low leg SAT% and insulin resistance in both the HIV lipodystrophy and control subjects may be a consequence of a relative decreased amount of protective SAT (leg SAT) in both groups. Loss of limb fat, specifically of SAT [whereas intramyocellular fat (27) and probably IMAT are spared], has been attributed to HAART in longitudinal studies (51, 52). The heterogeneity of HAART in our HIV+ subjects and the small sample size precludes us from determining any specific effect of an antiretroviral drug class on insulin resistance and fat redistribution. Longitudinal studies are needed to further clarify these relations.
Finally, we acknowledge that the population of HIV+ women that we studied was small and self selected for the desire to lose weight, making generalizations to the larger HIV+ population was difficult. Nevertheless, similarities of findings in these obese HIV+ women as in reasonably representative healthy controls decrease the risk of such findings being biased by the selection of the study’s HIV+ cohort. In addition, the attributes of our population highlight the importance of our results because the women we studied were mostly African American and Hispanic; these women tend to be overweight or obese and tend to remain obese when infected with HIV (21, 22). Our study needs to be extended to other HIV-infected individuals, specifically men and HIV+ women with a larger range of body weight.
In conclusion, aspects of AT distribution associated with insulin resistance in obese HIV+ women seeking weight loss are a high whole-body IMAT and a low leg SAT distribution. Clinical recognition of these aspects of AT distribution may be difficult but important for studies of interventions aimed at improving insulin resistance in obese HIV+ women.
Acknowledgments
We thank our study participants and the staff members of Columbia General Clinical Research Center, NY Obesity Research Center (Metabolism Core and Body Composition Core Labs) and the GI Immunology Department, St Luke’s Roosevelt Hospital Center, St Luke’s Roosevelt Hospital Center.
Footnotes
Supported by NIH grants PO1-DK42612, MO1RR00645, P3O DK26687, and RO1 DK40414 and a grant from Bristol-Myers Squibb.
The authors’ responsibilities were as follows—JBA, DPK, and ESE: study design; JBA, SK MW, ESB, and ESE: subject recruitment and data collection; QH: MRI analyses; JBA and SH: data analysis; SH: statistical expertise; JBA: data interpretation and manuscript writing; JBA, SK, QH, MW, ESB, SH, DPK, and ESE: critical review of the manuscript for intellectual content. JBA, DPK, and ESE received honoraria and grant support from Bristol-Myers Squibb for HIV lipodystrophy-related studies and educational activities. None of the other authors had a conflict of interest to disclose.
References
- 1.Reaven GM. Role of insulin resistance in human disease. Diabetes. 1988;37:1595–607. doi: 10.2337/diab.37.12.1595. [DOI] [PubMed] [Google Scholar]
- 2.Wilson PWF, Kannel WB, Silbershatz H, D’Agostino R. Clustering of metabolic factors and coronary heart disease. Arch Intern Med. 1999;159:1104–9. doi: 10.1001/archinte.159.10.1104. [DOI] [PubMed] [Google Scholar]
- 3.Garg A. Acquired and inherited lipodystrophies. N Engl J Med. 2004;350:1220–34. doi: 10.1056/NEJMra025261. [DOI] [PubMed] [Google Scholar]
- 4.Albu J, Kovera AJ, Johnson JA. Fat distribution and health in obesity: in vivo body composition studies. Ann NY Acad Sci. 2000;904:491–501. doi: 10.1111/j.1749-6632.2000.tb06505.x. [DOI] [PubMed] [Google Scholar]
- 5.Safrin S, Grunfeld C. Fat distribution and metabolic changes in patients with HIV infection. AIDS. 1999;13:2493–505. doi: 10.1097/00002030-199912240-00002. [DOI] [PubMed] [Google Scholar]
- 6.Carr A, Cooper DA. Adverse effects of antiretroviral therapy. Lancet. 2000;356:1423–30. doi: 10.1016/S0140-6736(00)02854-3. [DOI] [PubMed] [Google Scholar]
- 7.Carr A, Samaras K, Burton S, et al. A syndrome of peripheral lipodystrophy, hyperlipidemia and insulin resistance in patients receiving protease inhibitor therapy. AIDS. 1998;12:F51–8. doi: 10.1097/00002030-199807000-00003. [DOI] [PubMed] [Google Scholar]
- 8.Yarasheski KE, Tebas P, Sigmund C, et al. Insulin resistance in HIV protease inhibitor-associated diabetes. J Acquir Immune Defic Syndr. 1999;21:209–16. doi: 10.1097/00126334-199907010-00005. [DOI] [PMC free article] [PubMed] [Google Scholar]
- 9.Hadigan C, Miller K, Corcoran C, Anderson E, Basgoz N, Grinspoon S. Fasting hyperinsulinemia and changes in regional body composition in human immunodeficiency virus–infected women. J Clin Endocrinol Metab. 1999;84:1932–7. doi: 10.1210/jcem.84.6.5738. [DOI] [PubMed] [Google Scholar]
- 10.Hadigan C, Corcoran C, Stanley T, Piecuch S, Klibanski A, Grinspoon S. Fasting hyperinsulinemia in human immunodeficiency virus-infected men: relationship to body composition, gonadal function, and protease inhibitor use. J Clin Endocrinol Metab. 2000;85:35–41. doi: 10.1210/jcem.85.1.6264. [DOI] [PubMed] [Google Scholar]
- 11.Hadigan C, Corcoran C, Piecuch S, Rodriguez W, Grinspoon S. Hyper-androgenemia in human immunodeficiency virus-infected women with the lipodystrophy syndrome. J Clin Endocrinol Metab. 2000;85:3544–50. doi: 10.1210/jcem.85.10.6923. [DOI] [PubMed] [Google Scholar]
- 12.Hadigan C, Meigs JB, Corcoran C, et al. Metabolic abnormalities and cardiovascular disease risk factors in adults with Human immunodeficiency virus infection and lipodystrophy. Clin Inf Dis. 2001;32:130–9. doi: 10.1086/317541. [DOI] [PubMed] [Google Scholar]
- 13.Meininger G, Hadigan C, Laposata M, et al. Elevated concentrations of free fatty acids are associated with increased insulin response to standard glucose challenge in human immunodeficiency virus-infected subjects with fat redistribution. Metabolism. 2002;51(2):260–6. doi: 10.1053/meta.2002.29999. [DOI] [PubMed] [Google Scholar]
- 14.Meininger G, Hadigan C, Rietschel P, Grinspoon S. Body-composition measurements as predictors of glucose and insulin abnormalities in HIV-positive men. Am J Clin Nutr. 2002;76(2):460–5. doi: 10.1093/ajcn/76.2.460. [DOI] [PubMed] [Google Scholar]
- 15.Mynarcik DC, McNurlan MA, Steigbigel RT, Fuhrer J, Gelato MC. Association of severe insulin resistance with both loss of limb fat and tumor necrosis factor receptor levels in HIV lipodystrophy. J Acquir Immune Defic Syndr. 2000;25:312–21. doi: 10.1097/00042560-200012010-00004. [DOI] [PubMed] [Google Scholar]
- 16.Kosmiski LA, Kuritzkes DR, Lichtenstein KA, et al. Fat distribution and metabolic changes are strongly correlated and energy expenditure is increased in the HIV lipodystrophy syndrome. AIDS. 2001;15:1993–2000. doi: 10.1097/00002030-200110190-00012. [DOI] [PubMed] [Google Scholar]
- 17.Andersen O, Haugaard S, Andersen UB, et al. Lipodystrophy in human immunodeficiency virus patients impairs insulin action and induces defects in beta-cell function. Metabolism. 2003;52:1343–53. doi: 10.1016/s0026-0495(03)00201-4. [DOI] [PubMed] [Google Scholar]
- 18.Haugaard SB, Andersen O, Hansen BR, et al. In non-diabetic, immunodeficiency virus-infected patients with lipodystrophy, hepatic insulin extraction and post hepatic insulin clearance rate are decreased in proportion to insulin resistance. Metabolism. 2005;54:171–9. doi: 10.1016/j.metabol.2004.08.009. [DOI] [PubMed] [Google Scholar]
- 19.Haugaard SB, Andersen O, Flemming D, et al. Defective glucose and lipid metabolism in human immunodeficiency virus-infected patients with lipodystrophy involve liver, muscle tissue and pancreatic beta-cells. Eur J Endocrinol. 2005;152:103–12. doi: 10.1530/eje.1.01835. [DOI] [PubMed] [Google Scholar]
- 20.Silva M, Skolnik PR, Gorbach SL, et al. The effect of protease inhibitors on weight and body composition in HIV-infected patients. AIDS. 1998;12:1645–51. doi: 10.1097/00002030-199813000-00012. [DOI] [PubMed] [Google Scholar]
- 21.Amorosa V, Synnestvedt M, Gross R, et al. A tale of 2 epidemics: the intersection between obesity and HIV infection in Philadelphia. J Acquir Immune Defic Syndr. 2005;39:557–61. [PubMed] [Google Scholar]
- 22.Karmon SL, Moore RD, Dobs AS, Keruly J, Barnett S, Cofrancesco J., Jr Body shape and composition in HIV-infected women: an urban cohort. HIV Med. 2005;6(4):245–52. doi: 10.1111/j.1468-1293.2005.00284.x. [DOI] [PubMed] [Google Scholar]
- 23.Mulligan K, Grunfeld C, Viva WT, et al. Hyperilipidemia and insulin resistance are induced by protease inhibitors independent of changes in body composition in patients with HIV infection. J Acquir Immune Defic Syndr. 2000;23:35–43. doi: 10.1097/00126334-200001010-00005. [DOI] [PubMed] [Google Scholar]
- 24.Grinspoon S, Carr A. Cardiovascular risk and body-fat abnormalities in HIV-infected adults. N Engl J Med. 2005;352:48–62. doi: 10.1056/NEJMra041811. [DOI] [PubMed] [Google Scholar]
- 25.Shadid S, Jensen MD. Effects of pioglitazone versus diet and exercise on metabolic health and fat distribution in upper body obesity. Diabetes Care. 2003;26:3148–52. doi: 10.2337/diacare.26.11.3148. [DOI] [PubMed] [Google Scholar]
- 26.Sutinen J, Hakkinen AM, Westerbacka J, et al. Increased fat accumulation in the liver in HIV-infected patients with antiretroviral therapy-associated lipodystrophy. AIDS. 2002;16:2183–93. doi: 10.1097/00002030-200211080-00011. [DOI] [PubMed] [Google Scholar]
- 27.Gan SK, Samaras K, Thompson, et al. Altered myocellular and abdominal fat portioning predict disturbance in insulin action in HIV protease inhibitor-related lipodystrophy. Diabetes. 2002;51:3163–9. doi: 10.2337/diabetes.51.11.3163. [DOI] [PubMed] [Google Scholar]
- 28.Albu JB, Kovera AJ, Allen L, et al. Independent association of insulin resistance with increased intermuscular adipose tissue and a greater acute insulin response to glucose in African American than in white nondiabetic women. Am J Clin Nutr. 2005;82:1210–7. doi: 10.1093/ajcn/82.6.1210. [DOI] [PMC free article] [PubMed] [Google Scholar]
- 29.Saint-Marc T, Partisani M, Poizot-Marin I, et al. Fat distribution evaluated by computed tomography and metabolic abnormalities in patients undergoing antiretroviral therapy: preliminary results of the LIPOCO study. AIDS. 2000;14:37–49. doi: 10.1097/00002030-200001070-00005. [DOI] [PubMed] [Google Scholar]
- 30.Hadigan C, Kamin D, Liebau J, et al. Depot-specific regulation of glucose uptake and insulin sensitivity in HIV-lipodystrophy. Am J Physiol Endocrinol Metab. 2005;290:E289–98. doi: 10.1152/ajpendo.00273.2005. [DOI] [PMC free article] [PubMed] [Google Scholar]
- 31.Mynarcik DC, Steigbigel RT, McNurlan MA, Gelato M. Response to “Lipodystrophy and insulin resistance in patients with HIV. J Acquir Immune Defic Syndr. 2001;27:506–7. doi: 10.1097/00126334-200108150-00013. [DOI] [PubMed] [Google Scholar]
- 32.Engelson ES, Kotler DP, Tan YX, et al. Fat distribution in HIV-infected patients reporting truncal enlargement quantified by whole-body magnetic resonance imaging. Am J Clin Nutr. 1999;69:1162–9. doi: 10.1093/ajcn/69.6.1162. [DOI] [PubMed] [Google Scholar]
- 33.Kotler DP, Rosenbaum K, Wang J, Pierson RN., Jr Studies of body composition and fat distribution in HIV-infected and control subjects. J Acquir Immune Defic Syndr. 1999;20:228–37. doi: 10.1097/00042560-199903010-00003. [DOI] [PubMed] [Google Scholar]
- 34.Kotler DP, Lopes JL, Engelson ES, Wang J, Agin D, Heymsfield SB. Interactions among sex, HIV infection, and fat redistribution. AIDS Reader. 2000;10(10):589–94. [PubMed] [Google Scholar]
- 35.Johnson JA, Albu JB, Engelson ES, et al. Increased systemic and adipose tissue cytokines in patients with HIV-associated lipodystrophy. Am J Physiol Endocrinol Metab. 2004;286:E261–71. doi: 10.1152/ajpendo.00056.2003. [DOI] [PubMed] [Google Scholar]
- 36.Snijder MB, Marieke B, Snijder MSC, et al. Trunk fat and leg fat have independent and opposite associations with fasting and postload glucose levels: the Hoorn study. Diabetes Care. 2004;27(2):372–7. doi: 10.2337/diacare.27.2.372. [DOI] [PubMed] [Google Scholar]
- 37.Snijder MB, Visser M, Dekker JM, et al. Low subcutaneous thigh fat is a risk factor for unfavorable glucose and lipid levels, independently of high abdominal fat. The Health ABC Study. Diabetologia. 2005;48(2):301–8. doi: 10.1007/s00125-004-1637-7. [DOI] [PubMed] [Google Scholar]
- 38.Song MY, Ruts E, Kim J, Janumala I, Heymsfield S, Gallagher D. Sarcopenia and increased muscle adipose tissue infiltration in elderly African-American women. Am J Clin Nutr. 2004;79:874–80. doi: 10.1093/ajcn/79.5.874. [DOI] [PubMed] [Google Scholar]
- 39.Gallagher D, Kuznia P, Heshka S, et al. Adipose tissue in muscle: a novel depot similar in size to visceral adipose tissue. Am J Clin Nutr. 2005;81:903–10. doi: 10.1093/ajcn/81.4.903. [DOI] [PMC free article] [PubMed] [Google Scholar]
- 40.Ross R. Magnetic resonance imaging provides new insights into the characterization of adipose and lean tissue distribution. Can J Clin Pharmacol. 1996;74:778–85. [PubMed] [Google Scholar]
- 41.Bergman RN, Parger R, Volund A, Olefsky JM. Equivalence of the insulin sensitivity index in man derived by the minimal model method and the euglycemic glucose clamp. J Clin Invest. 1987;79:790–800. doi: 10.1172/JCI112886. [DOI] [PMC free article] [PubMed] [Google Scholar]
- 42.Welch S, Gebhart S, Bergman R, Phillips L. Minimal model analysis of intravenous glucose tolerance test-derived insulin sensitivity in diabetic subjects. J Clin Endocrinol Metab. 1990;71:1508–18. doi: 10.1210/jcem-71-6-1508. [DOI] [PubMed] [Google Scholar]
- 43.Gervasoni C, Ridolfo AL, Trifiro G, et al. Redistribution of body fat in HIV-infected women undergoing combined antiretroviral therapy. AIDS. 1999;13:465–71. doi: 10.1097/00002030-199903110-00004. [DOI] [PubMed] [Google Scholar]
- 44.Saint-Marc T, Partisani M, Poizot-Martin I, et al. A syndrome of peripheral fat wasting (lipodystrophy) in patients receiving long-term nucleoside analogue therapy. AIDS. 1999;13:1659–67. doi: 10.1097/00002030-199909100-00009. [DOI] [PubMed] [Google Scholar]
- 45.Wajchenberg BL. Subcutaneous and visceral adipose tissue: their relation to the metabolic syndrome. Endocr Rev. 2000;21:697–738. doi: 10.1210/edrv.21.6.0415. [DOI] [PubMed] [Google Scholar]
- 46.Dowling HJ, Fried SK, Pi-Sunyer FX. Insulin resistance in adipocytes of obese women: effects of body fat distribution and race. Metabolism. 1995;44:987–95. doi: 10.1016/0026-0495(95)90094-2. [DOI] [PubMed] [Google Scholar]
- 47.Johnson JA, Fried SK, Pi-Sunyer FX, Albu J. Impaired insulin action in subcutaneous adipocytes from women with visceral obesity. Am J Physiol Endocrinol Metab. 2001;280:E40–9. doi: 10.1152/ajpendo.2001.280.1.E40. [DOI] [PubMed] [Google Scholar]
- 48.Nolte LA, Yarasheski KE, Kawanaka K, Fisher J, Le N, Holloszy JO. The HIV protease inhibitor indinavir decreases insulin- and contraction-stimulated glucose transport in skeletal muscle. Diabetes. 2001;50:1397–401. doi: 10.2337/diabetes.50.6.1397. [DOI] [PubMed] [Google Scholar]
- 49.Noor MA, Lo JC, Mulligan K, et al. Metabolic effects of indinavir in healthy HIV-sero-negative men. AIDS. 2001;15:F11–8. doi: 10.1097/00002030-200105040-00001. [DOI] [PMC free article] [PubMed] [Google Scholar]
- 50.Bastard JP, Caron M, Vidal H, et al. Association between altered expression of adipogenic factor SREBP1 in lipoatrophic adipose tissue from HIV1-infected patients and abnormal adipocyte differentiation and insulin resistance. Lancet. 2002;359:1026–31. doi: 10.1016/S0140-6736(02)08094-7. [DOI] [PubMed] [Google Scholar]
- 51.Saves M, Raffi F, Capeau J, et al. the APROCO Study Group. Factors related to lipodystrophy and metabolic alterations in patients with human immunodeficiency virus infection receiving highly active antiretroviral therapy. Clin Infect Dis. 2002;34:1396–405. doi: 10.1086/339866. [DOI] [PubMed] [Google Scholar]
- 52.Shlay JC, Visnegrawala F, Bartsch G, et al. for the Terry Beirn Community Program for Clinical Research on AIDS (CPCRA) Body composition and metabolic changes in antiretroviral-naïve patients randomized to didanosine and stavudine vs abacavir and lamivudine. J Acquir Immune Defic Syndr. 2005;38:147–55. doi: 10.1097/01.qai.0000143599.64234.15. [DOI] [PubMed] [Google Scholar]