

Abstract
Purpose
A significant number of women with serous ovarian cancer are intrinsically refractory to platinum-taxol based treatment. We analyzed somatic DNA copy number variation (CNV) and gene expression data to identify key mechanisms associated with primary resistance in advanced-stage serous cancers.
Experimental Design
Genome-wide CNV was measured in 118 ovarian tumors using high-resolution oligonucleotide microarrays. A well-defined subset of 85 advanced-stage serous tumors was then used to relate CNV to primary resistance to treatment. The discovery-based approach was complemented by quantitative-PCR copy number analysis of twelve candidate genes as independent validation of previously reported associations with clinical outcome. Likely CNV targets and tumor molecular subtypes were further characterized by gene expression profiling.
Results
Amplification of 19q12, containing Cyclin E (CCNE1) and 20q11.22-q13.12, mapping immediately adjacent to the steroid receptor co-activator NCOA3, were significantly associated with poor response to primary treatment. Other genes previously associated with CNV and clinical outcome in ovarian cancer were not associated with primary treatment resistance. Chemoresistant tumors with high CCNE1 copy number and protein expression were associated with increased cellular proliferation but so too were a subset of treatment responsive patients, suggesting a cell-cycle independent role for CCNE1 in modulating chemoresponse. Patients with a poor clinical outcome without CCNE1 amplification over expressed genes involved in extracellular matrix deposition.
Conclusions
We have identified two distinct mechanisms of primary treatment failure in serous ovarian cancer, involving CCNE1 amplification and enhanced extracellular matrix deposition. CCNE1 copy number is validated as a dominant marker of patient outcome in ovarian cancer.
Relevance to Future Practice of Clinical Medicine
Resistance to chemotherapy in women with advanced stage ovarian cancer is a major clinical problem. We describe two distinct molecular mechanisms of resistance that have future clinical relevance for response prediction and the development of novel therapeutic strategies. The key finding that CCNE1 (cyclin E) amplification is strongly associated with treatment-resistance in ovarian carcinomas is consistent with previous associations with poor survival reported for ovarian and other cancer types. Amplification status of CCNE1 therefore has potential for therapeutic exploitation, whereby patients carrying CCNE1 amplification may benefit from novel, cyclin-related targeted treatments. Whereas a second group of patients, exhibiting an alternative mode of resistance associated with host tissue elements and reactive stroma, are likely to benefit from therapeutic strategies that target different activation pathways.
INTRODUCTION
Standard of care for women with advanced stage ovarian cancer involves primary cytoreductive surgery followed by adjuvant chemotherapy with a platinum-based agent, often regarded as the most active component, and a taxane (1). Whilst response rates to first-line treatment are high, 20-25% of cases relapse during or soon after the cessation of primary therapy (2). The ability to predict treatment response and the development of therapies to counter primary chemoresistance are key goals of ovarian cancer research. Known platinum-resistance mechanisms include reduced drug delivery to target DNA and failure of cells to initiate cell death in response to platinum-induced DNA damage, due to defects in DNA damage recognition, repair and apoptosis (3). However, most mechanistic studies on platinum resistance have been performed using in vitro cell models and few have been shown to be relevant in the clinical setting (3).
Chromosomal aberrations reflect oncogene activation and loss of tumor suppressor genes (4) and global surveys of DNA gain or loss have been considered a fertile area to search for determinants of chemoresistance and survival in ovarian cancer. Comparative genomic hybridization (CGH) on metaphase spreads (5, 6) has been superseded by higher resolution array CGH using large mapped insert clones (7, 8) or oligonucleotide probes (9). Although a number of chromosomal regions (6-8, 10, 11) and individual genes, including FGF1 (9), EVI1 (12), CCNE1 (13, 14), PRKCI (15), RSF1 (16), RAB25 (17), BRCA1 (18), ERBB2 (19, 20), MUC1 (21), IGF2R (22), ZNF217 (23) and MYC (24), have reported CNV linked to patient outcome in ovarian cancer, most have not yet been validated in independent studies until now.
We performed both a discovery and validation study in a clinically well-characterized sample population of ovarian tumors, comprising the largest cohort to be analyzed by both copy number and gene expression microarrays to date. High-resolution oligonucleotide copy number analysis on 118 high grade serous ovarian cancers, including 85 tumors representing a carefully selected patient cohort, were used to identify recurrent regions of genomic change associated with primary treatment response. In parallel, we performed the first direct comparison of twelve genes previously associated with CNV and clinical outcome in ovarian cancer, using quantitative-PCR (qPCR).
Among six regions of CNV that were differentially altered in patients with either a good or poor response to primary treatment, we show that amplification of 19q12, associated with CCNE1, and 20q13, mapped immediately adjacent to NCOA3, were significantly associated with chemoresistance.
Importantly CCNE1 was the only previously reported CNV associated with poor outcome in ovarian cancer validated as a marker for primary chemoresistance. We also identify a group of chemoresistant cases without CCNE1 amplification or increased cellular proliferation, which are characterized by increased expression of extracellular matrix related genes. This data implies that patients without CCNE1 amplification and a poor response to treatment follow a distinct molecular pathway to those cases with CCNE1 amplification, possibly involving ECM deposition from activated stroma.
MATERIALS AND METHODS
Patients
The study population consisted of 118 patients diagnosed with epithelial ovarian, primary peritoneal or fallopian tube cancer between 1988 and 2005 (Supplementary Table 1). Primary treatment failure occurs in a minority of patients and is influenced by the adequacy of surgical debulking. We therefore pre-selected a cohort of patients from four studies to obtain adequate numbers of responsive and resistant patients in our cohort; the Australian Ovarian Cancer Study (AOCS) (25), Westmead Hospital (Sydney, Australia), Haukeland University Hospital of Bergen (Bergen, Norway) or Jikei University (Tokyo, Japan). This project had institutional ethics review board approval at all participating centers.
Clinical Treatment and Definitions
Patients underwent laparotomy for diagnosis, staging and tumor debulking and subsequently received first-line platinum based chemotherapy. Tumor material for the study was excised at the time of primary surgery, prior to the administration of chemotherapy. Surgical staging was assessed in accordance with FIGO (Fédération Internationale des Gynaecologistes et Obstetristes) classification. Optimal debulking was defined as ≤ 1 cm (diameter) residual disease, and sub-optimal debulking was more than 1 cm (diameter) residual disease.
A subset of 85 cases selected from the total cohort of 118 tumors were used to investigate response to therapy and survival (Table 1). The ‘clinical cohort’ included cases that had Stage III or IV serous invasive disease and received treatment including a platinum-based agent, carboplatin or cisplatin, administered without delay (within 6 weeks of surgery) and completed adequately (at least 4 cycles of platinum) unless disease progression was evident while on first line treatment. Patients who had received neo-adjuvant chemotherapy were excluded.
Table 1.
Clinical Cohort Patient Clinicopathological Characteristics.
| Responsive | Resistant | p-value | |
|---|---|---|---|
| Age | |||
| Mean | 57 | 59 | 0.19a |
| Standard Deviation | 10 | 13 | |
| Range | 36-78 | 23-85 | |
| Stage | |||
| III | 46 (88%) | 29 (88%) | 1.00b |
| IV | 6 (12%) | 4 (12%) | |
| Grade | |||
| Low (well differentiated) | 4 (8%) | 1 (3%) | 0.43b |
| Medium | 22 (42%) | 11 (33%) | |
| High (poorly differentiated) | 24 (46%) | 19 (58%) | |
| Unknown | 2 (4%) | 2 (6%) | |
| Residual Disease | |||
| ≤ 1 cm | 26 (50%) | 20 (61%) | 0.82b |
| > 1 cm | 19 (37%) | 13 (39%) | |
| Unknown | 7 (13%) | 0 (0%) | |
| Primary Treatment | |||
| Pt-based † | 2 (4%) | 4 (12%) | 0.08b |
| Pt-based + Taxane | 40 (77%) | 17 (52%) | |
| Pt-based + Other | 1 (2%) | 2 (6%) | |
| Pt-based + Taxane + Other | 9 (17%) | 10 (30%) | |
| PFS | |||
| from End of Primary Tx | |||
| Median (months) | 17.50 | 3.75 | <0.001c |
| 95% Confidence Interval | 14.6-26.9 | 2.57-4.87 | |
| Events | 40 (77%) | 33 (100%) | |
| OS | |||
| from Surgery | |||
| Median (years) | 5.07 | 1.63 | <0.001c |
| 95% Confidence Interval | 4.55-6.72 | 1.40-2.66 | |
| Events | 22 (42%) | 28 (85%) | |
| Total Cases (n=85) | 52 | 33 | |
Calculated p-values from
wilcoxon rank sum test,
fisher test or
cox proportional hazard model.
Pt, Platinum-based agent; cisplatin or carboplatin.
The cohort was further stratified into platinum ‘Resistant’ and treatment ‘Responsive’ patients based on progression-free interval. Less than six months to disease progression was chosen as an endpoint to define Resistant cases due to its clinical relevance in identifying platinum resistant disease (1). ‘Resistant’ cases either progressed on primary treatment, had stable disease (evidenced by persistently elevated CA125) or had a partial or complete CA125 response and relapsed within six months from the end of primary chemotherapy.
Given that sub-optimal debulking can contribute to rapid disease progression (26), any case with > 2 cm residual disease or unknown debulking status were excluded from the ‘Resistant’ group. Treatment ‘Responsive’ patients had a complete pathological response and/or no evidence of disease progression for a minimum of 9 months from the end of primary treatment.
Progressive disease was determined based on CA125 marker and imaging according to RECIST criteria modified for ovarian cancer (27) (28), or on clinical examination. Progression-free survival (PFS) was calculated as the interval between the end of primary treatment to disease progression; overall survival (OS) was defined as the time interval between the date of surgery and the date of death from any cause.
Histological subtype and tumor grade (according to World Health Organization criteria) were derived from the diagnostic pathology reports. Although central pathology review of all cases was not performed, hematoxylin and eosin (H&E) stained sections flanking the fresh-frozen tissue used for nucleic acid extraction were reviewed by collaborating pathologists to assess cellular composition and confirm histology. Samples were only included if histology as assessed from the fresh-frozen slide review was consistent with the original pathology report.
Nucleic Acid Extraction
DNA was extracted from whole tumor tissue for samples with ≥ 80% neoplastic cells. For samples with < 80% overall tumor cells, needle dissection of serial tumor sections was performed to enrich for the epithelial fraction prior to DNA extraction. Needle-dissected samples were stained with cresyl-violet (Ambion, Austin, TX) to facilitate morphological distinction between tumor and stromal elements. Genomic DNA was extracted using a DNeasy kit (Qiagen, Valencia, CA) according to the manufacturer’s protocol and quantified by spectrophotometry. Total RNA from whole tumor samples was isolated by phenol-chloroform extraction (Invitrogen, Carlsbad, CA) and purified using Qiagen RNeasy columns (Qiagen, Valencia, CA) according to the standard protocol. RNA quality was assessed using the Bioanalyzer 2100 (Agilent, Santa Clara, CA) prior to gene expression profiling.
SNP Mapping and Expression Microarrays
Affymetrix 50K XbaI SNP mapping arrays were used for genome-wide copy number analysis (29). Affymetrix U133plus2.0 arrays were used to measure gene expression of 47,000 transcripts including 38,500 characterized genes. The mapping and expression array assays were performed according to the manufacturer’s protocol (Affymetrix, Santa Clara, CA). Further experimental details are given in Supplementary Methods.
SNP Microarray Data Analysis
CNV frequency and amplitude (gain, amplification, single copy loss or homozygous deletion) was examined to determine the significance of CNV using GISTIC as described previously (30). After microarray and copy number normalization steps were applied, a G score was generated for each SNP to assess copy number variation across all samples in the tumor set. A G score was calculated considering frequency of copy number change (f) and mean copy number amplitude (c) equal to for amplifications and for deletions. The background distribution of random G scores was estimated by permutation testing of all marker labels and each G score then assigned a false discovery rate (FDR) corrected significance (q-value). A q-value cut-off of 0.25 was used to define significant regions of recurrent CNV. Within each region, the locus with minimal q-value was also identified as the primary target or peak CNV, whilst allowing for one randomly aberrant sample that may have shifted the peak boundary (29).
GISTIC analysis was then performed on the treatment ‘Responsive’ and ‘Resistant’ class tumors separately to identify CNV that were either unique to one group or varied in frequency or amplitude of CNV occurrence between classes. The difference in calculated G scores for each peak SNP (Gi) identified by GISTIC in either the treatment Responsive and/or Resistant classes was calculated, where . Each ΔG score was then assigned a FDR-corrected ΔG significance (ΔG p-value) by further permutation testing of all marker values to generate the expected chance or background distribution of ΔG scores. Peak CNV with ΔG p-values <0.05 were classified as Differentially Mapped Peaks (DMP).
Quantitative PCR (qPCR)
SNP-based copy number was validated by qPCR on a subset 52 cases for which DNA was available. PCR primers were designed using Primer3 (31) and selected to avoid known SNPs and not to amplify products with homology to other sequences (Supplementary Table 2). To evaluate consistency of results, two independent primer sets were used to amplify each gene of interest, except for MYC and for MUC1/FGF1 where previously published primer sequences were used (9, 21). Real-time quantitative-PCR was performed using SYBR Green qPCR on the 7900HT Fast Real-Time PCR system (Applied Biosystems, Foster City, CA) as described in Supplementary Methods.
Expression Microarray Data Analysis
Matched SNP and expression data was available for 52 samples. In addition, 37 samples that met our clinical criteria but were not assayed by SNP array had expression data available (25). The combined data set (n = 89, Supplementary Table 3) was used to identify gene probe-sets within CNV regions with a significant correlation with clinical outcome. Transcription profiling was also used to further characterize molecular subtypes of chemoresistant patients as detailed in Supplementary Methods.
Immunohistochemistry
Immunohistochemistry was performed according to standard protocols using antibodies against CCNE1 (Clone 13A3, LabVision, Fremont CA) and Ki-67 (Clone MIB1, Dako, Denmark) on tissue microarrays containing a subset of Stage III/IV, serous tumors from the ‘clinical cohort’ as defined above (see Supplementary Methods). Staining was assessed by a pathologist and images captured using an Olympus BX51 microscope.
RESULTS
Significant Regions of Amplification and Deletion in Ovarian Tumors
High-resolution analysis of a large cohort of tumors provided an unprecedented view of common CNV in ovarian cancer. Data was analyzed using a statistically-robust algorithm (GISTIC) that sequentially filters the data and creates a probabilistic estimate of the most significant regions of CNV and minimal or peak(s) loci within each region, likely to contain ‘driver’ oncogenes or tumor suppressors. GISTIC analysis includes a quality control step where tumor samples with insignificant detectable CNV are removed from the analysis (30). From an original cohort of 128, ten samples were excluded from the final analysis due to suspected stromal contamination. Supplementary Figure 1 shows summary information on CNV in the cohort of 118 cases, where regions of gain or loss are depicted according the significance of CNV accounting for copy number frequency and magnitude. Genome coordinates for each region of CNV in addition to the minimally targeted peak(s) are given in Supplementary Table 4. A total of 19 amplification peaks and 22 deletion peaks were identified. This study focused on regions of amplification associated with primary treatment failure and further analysis of potential driver genes in regions of amplification and deletion will be described elsewhere.
Amplification of 19q12 and 20q11.22-q13.12 are Significantly Associated with Primary Chemoresistance
We next identified regions of CNV associated with clinical course following primary treatment (Figure 1). To ensure adequate numbers of cases to investigate primary treatment response, we carefully selected a cohort of primary invasive serous ovarian cancer patients of 33 poor outcome (Resistant) and 52 good outcome (treatment Responsive) cases, obtained from Australian, Japanese and Norwegian sample sets. The two groups were well-balanced for prognostic features (patient age, FIGO Stage, histopathological grade and extent of residual disease following debulking surgery), with no statistically significant difference between any tested variable except progression-free survival (PFS) and overall survival (OS) (Table 1).
Figure 1.
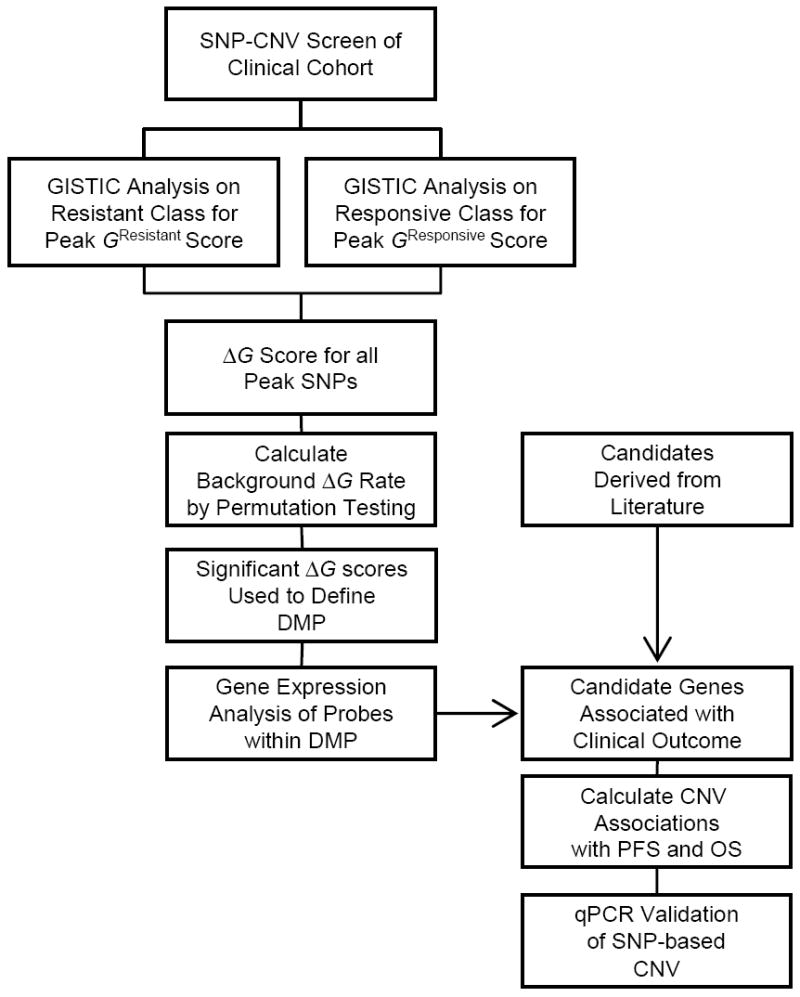
Schematic of experimental design used to identify CNV changes associated with response to primary treatment.
Copy number analysis performed separately on the ‘Resistant’ and treatment ‘Responsive’ samples identified a total of 20 amplification peaks and 20 deletion peaks in the responsive tumors and 14 amplification peaks and 17 deletion peaks resistant class (Supplementary Table 5 and 6).
The frequency and amplitude (G score) of each peak CNV was then compared between classes to identify genomic regions that were differentially amplified or deleted between response classes. We chose to focus only on the identified peak CNV (total of 71 distinct or overlapping peaks between both classes) as these regions were considered most likely to contain CNV-targeted genes important in tumorigenesis and disease progression. By using only peak SNPs, as opposed to all >50,000 SNP makers, we also limit detection of chance correlations with outcome variables associated multiple-hypothesis testing.
Six class-specific Differentially Mapped Peaks (DMP) were defined (Table 2). The two highest-ranking DMP were amplification of 19q12 (incorporating CCNE1) and 20q11.22-q13.12 (immediately adjacent to NCOA3), which were more commonly associated with the Resistant response class. Both 19q12 and 20q11.22-q13.12 copy number were also statistically significantly associated with survival (PFS and/or OS) where time to clinical progression was considered as a continuous variable (Table 3).
Table 2.
Differentially Mapped Peaks (DMP) from comparative copy number analysis of Treatment Resistant and Responsive Classes. Peaks with FDR-corrected ΔG score p-value <0.05 from 71 tested regions shown.
| CNV | Cytoband (Peak) | Peak Position (Mb) | Enriched in Response Class | ΔG score | p-value |
|---|---|---|---|---|---|
| Amplification | 19q12 | 34.39-35.02 | Resistant | 0.20 | 0.003 |
| Amplification | 20q11.22-q13.12 | 33.52-44.89 | Resistant | 0.11 | 0.016 |
| Amplification | 5p15.31 | 8.28-11.14 | Resistant | 0.12 | 0.024 |
| Amplification | 6p25.1 | 6.31-8.47 | Responsive | -0.09 | 0.037 |
| Deletion | 22q13.31 | 46.61-49.02 | Responsive | -0.10 | 0.045 |
| Deletion | 2q34 | 209.49-209.52 | Responsive | -0.18 | 0.046 |
Table 3.
Survival analysis of candidate gene copy number detected by SNP-based screen and/or previously reported.
| Gene | Candidate Selection | Frequency Responsive | Frequency Resistant | PFS (p-value) | OS (p-value) |
|---|---|---|---|---|---|
| Amplifications | |||||
| CCNE1 | Identified in SNP-CNV Screen * | 9.6% | 27.3% | 0.264 | 0.019 |
| ERBB2 | Lassus et al.,2004† | 0.0% | 3.0% | 0.840 | 0.101 |
| FGF1 | Birrer et al., 2007 | 1.9% | 6.1% | 0.121 | 0.280 |
| MDS1/EVI1 | Nanjundan et al., 2007 | 44.2% | 39.4% | 0.431 | 0.808 |
| MUC1 | Takano et al., 2004 | 17.3% | 6.1% | 0.875 | 0.286 |
| MYC | Baker et al., 1990 | 57.7% | 51.5% | 0.752 | 0.829 |
| NCOA3 | Identified in SNP-CNV Screen | 13.5% | 27.3% | 0.009 | 0.004 |
| PRKCI | Eder et al., 2005 | 44.2% | 45.5% | 0.181 | 0.267 |
| RAB25 | Cheng et al., 2004 | 17.3% | 6.1% | 0.875 | 0.286 |
| RSF1 (HBXAP) | Shih Ie et al., 2005 | 23.1% | 15.2% | 0.121 | 0.091 |
| ZNF217 | Peiro et al., 2002‡ | 21.2% | 27.3% | 0.022 | 0.008 |
| Deletions | |||||
| BRCA1 | Kato et al., 2004 | 38.5% | 36.4% | 0.814 | 0.110 |
| IGF2R | Makhija et al. 2003 | 44.2% | 21.2% | 0.376 | 0.499 |
also see Mayr et al., 2006 and Farley et al., 2003;
also see Slamon et al., 1989;
also see Dimova et al., 2005.
Figure 2 shows the G score profile for chromosome 19 and chromosome 20 using all tumors and for each response class individually. The effect of class-specific tumor heterogeneity on G score values is evident for both DMP amplicons, where decreased G score values were observed in the combined analysis (Figure 2A and 2C) compared with an analysis of specific patient subgroups (Figure 2B and 2D).
Figure 2.
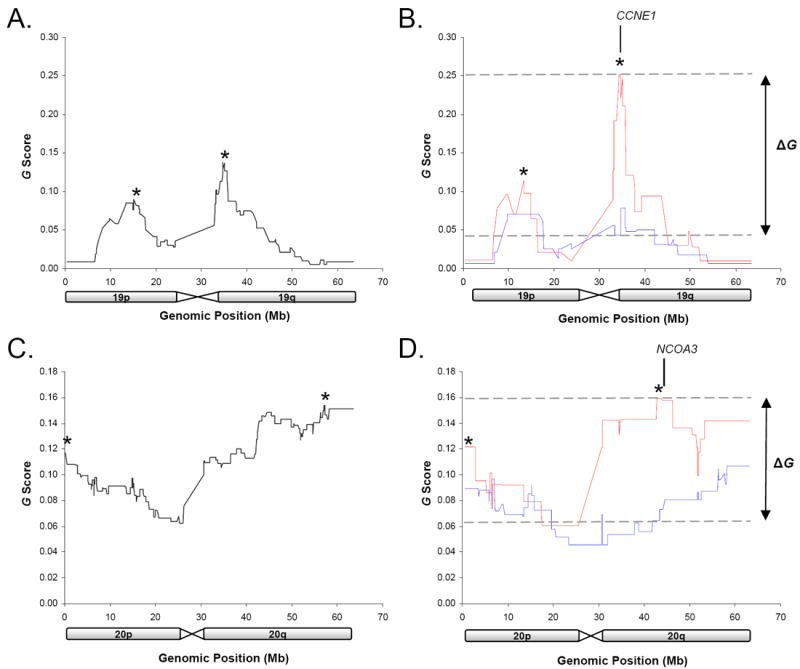
GISTIC G score profile of chromosome 19 (A and B) and 20 (C and D). G scores are shown for all ovarian samples (A and C) and for Responsive (blue) and Resistant (red) samples separately (B and D). *indicates mapped CNV peaks within regions of CNV. Regions with significant ΔG values used to define Differentially Mapped Peaks (DMP) are indicated.
To identify the most likely driver genes within the amplicons, gene expression values for all probes within the 19q12 and 20q11.22-q13.12 DMP were correlated with PFS and OS. Genes that were significantly correlated (p<0.05) with either PFS or OS are shown in Supplementary Table 7. These include CCNE1, contained within the 19q12 amplicon, and NCOA3, although not within the peak, maps immediately distal (~0.7 Mb) to the 20q11.22-q13.12 amplicon.
In addition to identifying copy number associations between copy number and treatment response in identified peak CNV we also directly tested copy number associations with PFS and OS of twelve literature derived candidates previously associated with clinical course in ovarian cancer but may not have been localized within significant peak CNV as determined by GISTIC analysis (Table 3). Genes included amplification of CCNE1, also identified by our screen, in addition to ERBB2, FGF1, MDS1/EVI1, MUC1, MYC, PRKCI, RAB25, RSF1, ZNF217 and deletion of BRCA1 and IGF2R (Table 3).
Gene copy number was estimated by SNP microarray using the copy number of SNPs within each gene or the two flanking SNP markers. Of the tested genes CCNE1 was significantly associated with shorter OS, consistent with its localization within the 19q12 DMP associated with the treatment resistant class, and ZNF217 with shorter PFS and OS, despite not being associated with a primary treatment response group peak CNV specifically (Table 3).
Microarray-based copy number assessment of the two highest ranking DMP and the remaining literature-derived candidates were technically validated by quantitative PCR (qPCR) (Table 3). A high degree of concordance between SNP and qPCR data was observed for most genes (median Pearson correlation coefficient of 0.7) however FGF1 MUC1, PRKC1 and RAB25 showed Pearson coefficients of <0.5 (Supplementary Figure 2). The difference may relate to limitations of the microarray platform; although the 50K SNP arrays used in this study provided very high-resolution genome-wide analysis of CNV, coverage of all areas was not equal. For example, RAB25 and MUC1, both previously reported to be associated with CNV and clinical outcome in ovarian cancer (17, 21), reside in regions with relatively poor SNP representation on the 50K SNP platform. Given these results, we also tested the association between qPCR-determined copy number of the four genes with clinical outcome to supplement data from the SNP-based analysis.
CNV was demonstrated for FGF1, MUC1, PRKC1 and RAB25 by qPCR, however their association with clinical outcome remained insignificant (Supplementary Table 8). In comparison to the SNP microarrays, quantitative-PCR analysis detected a substantially larger number of cases with amplification of the FGF1 and RAB25 loci. In contrast to previous findings (9), however, we still did not find an association between FGF1 amplification and outcome in our cohort. A trend towards amplification and resistance was evident for RAB25, but this did not reach statistical significance. It is possible that the smaller sample size used for the qPCR analysis, compared with the SNP experiments, may have adversely affected the ability to detect a significant association between copy number and outcome.
Distinct Gene Expression Changes in Tumors from Patients with or without CCNE1 Amplification and Poor Treatment Response
The association between CCNE1 amplification and primary treatment resistance ranked as the most significant DMP associated with patient outcome and was consistent with previous studies (14). We therefore sought to better understand the molecular changes in tumors harboring amplification of the CCNE1 locus and to contrast these with tumors from patients who had a poor response to treatment without CCNE1 amplification.
A total of 47 samples, of the 85 samples analyzed using SNP microarrays, were also evaluated by qPCR and gene expression arrays. Samples were segregated into four groups (A-D) according to CCNE1 amplification (as assessed by qPCR) and chemotherapy response status (Figure 3A). The observed statistical significance of CCNE1 amplification and poor treatment response was maintained in this sample subset (p<0.001 by Fisher test; p<0.01 association with PFS, Figure 3A). Pair-wise comparisons of gene expression were then made between the Resistant groups (A and B) and the CCNE1 unamplified Responsive group (C) using a signal to noise metric for all genes. The top ranking genes were then analyzed for over-representation of genes according to biological processes and molecular function categories using PANTHER (Protein ANalysis THrough Evolutionary Relationships) classification (Supplementary Table 9) (32).
Figure 3.
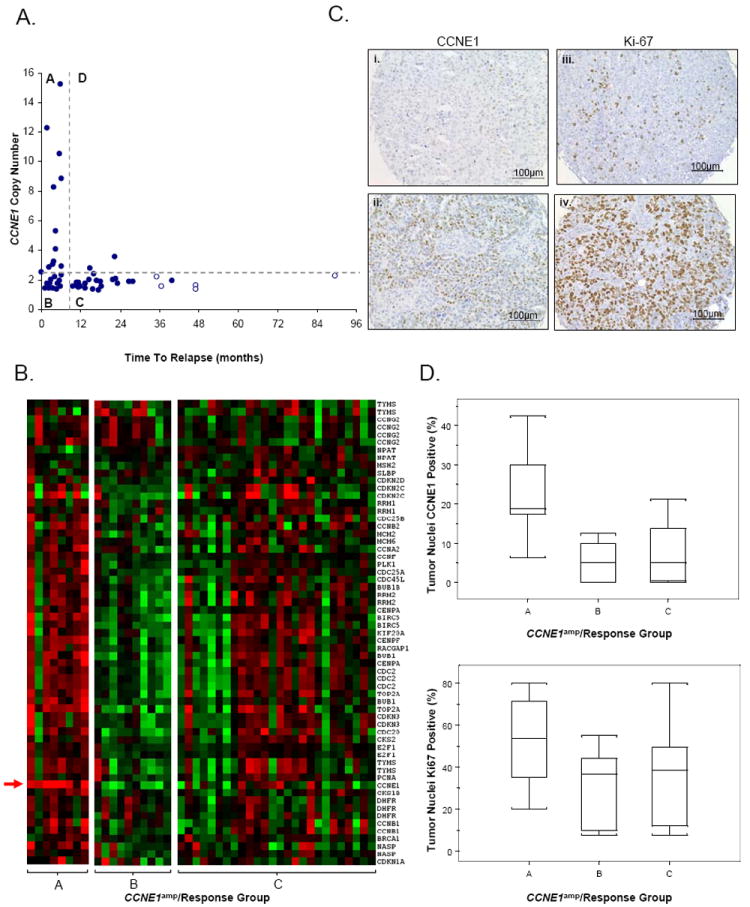
Characterization of tumor subtypes classified by treatment response and CCNE1 amplification status. (A) Samples stratified by treatment response (Resistant, <6 months PFS; Responsive, >9 months PFS) and CCNE1 amplification (CCNE1amp) status as estimated by quantitative-PCR. Amplification is defined as a log2 copy number ratio > 0.3. Four subtypes are observed; Group A (CCNE1 amplified, Resistant), Group B (CCNE1 unamplified, Resistant), Group C (CCNE1 unamplified, Responsive) and Group D (CCNE1 amplified, Responsive). Censored survival data represented by clear circles. (B) Gene expression heat-map of cell cycle genes in CCNE1amp/Response Groups A, B and C. Red indicates increased gene expression, green indicates decreased gene expression. CCNE1 gene expression probe indicated by arrow. (C) Example of tumor tissue with (i) 20% and (ii) 60% of cells with CCNE1 staining and (iii) 10% and (iv) 90% of tumor cells with nuclear Ki-67 staining. (D) Box plots depict range of IHC staining for CCNE1amp/Response Groups A, B and C for (top) CCNE1, p<0.02 and (below) Ki-67, p<0.28. Values for each sample taken as the average of up to four TMA cores. A total of 5, 7 and 16 tumors from each group A, B and C respectively (n = 28) are represented.
As expected, we found an enrichment of cell cycle-associated genes in samples with CCNE1 amplification (Group A, Figure 3A) relative to cases with poor survival and no amplification of CCNE1. Figure 3B shows up-regulation of cell cycle-associated genes in the Resistant samples with CCNE1 amplification using a cell cycle gene set obtained from Whitfield et al. (33). Tumors from patients with a relatively good clinical outcome (Group C, Figure 3A) appeared to include a heterogeneous population of tumors with respect to up-regulation of cell cycle genes. In cases without CCNE1 amplification but a short time to relapse, there was increased expression of genes with extracellular matrix (ECM) structure, cell adhesion and signaling molecular functions (Group B, Figure 3A; Supplementary Table 9).
Immunohistochemical Staining of CCNE1 and Ki-67 are Associated with Specific Tumor Subtypes
Cyclin E and proliferation-related Ki-67 antigen immunohistochemical staining was performed on tissue microarrays (TMA) to provide protein level validation of CCNE1 gene amplification and its association with cellular proliferation. Examples of tumor tissue with low and high level IHC staining are shown in Figure 3, including CCNE1 amplification/chemoresponse groups A, B and C. A significant difference between subtypes (A, B and C) and degree of CCNE1 positively stained tumor nuclei (p<0.02, Kruskal-Wallis rank sum test) was observed, with increased staining in tumors with CCNE1 gene amplification.
The degree of Ki-67 staining was similar between treatment Resistant (Groups A and B combined) and Responsive (group C) groups when directly compared (median staining of ~40% in each class), suggesting no obvious association between cellular proliferation and chemoresponse. When samples were segregated further by CCNE1 amplification status, a trend similar to that observed by gene expression analysis of cell-cycle markers was seen. Figure 3D shows increased median staining of Ki-67 in the Resistant samples with CCNE1 amplification (~55%) compared to those without CCNE1 gene amplification (~40%). Treatment Responsive tumors appear to represent a heterogeneous population of tumors with or without increased cellular proliferation, with median Ki-67 staining similar to that of the group B (CCNE1 unamplified, chemoresistant) tumors (~40%).
DISCUSSION
To the best of our knowledge, our cohort of 118 cases provides the largest single sample set of ovarian cancers examined by high-resolution genome-wide copy number analysis to date, using three-fold or more than samples than most previous studies. We applied a novel approach to defining peak regions of genomic change, GISTIC, which has been shown to identify known oncogene and tumor suppressor gene loci with superior accuracy than other microarray analytical methods (30). The data confirms CNV events previously identified in ovarian cancer, such as amplification regions containing CCNE1 (34), NOTCH3 (35), RSF1 (16), PRKCI (15), MDS1-EVI1 (12) and MYC (24) and deletions of WWOX (36) and RB1 (37). Novel copy number aberrations identified included amplification of; 1q23.3, containing NUF2 and PBX1; 6p23-p22.3, including the oncogene DEK, and 15q26.2-q26.3, containing the potential therapeutic target IGF1R. Detailed analysis of this global survey of gains and loss in ovarian cancer will be described elsewhere (manuscript in preparation).
To identify regions of CNV associated with primary treatment response, we explicitly chose a large group of cases with clinically-defined response to primary treatment that were matched for stage, histology, grade, treatment regimen and debulk status. Prior to deriving associations with clinical outcome variables, we had the option of either using the entire dataset to first define peak regions of CNV, or to define minimal regions of CNV for each response group separately. Separate analysis of response groups appears superior and makes sense intuitively, as heterogeneity between groups may obscure findings if the data is treated as a single entity. For example, analysis of the separate response cohorts identified a discrete peak near NCOA3 in the treatment Resistant group (Figure 2D), which has tentatively been linked to poor outcome in ovarian cancer (38). However, this observation was masked in the analysis of the entire 118 tumors, where the 20q peak was mapped to 20q13.31-q13.32, distal to NCOA3 (Figure 2B and Supplementary Table 4).
This study appears to be the most robust analysis of primary response in ovarian cancer to date, incorporating high-resolution genome-wide analysis, expression profiling, the use of significant numbers of cases, and explicit clinico-pathological criteria in a single combined approach. Although a number of previous studies of ovarian cancer have sought relate CNV to clinical outcome, only two (5, 6) have involved similar numbers of serous cancers to this study and these utilized much lower resolution, metaphase CGH analysis. Consistent with Staebler et al., we saw no evidence of a higher average number of chromosomal aberrations in the Resistant and Responsive patients, with many regions such as 3q26 and 8q24 showing frequent but equivalent change in the two groups. In fact, a greater number of significant CNV overall was detected in the responsive group compared to the resistant group (40 peaks and 31 peaks respectively, Supplementary Tables 5 and 6). The difference is most likely related to the larger size of the responsive cohort, allowing for the detection of additional low frequency events.
In addition to our genome-wide discovery approach, we performed the first head-to-head analysis of candidate genes associated with CNV and outcome in ovarian cancer as independent validation of previous findings. CCNE1 was the only candidate taken from the literature where copy number was specifically associated with primary chemoresistance in our sample population. Discrepancy may relate to variation in methods used to detect CNV such as the sensitivity or resolution of microarray platforms (9, 12, 15, 17) or approaches taken in sample preparation. For example, laser-capture microdissection (9) or immunomagnetic separation (16) may have improved the ability to detect CNV in some studies, while the use of only whole tumour material (15, 17) or a lower percentage tumour content cut-off for needle-dissection (12) may have obscured molecular correlations with outcome. Some of the selected candidate genes had previously been shown to correlate with PFS and/or OS, rather than categorical response to primary treatment per se and therefore may not have been validated in this cohort. For example, ZNF217, previously associated with overall survival (23), was associated with both PFS and OS in our analysis but not platinum resistance specifically. Furthermore, studies often varied in response definitions and survival endpoints used to derived clinical associations. For example, whereas some investigators have used progression free interval, others have used pathological/clinical response after treatment to derive response status (19, 21).
In this study, ‘Resistant’ cases had either progressive or stable disease during treatment or had a partial or complete CA125 response and relapsed within six months from the end of primary chemotherapy. When examined separately, there appeared to be no obvious distinction between these two modes of resistance and the presence of molecular prognostic markers (specifically, cyclin E amplification). However, as the number of samples from each category of resistance was low a thorough statistical analysis could not be performed.
SNP-based and qPCR copy number data were general highly concordant, although some differences were apparent that were primarily explained by poor representation of SNP markers in some regions (particularly for MUC1 and RAB25), preventing accurate quantification of specific genes using flanking SNP markers. In addition, consistent with previous reports (39) we found that the amplification amplitude was lower with SNP data (Supplementary Figure 2). Saturation of the SNP array probes at high copy number and/or smoothing of SNP data resulting in compression of copy number values likely accounts for quantitative differences between the observed qPCR and SNP data. Related to this, it is notable that we did not observe a statistically significant value for PFS using SNP data as a continuous variable for CCNE1 (Table 3) although the association was clear using qPCR data. Specifically, all samples with high-level amplification of the CCNE1 gene as assessed by qPCR (log2 ratio ≥ 2), were chemoresistant (Figure 3A). The difference may be explained by SNP copy number underestimation of high-level gains (Supplementary Figure 2).
Expression profiling was used to identify likely gene targets in each DMP and to validate associations with progression-free and overall survival in samples additional to those analyzed by SNP microarray. The magnitude of fold change between chemoresponse groups was, in most cases, moderate (<1.5, Supplementary Table 7). This is probably in part due to the fact that mean gene expression differences between groups does not sufficiently account for molecular heterogeneity within groups, particularly where CNV occur at low frequencies. We did, however find analysis of gene expression associations with PFS and OS useful for narrowing down likely candidates for further validation studies.
Analysis of the SNP copy number data revealed amplifications associated with chemoresistance, involving two loci, each with highly relevant biological candidates within or near the mapped peak regions: CCNE1 and NCOA3. Previously overexpression of the steroid receptor co-activator NCOA3 (AIB1) in breast tumors, believed to interact with nuclear hormone receptors to enhance their transcriptional activity, has been shown to be significantly correlated with shorter PFS and OS (40). In ovarian tumors, while a trend to towards amplification and poor OS has been observed, statistical significance was not demonstrated (38). Interestingly, another potential target of 20q amplification including in our candidate gene screen, ZNF217 is located ~1.2 Mb away from the chromosome 20 DMP containing NCOA3. The ZNF217 locus was not identified as a peak CNV significantly associated with platinum resistance in our cohort, in addition it showed a lower statistical association with PFS and OS than NCOA3. While it has been suggested that 20q involves a number of distinct amplicons (38), our findings suggests that NCOA3 rather than ZNF217 is the more likely target of 20q amplification events associated with resistance, with increased gene expression also significantly correlated with shorter PFS and OS (Supplementary Table 7). Given the size of the mapped DMP amplicon on 20q (>10 Mb) however, it is possible that additional gene(s) within the mapped region are important in tumorigenesis and treatment response. Identification of other drivers requires further systematic functional characterization of all genes within this region.
CCNE1 functions as a regulatory subunit of CDK2 essential for G1 to S-phase transition and DNA replication, in addition to playing a role in apoptosis and chromosomal instability in tumor cells (41). CyclinE-cdk2 act through phosphorylation of substrates involved in G1 progression, S-phase entry and centrosome duplication, in addition to having kinase-independent functions involving loading mini-chromosome maintenance (MCM) proteins onto replication origins, as quiescent cells enter the cell cycle (42).
CCNE1 gene amplification has been identified as a mechanism of overexpression in ovarian tumors with a direct correlation with poor outcome in this and previous studies (13, 14), although it had not been explicitly associated with primary treatment resistance until now. Previous studies associating CCNE1 with poor outcome in ovarian cancer involved samples drawn from the US Gynecological Oncology Group (GOG) bank (14) and from German patients (13). Our study included patients from Australia, Norway and Japan. Collectively, these findings indicate that CCNE1 amplification is likely to be a marker of primary treatment failure and poor outcome in patients from diverse ethnic backgrounds.
Whilst the independent identification of the CCNE1 amplicon in these studies suggests that is the dominant region of copy number gain associated with poor outcome in ovarian cancer, the mechanism of resistance is unclear. We find that CCNE1 amplification led to expression of cell cycle associated genes. Accelerated repopulation of tumor cells after treatment is a potential mechanism of treatment failure (43) that may be facilitated by CCNE1 amplification in cells ‘hard-wired’ for increased proliferative capacity. However, we also see increased expression of cell cycle genes in the treatment Responsive primary tumors. In addition, increased proliferation, including via forced expression of CCNE1 in ovarian cells in vitro (44), has previously been linked to chemosensitivity rather than chemoresistance (45, 46). Taken together, these seemingly contradictory findings, suggest that cellular proliferation alone may not account for response to chemotherapy. Recently, CCNE1 has been reported to have a role in mediating asymmetric cell division, specifying cell fate and, importantly, in driving stem cell self-renewal, independent of its activity in cellular proliferation (47, 48). Enhanced self-renewal may provide a novel mechanism for treatment failure in patients with tumors bearing a CCNE1 amplification.
Although there was no statistically significant difference in grade between resistant and responsive groups, we note that four cases of Grade 1 serous carcinoma were included in the ‘responsive’ group (Table 1). Interestingly, one low-grade sample represented in the resistant group contained a CCNE1 amplification and is represented in Group A (Figure 3), suggesting that CCNE1 amplification, and poor outcome is not exclusive to high-grade tumours.
By applying gene expression analysis to samples from Resistant patients without CCNE1 amplification, we were able define a distinct molecular subtype of Resistant cases characterized by increased ECM-associated markers. This finding is consistent with our recent analysis of serous tumors that identified a molecular subtype characterized by extracellular matrix, matrix remodeling and stromal response that was were strongly associated with desmoplastic response and poor survival (25). A florid stromal reaction may reflect a host response aimed at containing an aggressive tumor or, alternatively, may directly participate in driving tumor growth (49). Recent findings also indicate that collagen deposition and tumor microenvironment may play a direct role in chemoresistance (50).
In conclusion, we have highlighted biologically aggressive tumors with CCNE1 or NCOA3 amplifications and the role of ECM strongly influence clinical chemoresistance. Given that CCNE1 amplification appears to be consistently associated with short response time (our study) and poor survival (our findings and others), priority should be placed on determining the appropriateness of directing patients carrying CCNE1 amplification for trials with novel treatments, either directly targeting CCNE1 or downstream pathway members. Furthermore, non tumor-centric modes of resistance associated with host tissue elements, such as the ECM or activated stroma, may require alternative therapeutic strategies.
Supplementary Material
Acknowledgments
We thank Britt Edvardsen, Melanie Trivett and Elena Takano for their technical assistance in addition to Maurice Loughrey for additional pathological review of tissue samples.
This study was supported by the U.S. Army Medical Research and Materiel Command under DAMD17-01-1-0729, The Cancer Council Victoria, Queensland Cancer Fund, The Cancer Council New South Wales, The Cancer Council South Australia, The Cancer Foundation of Western Australia, The Cancer Council Tasmania and the National Health and Medical Research Council of Australia (NHMRC), the U.S. Department of Defense grant PC040638 and the Dana-Farber/Harvard Cancer Center Prostate SPORE.
We gratefully acknowledge the cooperation of the following institutions associated with the Australian Ovarian Cancer Study: New South Wales: John Hunter Hospital, North Shore Private Hospital, Royal Hospital for Women, Royal North Shore Hospital, Royal Prince Alfred Hospital, Westmead Hospital; Queensland: Mater Misericordiae Hospital, Royal Brisbane and Women’s Hospital, Townsville Hospital, Wesley Hospital; South Australia: Flinders Medical Centre, Queen Elizabeth II, Royal Adelaide Hospital; Tasmania: Royal Hobart Hospital; Victoria: Freemasons Hospital, Mercy Hospital for Women, Monash Medical Centre, Royal Women’s Hospital; Western Australia: King Edward Memorial Hospital, St John of God Hospitals Subiaco, Sir Charles Gairdner Hospital, Western Australia Research Tissue Network (WARTN): and the Westmead Gynaecological Oncology Tissue Bank, a member of the Australasian Biospecimens Network-Oncology group.
We also acknowledge the contribution of the AOCS Management Group: D Bowtell, G Chenevix-Trench, A Green, P Webb, A deFazio, D Gertig, the study nurses and research assistants and express our gratitude to all women who participated in the study.
References
- 1.Harries M, Gore M. Part I:chemotherapy for epithelial ovarian cancer-treatment at first diagnosis. Lancet Oncol. 2002;3:529–36. doi: 10.1016/s1470-2045(02)00846-x. [DOI] [PubMed] [Google Scholar]
- 2.Bookman MA. Standard treatment in advanced ovarian cancer in 2005: the state of the art. Int J Gynecol Cancer. 2005;15 Suppl 3:212–20. doi: 10.1111/j.1525-1438.2005.00444.x. [DOI] [PubMed] [Google Scholar]
- 3.Kelland L. The resurgence of platinum-based cancer chemotherapy. Nat Rev Cancer. 2007;7:573–84. doi: 10.1038/nrc2167. [DOI] [PubMed] [Google Scholar]
- 4.Pinkel D, Albertson DG. Comparative Genomic Hybridization. Annu Rev Genomics Hum Genet. 2005 doi: 10.1146/annurev.genom.6.080604.162140. [DOI] [PubMed] [Google Scholar]
- 5.Partheen K, Levan K, Osterberg L, Helou K, Horvath G. Analysis of cytogenetic alterations in stage III serous ovarian adenocarcinoma reveals a heterogeneous group regarding survival, surgical outcome, and substage. Genes Chromosomes Cancer. 2004;40:342–8. doi: 10.1002/gcc.20053. [DOI] [PubMed] [Google Scholar]
- 6.Staebler A, Karberg B, Behm J, et al. Chromosomal losses of regions on 5q and lack of high-level amplifications at 8q24 are associated with favorable prognosis for ovarian serous carcinoma. Genes Chromosomes Cancer. 2006;45:905–17. doi: 10.1002/gcc.20356. [DOI] [PubMed] [Google Scholar]
- 7.Kim SW, Kim JW, Kim YT, et al. Analysis of chromosomal changes in serous ovarian carcinoma using high-resolution array comparative genomic hybridization: Potential predictive markers of chemoresistant disease. Genes Chromosomes Cancer. 2007;46:1–9. doi: 10.1002/gcc.20384. [DOI] [PubMed] [Google Scholar]
- 8.Bernardini M, Lee CH, Beheshti B, et al. High-resolution mapping of genomic imbalance and identification of gene expression profiles associated with differential chemotherapy response in serous epithelial ovarian cancer. Neoplasia. 2005;7:603–13. doi: 10.1593/neo.04760. [DOI] [PMC free article] [PubMed] [Google Scholar]
- 9.Birrer MJ, Johnson ME, Hao K, et al. Whole genome oligonucleotide-based array comparative genomic hybridization analysis identified fibroblast growth factor 1 as a prognostic marker for advanced-stage serous ovarian adenocarcinomas. J Clin Oncol. 2007;25:2281–7. doi: 10.1200/JCO.2006.09.0795. [DOI] [PubMed] [Google Scholar]
- 10.Osterberg L, Levan K, Partheen K, Helou K, Horvath G. Cytogenetic analysis of carboplatin resistance in early-stage epithelial ovarian carcinoma. Cancer Genet Cytogenet. 2005;163:144–50. doi: 10.1016/j.cancergencyto.2005.06.023. [DOI] [PubMed] [Google Scholar]
- 11.Suzuki S, Moore DH, Ginzinger DG, et al. An approach to analysis of large-scale correlations between genome changes and clinical endpoints in ovarian cancer. Cancer Res. 2000;60:5382–5. [PubMed] [Google Scholar]
- 12.Nanjundan M, Nakayama Y, Cheng KW, et al. Amplification of MDS1/EVI1 and EVI1, located in the 3q26.2 amplicon, is associated with favorable patient prognosis in ovarian cancer. Cancer Res. 2007;67:3074–84. doi: 10.1158/0008-5472.CAN-06-2366. [DOI] [PubMed] [Google Scholar]
- 13.Mayr D, Kanitz V, Anderegg B, et al. Analysis of gene amplification and prognostic markers in ovarian cancer using comparative genomic hybridization for microarrays and immunohistochemical analysis for tissue microarrays. Am J Clin Pathol. 2006;126:101–9. doi: 10.1309/n6x5mb24bp42kp20. [DOI] [PubMed] [Google Scholar]
- 14.Farley J, Smith LM, Darcy KM, et al. Cyclin E expression is a significant predictor of survival in advanced, suboptimally debulked ovarian epithelial cancers: a Gynecologic Oncology Group study. Cancer Res. 2003;63:1235–41. [PubMed] [Google Scholar]
- 15.Eder AM, Sui X, Rosen DG, et al. Atypical PKCiota contributes to poor prognosis through loss of apical-basal polarity and Cyclin E overexpression in ovarian cancer. Proc Natl Acad Sci U S A. 2005;102:12519–24. doi: 10.1073/pnas.0505641102. [DOI] [PMC free article] [PubMed] [Google Scholar]
- 16.Shih Ie M, Sheu JJ, Santillan A, et al. Amplification of a chromatin remodeling gene, Rsf-1/HBXAP, in ovarian carcinoma. Proc Natl Acad Sci U S A. 2005;102:14004–9. doi: 10.1073/pnas.0504195102. [DOI] [PMC free article] [PubMed] [Google Scholar]
- 17.Cheng KW, Lahad JP, Kuo WL, et al. The RAB25 small GTPase determines aggressiveness of ovarian and breast cancers. Nat Med. 2004 doi: 10.1038/nm1125. [DOI] [PubMed] [Google Scholar]
- 18.Kato H, Arakawa A, Suzumori K, Kataoka N, Young SR. FISH analysis of BRCA1 copy number in paraffin-embedded ovarian cancer tissue samples. Exp Mol Pathol. 2004;76:138–42. doi: 10.1016/j.yexmp.2003.11.005. [DOI] [PubMed] [Google Scholar]
- 19.Lassus H, Leminen A, Vayrynen A, et al. ERBB2 amplification is superior to protein expression status in predicting patient outcome in serous ovarian carcinoma. Gynecol Oncol. 2004;92:31–9. doi: 10.1016/j.ygyno.2003.10.010. [DOI] [PubMed] [Google Scholar]
- 20.Slamon DJ, Godolphin W, Jones LA, et al. Studies of the HER-2/neu proto-oncogene in human breast and ovarian cancer. Science. 1989;244:707–12. doi: 10.1126/science.2470152. [DOI] [PubMed] [Google Scholar]
- 21.Takano M, Fujii K, Kita T, Kikuchi Y, Uchida K. Amplicon profiling reveals cytoplasmic overexpression of MUC1 protein as an indicator of resistance to platinum-based chemotherapy in patients with ovarian cancer. Oncol Rep. 2004;12:1177–82. [PubMed] [Google Scholar]
- 22.Makhija S, Sit A, Edwards R, et al. Identification of genetic alterations related to chemoresistance in epithelial ovarian cancer. Gynecol Oncol. 2003;90:3–9. doi: 10.1016/s0090-8258(03)00177-x. [DOI] [PubMed] [Google Scholar]
- 23.Peiro G, Diebold J, Lohrs U. CAS (cellular apoptosis susceptibility) gene expression in ovarian carcinoma: Correlation with 20q13.2 copy number and cyclin D1, p53, and Rb protein expression. Am J Clin Pathol. 2002;118:922–9. doi: 10.1309/XYCB-UW8U-5541-U4QD. [DOI] [PubMed] [Google Scholar]
- 24.Baker VV, Borst MP, Dixon D, Hatch KD, Shingleton HM, Miller D. c-myc amplification in ovarian cancer. Gynecol Oncol. 1990;38:340–2. doi: 10.1016/0090-8258(90)90069-w. [DOI] [PubMed] [Google Scholar]
- 25.Tothill RW, Tinker AV, George J, et al. Novel molecular subtypes of serous and endometrioid ovarian cancer linked to clinical outcome. Clin Cancer Res. doi: 10.1158/1078-0432.CCR-08-0196. in press. [DOI] [PubMed] [Google Scholar]
- 26.Chi DS, Eisenhauer EL, Lang J, et al. What is the optimal goal of primary cytoreductive surgery for bulky stage IIIC epithelial ovarian carcinoma (EOC)? Gynecol Oncol. 2006;103:559–64. doi: 10.1016/j.ygyno.2006.03.051. [DOI] [PubMed] [Google Scholar]
- 27.Rustin GJ, Nelstrop AE, Tuxen MK, Lambert HE. Defining progression of ovarian carcinoma during follow-up according to CA 125: a North Thames Ovary Group Study. Ann Oncol. 1996;7:361–4. doi: 10.1093/oxfordjournals.annonc.a010602. [DOI] [PubMed] [Google Scholar]
- 28.Vergote I, Rustin GJ, Eisenhauer EA, et al. Re: new guidelines to evaluate the response to treatment in solid tumors [ovarian cancer]. Gynecologic Cancer Intergroup. J Natl Cancer Inst. 2000;92:1534–5. doi: 10.1093/jnci/92.18.1534. [DOI] [PubMed] [Google Scholar]
- 29.Matsuzaki H, Dong S, Loi H, et al. Genotyping over 100,000 SNPs on a pair of oligonucleotide arrays. Nat Methods. 2004;1:109–11. doi: 10.1038/nmeth718. [DOI] [PubMed] [Google Scholar]
- 30.Beroukhim R, Getz G, Nghiemphu L, et al. Assessing the significance of chromosomal aberrations in cancer: Methodology and application to glioma. Proc Natl Acad Sci U S A. 2007;104:20007–12. doi: 10.1073/pnas.0710052104. [DOI] [PMC free article] [PubMed] [Google Scholar]
- 31.Rozen S, Skaletsky H. Primer3 on the WWW for general users and for biologist programmers. Methods Mol Biol. 2000;132:365–86. doi: 10.1385/1-59259-192-2:365. [DOI] [PubMed] [Google Scholar]
- 32.Mi H, Guo N, Kejariwal A, Thomas PD. PANTHER version 6: protein sequence and function evolution data with expanded representation of biological pathways. Nucleic Acids Res. 2007;35:D247–52. doi: 10.1093/nar/gkl869. [DOI] [PMC free article] [PubMed] [Google Scholar]
- 33.Whitfield ML, George LK, Grant GD, Perou CM. Common markers of proliferation. Nat Rev Cancer. 2006;6:99–106. doi: 10.1038/nrc1802. [DOI] [PubMed] [Google Scholar]
- 34.Snijders AM, Nowee ME, Fridlyand J, et al. Genome-wide-array-based comparative genomic hybridization reveals genetic homogeneity and frequent copy number increases encompassing CCNE1 in fallopian tube carcinoma. Oncogene. 2003;22:4281–6. doi: 10.1038/sj.onc.1206621. [DOI] [PubMed] [Google Scholar]
- 35.Park JT, Li M, Nakayama K, et al. Notch3 gene amplification in ovarian cancer. Cancer Res. 2006;66:6312–8. doi: 10.1158/0008-5472.CAN-05-3610. [DOI] [PubMed] [Google Scholar]
- 36.Paige AJ, Taylor KJ, Taylor C, et al. WWOX: a candidate tumor suppressor gene involved in multiple tumor types. Proc Natl Acad Sci U S A. 2001;98:11417–22. doi: 10.1073/pnas.191175898. [DOI] [PMC free article] [PubMed] [Google Scholar]
- 37.Gorringe KL, Jacobs S, Thompson ER, et al. High-resolution single nucleotide polymorphism array analysis of epithelial ovarian cancer reveals numerous microdeletions and amplifications. Clin Cancer Res. 2007;13:4731–9. doi: 10.1158/1078-0432.CCR-07-0502. [DOI] [PubMed] [Google Scholar]
- 38.Tanner MM, Grenman S, Koul A, et al. Frequent amplification of chromosomal region 20q12-q13 in ovarian cancer. Clin Cancer Res. 2000;6:1833–9. [PubMed] [Google Scholar]
- 39.Zhao X, Li C, Paez JG, et al. An integrated view of copy number and allelic alterations in the cancer genome using single nucleotide polymorphism arrays. Cancer Res. 2004;64:3060–71. doi: 10.1158/0008-5472.can-03-3308. [DOI] [PubMed] [Google Scholar]
- 40.Zhao C, Yasui K, Lee CJ, et al. Elevated expression levels of NCOA3, TOP1, and TFAP2C in breast tumors as predictors of poor prognosis. Cancer. 2003;98:18–23. doi: 10.1002/cncr.11482. [DOI] [PubMed] [Google Scholar]
- 41.Hwang HC, Clurman BE. Cyclin E in normal and neoplastic cell cycles. Oncogene. 2005;24:2776–86. doi: 10.1038/sj.onc.1208613. [DOI] [PubMed] [Google Scholar]
- 42.Geng Y, Lee YM, Welcker M, et al. Kinase-independent function of cyclin E. Mol Cell. 2007;25:127–39. doi: 10.1016/j.molcel.2006.11.029. [DOI] [PubMed] [Google Scholar]
- 43.Kim JJ, Tannock IF. Repopulation of cancer cells during therapy: an important cause of treatment failure. Nat Rev Cancer. 2005;5:516–25. doi: 10.1038/nrc1650. [DOI] [PubMed] [Google Scholar]
- 44.Bedrosian I, Lu KH, Verschraegen C, Keyomarsi K. Cyclin E deregulation alters the biologic properties of ovarian cancer cells. Oncogene. 2004;23:2648–57. doi: 10.1038/sj.onc.1207408. [DOI] [PubMed] [Google Scholar]
- 45.Kolfschoten GM, Hulscher TM, Pinedo HM, Boven E. Drug resistance features and S-phase fraction as possible determinants for drug response in a panel of human ovarian cancer xenografts. Br J Cancer. 2000;83:921–7. doi: 10.1054/bjoc.2000.1373. [DOI] [PMC free article] [PubMed] [Google Scholar]
- 46.Jazaeri AA, Awtrey CS, Chandramouli GV, et al. Gene expression profiles associated with response to chemotherapy in epithelial ovarian cancers. Clin Cancer Res. 2005;11:6300–10. doi: 10.1158/1078-0432.CCR-04-2682. [DOI] [PubMed] [Google Scholar]
- 47.Chia W, Prokopenko SN. Cyclin E at the centre of an identity crisis. Nat Cell Biol. 2005;7:3–5. doi: 10.1038/ncb0105-3. [DOI] [PubMed] [Google Scholar]
- 48.Chia W, Somers WG, Wang H. Drosophila neuroblast asymmetric divisions: cell cycle regulators, asymmetric protein localization, and tumorigenesis. J Cell Biol. 2008;180:267–72. doi: 10.1083/jcb.200708159. [DOI] [PMC free article] [PubMed] [Google Scholar]
- 49.Olumi AF, Grossfeld GD, Hayward SW, Carroll PR, Tlsty TD, Cunha GR. Carcinoma-associated fibroblasts direct tumor progression of initiated human prostatic epithelium. Cancer Res. 1999;59:5002–11. doi: 10.1186/bcr138. [DOI] [PMC free article] [PubMed] [Google Scholar]
- 50.Sherman-Baust CA, Weeraratna AT, Rangel LB, et al. Remodeling of the extracellular matrix through overexpression of collagen VI contributes to cisplatin resistance in ovarian cancer cells. Cancer Cell. 2003;3:377–86. doi: 10.1016/s1535-6108(03)00058-8. [DOI] [PubMed] [Google Scholar]
Associated Data
This section collects any data citations, data availability statements, or supplementary materials included in this article.