

Abstract
Aims
We investigated the effects of periodontal therapy on gene expression of peripheral blood monocytes.
Methods
Fifteen patients with periodontitis gave blood samples at four time points: 1 week before periodontal treatment (#1), at treatment initiation (baseline, #2), 6-week (#3) and 10-week post-baseline (#4). At baseline and 10 weeks, periodontal status was recorded and subgingival plaque samples were obtained. Periodontal therapy (periodontal surgery and extractions without adjunctive antibiotics) was completed within 6 weeks. At each time point, serum concentrations of 19 biomarkers were determined. Peripheral blood monocytes were purified, RNA was extracted, reverse-transcribed, labelled and hybridized with AffymetrixU133Plus2.0 chips. Expression profiles were analysed using linear random-effects models. Further analysis of gene ontology terms summarized the expression patterns into biologically relevant categories. Differential expression of selected genes was confirmed by real-time reverse transcriptase-polymerase chain reaction in a subset of patients.
Results
Treatment resulted in a substantial improvement in clinical periodontal status and reduction in the levels of several periodontal pathogens. Expression profiling over time revealed more than 11,000 probe sets differentially expressed at a false discovery rate of <0.05. Approximately 1/3 of the patients showed substantial changes in expression in genes relevant to innate immunity, apoptosis and cell signalling.
Conclusions
The data suggest that periodontal therapy may alter monocytic gene expression in a manner consistent with a systemic anti-inflammatory effect.
Keywords: atherosclerosis, cytokines, genomics, infection, inflammation, periodontitis
Periodontitis is an inflammatory disease of infectious aetiology, caused by the bacterial biofilm that adheres to the tooth surfaces, resulting in loss of sup-porting periodontal tissues and, ultimately, tooth loss (Pihlstrom et al. 2005). It is a fairly common disorder, with its mild/moderate forms affecting the majority of the adult population and severe disease being prevalent in approximately 10-15% (Papapanou 1996).
In the past two decades, accumulating evidence has suggested an association between periodontitis and systemic inflammation, atherosclerosis and vascular disease (for a review, see Behle & Papapanou 2006). These observations are in line with the literature suggesting that several common infectious inflammatory conditions may promote atherogenesis and increase the risk for cardiovascular and cerebrovascular events (Hansson 2005, Elkind & Cole 2006). A number of biologically plausible mechanisms have been proposed to mediate such an association. One possibility is that transient bacteraemias, known to occur after manipulation of the periodontal tissues, may result in bacterial translocation at distant sites. Indeed, the presence of bacterial DNA of oral origin has been documented within endarterectomy specimens or atheromatic plaques in both experimental (Lalla et al. 2003) and human studies (Haraszthy et al. 2000, Stelzel et al. 2002, Fiehn et al. 2005), while a recent study demonstrated the presence of viable periodontal pathogens in atherosclerotic plaques (Kozarov et al. 2005). Another possibility is that inflammatory mediators, produced in abundance locally in inflamed periodontal tissues, may enter the circulation and contribute to a sustained elevated state of systemic inflammation. In fact, several studies have demonstrated that patients with periodontitis display higher plasma levels of acute phase proteins, such as C-reactive protein (CRP), and pro-inflammatory cytokines, such as IL-6, after adjustment for common confounders (Loos et al. 2000, Slade et al. 2000, Wu et al. 2000, Slade et al. 2003). Additional mechanisms include a molecular mimicry pathway (Epstein et al. 2000, Lamb et al. 2003), possibly mediated through antibody responses to bacterial heat-shock proteins of oral origin, as well as a role of periodontitis as a significant contributor to a subject's overall pathogen burden (Epstein et al. 2000) that has been associated with a vascular disease risk.
Lately, several studies have examined the effect of periodontal therapy on a number of surrogate markers of vascular disease to help clarify the mechanisms that might mediate the relationship between periodontal infection and vascular disease. Intervention studies on the effects of periodontal treatment on endothelial dysfunction have concluded that mechanical periodontal therapy alone (Mercanoglu et al. 2004, Elter et al. 2006) or supplemented by local (Tonetti et al. 2007) or systemic antibiotics (Seinost et al. 2005) results in significant improvements in endothelial function. Other investigators have reported that standard mechanical periodontal therapy (D'Aiuto et al. 2004a), particularly when enhanced by adjunctive locally delivered antibiotics (D'Aiuto et al. 2005, 2006), results in significant reductions in serum CRP, IL-6 and improvements in lipid profiles.
In earlier in vitro studies, our group has demonstrated that one of the principal periodontal pathogens, the Gram-negative bacterium Porphyromonas gingivalis, induces its uptake by human macrophages and promotes foam cell formation (Giacona et al. 2004) and also enhances mononuclear cell adhesion to human aortic endothelial cells (Roth et al. 2007). Given the integral role of the monocyte in the host immune system, bridging innate and adaptive immunity, as well as in the inflammatory process of atherosclerosis (Ross 1999), we investigated the effects of comprehensive periodontal therapy on the gene expression of peripheral blood monocytes in patients with severe periodontitis. Our findings demonstrate that local, mechanical periodontal therapy has discernible effects on gene expression patterns of peripheral blood monocytes, consistent with a potential anti-inflammatory/anti-atherogenic effect.
Materials and Methods
Overview
The design and methods of the study were approved by the Columbia University Medical Center Institutional Review Board. In brief, subjects gave their consent, were examined and a first blood sample was obtained 1 week before the commencement of periodontal therapy (#1). A second blood sample was obtained 1 week later, on the day of treatment initiation (baseline, #2). All periodontal treatment including periodontal surgery and tooth extractions, if necessary, but no local or systemic adjunctive antibiotics, was completed within a 6-week time window and a first post-treatment blood sample was obtained at 6 weeks post-baseline (#3). A second post-treatment blood sample (#4) was obtained 4 weeks thereafter, i.e., at 10 weeks post-baseline, at which point a final examination was also carried out. Figure 1 provides an overview of the study design.
Fig. 1.

Study flow chart.
Subject sample
Patients were recruited among those seeking treatment at the clinic for post-doctoral Periodontics, Columbia University College of Dental Medicine. To be eligible for enrollment, patients had to be diagnosed with severe periodontitis, with radiographic evidence of bone loss extending to ≥30% of the root length at multiple teeth. Additional inclusion criteria were: age ≥18 years; the presence of ≥2 teeth/quadrant with a pocket depth of ≥6 mm and concomitant attachment loss of ≥3 mm; a minimum of 20 teeth present; no prior periodontal therapy; no systemic conditions or genetic disorders that entail the diagnosis of periodontitis as a manifestation of systemic diseases (International Workshop for the Classification of Periodontal Diseases and Conditions, 1999); no use of systemic antibiotics or regular use of anti-inflammatory drugs for the preceding 6-month period; no diabetes mellitus; no current use of tobacco products or of nicotine replacement medication; and not currently pregnant. A total of 15 subjects, seven males and eight females, were enrolled. All participants were informed about the scope and procedures of the study and informed consent was obtained.
Clinical examination
At baseline and 10 weeks (time points #2 and #4), all patients underwent a fullmouth examination at six sites per tooth at all teeth present, except third molars. A single, calibrated examiner recorded the following variables:
Probing depth (PD)
Defined as the distance between the gingival margin and the bottom of the probeable pocket to the nearest whole millimetres.
Location of the gingival margin
The distance between the cemento-enamel junction (CEJ) and the gingival margin recorded to the nearest whole millimetres. This measure was given a positive sign in case of gingival recession and a negative sign when the gingival margin was located coronal to the CEJ. The distance was deemed non-readable whenever the CEJ was obscured by dental restorations or was impossible to identify.
The algebraic sum of the above two parameters was used to compute the clinical attachment level (CAL).
The presence of dental plaque (PL), without the use of any disclosing agent, and bleeding on probing (BOP) was recorded dichotomously. The latter was deemed positive if it occurred within 15 s after the assessment of PD.
All recordings were entered chair-side into a computer software and were uploaded to a server at the Statistical Analysis Center, Columbia University Medical Center.
Blood sampling and processing
Approximately 55 ml of blood was obtained by venipuncture from each patient at each of the four time points (#1-#4). Five millilitres were collected in untreated Vacutainer™ blood collection tubes (Becton-Dickinson, Franklin Lakes, NJ, USA) and were used to obtain serum by centrifugation at 1300 g for 10 min. Serum was aliquoted and stored at -70°C until further analysis. Fifty ml were collected in Vacutainer cell preparation tubes with sodium heparin, and were used to harvest peripheral blood mononuclear cells (PBMCs). A 1:1 dilution with PBS was made and the diluted blood sample was centrifuged at 1000 g in Ficoll tubes (Sigma Accuspin, St. Louis, MO, USA). After washing and counting of the cells in a phase haemacytometer (Hauser Scientific, Horsham, PA, USA), PBMCs were re-suspended in 80 μl of MACS buffer (PBS pH 7.2, 0.5% BSA and 2 mM EDTA) and incubated on ice with 20 μl of CD14 microbeads (Miltenyi Biotec, Auburn, CA, USA) per 107 total cells for 15 min. After washings, the cell suspension was applied to a MACS LS separation column (Miltenyi Biotec) placed in the magnetic field of a MACS separator (Miltenyi Biotec). Thereafter, the column was removed from the separator and CD14-positive cells were collected by washings in MACS buffer.
Dental plaque samples
Subgingival PL samples were obtained at baseline and 10 weeks (time points #2 and #4), from the same eight to 10 interproximal surfaces/subject in a randomly selected maxillary quadrant, using sterile curettes as described earlier (Papapanou et al. 2000). The samples were analysed with respect to 11 bacterial species (Aggregatibacter actinomycetemcomitans, P. gingivalis, Tannerella forsythia, Treponema denticola, Fusobacterium nucleatum, Prevotella intermedia, Campylobacter rectus, Micromonas micros, Eikenella corrodens, Veillonella parvula and Actinomyces naeslundii) according to the checkerboard DNA-DNA hybridization method (Socransky et al. 1994), as described earlier (Papapanou et al. 2004).
RNA extraction, reverse transcription, in vitro cRNA synthesis
CD14-positive cells were vigorously pipetted in Trizol (Invitrogen Life Technologies, Carlsbad, CA, USA). After incubation with chloroform and centrifugation at 12,000 g, RNA in the upper aqueous phase was precipitated by mixing with isopropyl alcohol, further centrifugation and washing in 75% ethanol. Further purification of the extracted RNA was achieved using the RNeasy total RNA isolation kit (Qiagen, Valencia, CA, USA) according to the manufacturers' instructions. The purified RNA was quantified spectrophotometrically. One hundred nanograms of total RNA was amplified and reverse transcribed using the GeneChip expression 3′-amplification two-cycle cDNA synthesis kit (Affymetrix, Santa Clara, CA, USA) and the MEGAscript T7 transcription kit (Ambion, Austin, TX, USA) according to the manufacturers' instructions. Synthesis of biotin-labelled cRNA and subsequent fragmentation were performed using the IVT labelling kit (Affymetrix, Santa Clara, CA, USA). The cRNA yield was determined spectrophotometrically at 260 nm. Fragmented cRNA was stored at -80°C until hybridization.
Gene chip hybridizations
We used Affymetrix Human Genome U-133 Plus 2.0 arrays that include 54,675 probe sets to analyse more than 47,000 transcripts including 38,500 wellcharacterized human genes. Hybridizations, probe array scanning and gene expression analysis were performed using the gene chip Core Facility at the Columbia University Genome Center, according to the manufacturer's instructions.
Real-time reverse-transcription polymerase chain reaction (RT-PCR)
Three hundred nanograms of total RNA was reverse-transcribed using the Super-Script II kit (Invitrogen, Carlsbad, CA, USA) and random hexamer primers according to the manufacturer's protocol. The following TaqMan® gene expression assays (Applied Biosystems, Foster City, CA, USA) were used to quantify differential gene expression of the following eight genes: for CD36 antigen (thrombospondin receptor), gene expression assay Hs0169627_m1; for fibrinogen-like 2 (FGL2), Hs0173847_m1; for chondroitin sulphate proteoglycan 2 (versican; CSPG2), Hs0171642_m1; for toll-like receptor 8 (TLR8), Hs0152972_ m1; for toll-like receptor 2 (TLR2), Hs0152932_m1; for integrin α M (complement component 3 receptor 3 subunit; ITGAM), Hs0355885_m1; for toll-like receptor 1 (TLR1), Hs0413978_m1; and for glyceraldehyde-3-phosphate dehydrogenase (GAPDH), Hs99999905_ m1. These assays were chosen to independently quantitate gene expression levels of selected genes identified as strongly differentially expressed by means of the gene chip analysis. Expression assays were performed on an ABI 7300 real-time PCR system (Applied Biosystems) according to the manufacturer's protocol. All samples from each patient were run in triplicate and in the same PCR experiment. Samples using no template and no retrotranscriptases were used as controls and were always negative for amplification.
Assessment of serum mediators
The concentrations of 19 biomarkers were assessed using multiplex assays (Linco Research Inc., St Charles, MO, USA) for Luminex technology, according to the manufacturer's instructions. The assays used were (i) the cardiovascular disease panel 1, for the assessment of adiponectin, matrix metalloproteinase-9, myeloperoxidase, total plasminogen activator inhibitor 1, soluble E-selectin, soluble intercellular adhesion molecule 1 and soluble vascular cellular adhesion molecule 1; (ii) the cardiovascular disease panel two for the assessment of CRP, serum amyloid A and serum amyloid P; and (iii) the high-sensitivity human cytokine panel for the assessments of the following cytokines: IL-1b, IL-2, IL-4, IL-5, IL-6, IL-7, IL-8, IL-10 and TNF-α.
Data analysis
Clinical and serological data
In all analyses, SAS version 9.1 (SAS Institute, Cary, NC, USA) was used and the individual patient was the computational unit. Clinical and microbiological variables were averaged within each patient on each occasion.
The serum analyte data were treated as follows: all analyte values were first natural LN transformed to avoid skewness. The values obtained from the pre-treatment (#1) and baseline (#2) time points were averaged to create a combined pre-treatment value (point 0). A standardized within-person z-score was then created for each of three time points [point 0, early post-treatment (based on values obtained from sample #3), late post-treatment (based on values obtained from sample #4)] by subtracting the mean within person (across time) analyte value from the analyte value at each of the three aforementioned time points and dividing by the within-patient analyte standard deviation (SD). Thus, the calculation of a within-person z-score for analyte i, time j and person k yielded: Zkij = (valuekij-meanki)/(SDki). A total of 57 z-scores (19 analytes × 3 time points) were computed for each patient.
The standardized z-scores were subsequently used in the calculation of a subject-based, summary inflammatory score (SIS) at each of the three time points, by averaging of 19 analyte z-scores. The use of z-scores, rather than the actual analyte values, in the computation of SIS prevented any one analyte from artificially dominating the SIS as a result of scaling differences. z-scores corresponding to the anti-inflammatory mediators IL-10 and adiponectin were multiplied by (-1) before their inclusion in the SIS. Thus, a positive SIS reflected a state of elevated systemic inflammation at the time point of interest relative to the mean value across all three time points. Accordingly, a negative SIS value reflected a relatively reduced level of systemic inflammation.
As a final step, differences between SIS at point 0 and the SIS at the early and late post-treatment time points were used to define the cumulative systemic inflammatory response at 6 and 10 weeks post-baseline, respectively.
Gene expression data
Affymetrix array data were first normalized and summarized using the log-scale robust multi-array analysis (RMA) (Irizarry et al. 2003) with default settings. Differential expression was assayed using a standard mixed-effects linear model approach, in which patient effects were considered random with a normal distribution, and treatment status was considered a fixed effect with three levels (pre-treatment, post-treatment time 1 and post-treatment time 2). A secondary analysis was performed using a fixed-effects linear model with a patient-treatment interaction term to assess whether patient-subgroup-specific changes in expression could be explained by chance. p-Values from the patient-treatment interaction term were used to rank the probe sets, and significance thresholds were determined using the Bonferroni criterion or q-value (Storey & Tibshirani 2003). For each probe set, a fold change was computed by dividing the raw expression value at the final post-treatment time point (#4) by the mean raw expression value of the two pre-treatment points (#1 and #2).
To more precisely identify the within-patient change in gene expression over time due to treatment, as opposed to biological and assay variability, we compared the absolute value of fold change between the baseline and final post-treatment time point with the absolute value of baseline only fold change, i.e., the difference between the two pre-treatment values. The latter fold change served as a control reflective of biological and assay variability. In these computations, absolute values of treatment fold change were used in order to avoid diluting treatment-related changes by averaging up- and down-regulated probe sets within each patient.
Gene ontology (GO) analysis was performed using ermineJ (Lee et al. 2005), with the Gene Score Resampling method. The interaction p-values described above were used as an input to identify biologically relevant groups of genes showing changes in expression with treatment. Gene symbols and descriptions were derived from the most recent Affymetrix annotation file available at the time of analysis (HU-U133_Plus_2_annot_csv. zip) downloaded from http://www.affy metrix.com/Auth/analysis/downloads/taf/HGU133_Plus_2_annot_csv.zip
The gene expression data have been deposited with GEO (accession number GSE6751).
Expression levels based on real-time RT-PCR data were computed by means of the SDS v1.2 relative quantification software (Applied Biosystems) using the ΔΔCt method to normalize all values versus the endogenous control, GAPDH. Differential expression at time points #3 and #4 was calculated by using the average of the two pre-treatment time points (#1 and #2) as the calibrator sample.
Results
The mean age of the enroled patients was 44.4 years (SD 14.0, range 24-77). With respect to race, four patients were White, two Black, seven reported a mixed race and two declined to report.
Within the 6-week treatment window, patients attended an average of 6.3 treatment visits (SD 1.1, range 4-8), including an average of 3.7 periodontal surgery appointments (SD 0.9, range 2-6). An average of 2.9 teeth per patient were extracted (SD 2.6, range 0-8). Figure 2 summarizes the pre- and post-treatment clinical status of the patients with respect to BOP, number of deep pockets (≥6 mm) and periodontal bacteria. As can be seen in Fig. 2a, the pre-treatment BoP scores ranged from 39% to 100% (mean 81%, SD 17%) while the post-treatment scores ranged from 7% to 42% (mean 25%, SD 11%). Figure 2b shows that the number of deep pockets per subject was reduced from a pre-treatment average of 69.2 (SD 32.8, range 36-80) to a post-treatment average of 9.2 (SD 10.5, range 1-18). Figure 2c shows that therapy resulted in a substantial reduction in the levels of several periodontal pathogens including P. gingivalis, T. forsythia, T. denticola, P. intermedia and C. rectus. The levels of health-associated bacteria such as E. corrodens, V. parvula and A. naeslundii were slightly elevated after therapy.
Fig. 2.

Subject based percentage of BOP (a), number of pockets ≥6 mm deep per subject (b), and mean bacterial levels in PL (c) at treatment initiation ("pre-treatment") and at the final examination (“post-treatment”). X-axis describes the patient number. Species abbreviations are as follows: Aa, Aggregatibacter actinomycetemcomitans; Pg, Porphyromonas gingivalis; Tf, Tannerella forsythia; Td, Treponema denticola; Pi, Prevotella intermedia; Fn, Fusobacterium nucleatum; Cr, Campylobacter rectus; Mm, Micromonas micros; Ec, Eikenella corrodens; Vp, Veillonella parvula; An, Actinomyces naeslundii.
The primary analysis of differential expression using a standard mixed-effects linear model showed that there were no significantly altered probe sets based on a Bonferroni correction (family-wise error rate of 0.05), and a single probe set based on false discovery rate (FDR) as estimated with a q-value (corresponding to CLCC1, chloride channel CLIC-like 1, FDR <0.05). Thus, there was little evidence of changes in expression that were consistent across all patients. However, examination of patient-treatment interactions in a separate analysis indicated substantial alterations in expression: 390 probe sets fulfilled the Bonferroni criterion for an overall p-value of 0.05 (i.e., individual p < 9.14 × 10⁻⁷), and a total of 11,714 probe sets were differentially expressed with a maximum FDR of <0.05. Examination of the data using clustering (see Supplementary Data) and visual inspection revealed that there were indeed large changes in expression but only in a subset of patients.
To further explore the potential patient specificity of changes in expression, we examined the magnitude of changes in each patient. Figure 3 illustrates the variability in fold change for the 390 top probe sets across subjects, by plotting the median absolute value of the fold change for each patient at point #4 over the average baseline expression, as well as the fold change between the two pre-treatment time points (#1 and #2), as a control for random variability. Corroborating the existence of patient-specific effects, some patients showed large fold changes, while others showed changes in expression that were not distinguishable from background noise. In particular, there were six patients, by ascending order of fold change #8, 11, 45, 40, 36 and 35, with the most significant (compared with baseline time-point controls, p<0.01, paired one-sided t-test) and the most pronounced change in expression after treatment as compared with pre-treatment (“top responders”).
Fig. 3.
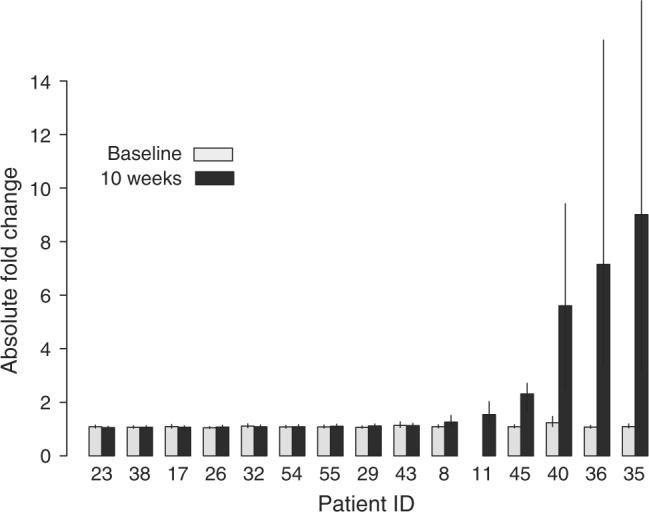
Variability in fold change for top genes across subjects. The median absolute value of the fold change for the top 390 probe sets (those meeting the Bonferroni criterion at a family-wise error rate of 0.05) is plotted for each patient. The light bars represent the fold change in expression between the two pre-treatment time points, representing background variability in expression. The dark bars indicate the fold change in expression between the last point (10-week) and the average baseline expression. Patient 11 had gene expression data for only one baseline time point so the control value could not be computed. The error bars indicate interquartile ranges.
Figure 4 provides a visualization of the top 100 differentially expressed probe sets, listed by an ascending p-value. The figure also lists the FDR of each particular probe set, its fold change at time point #4 over the average expression at time points #1 and #2, as well as the corresponding fold change exclusively based on the six “top responders”. Multiple genes related to immune function are included among the top differentially expressed genes. With respect to the directional effect of the differential expression, 83 out of the top 100 probe sets, 80.5% of the top 390 and 55% of the 11,714 probe sets with an FDR of <0.05 were down-regulated post-treatment. Among the 100 top probe sets, the magnitude of this differential expression for the entire patient group was modest (maximum absolute fold change 1.4) but was sizeable in the top responders (maximum absolute fold change range 10.4).
Fig. 4.
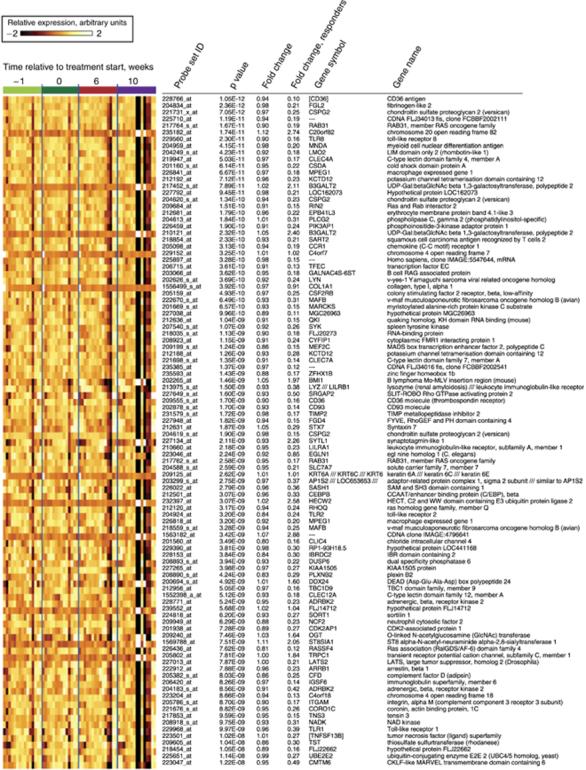
Visualization of the top 100 differentially expressed genes over time. Samples are grouped according to the time point obtained. “Fold change” describes the ratio of expression at time point #4 over the average expression at time points #1 and #2. “Fold change responders” describes the corresponding ratio exclusively based on the six patients with the most pronounced changes in gene expression (“top responders”, pats. # 8, 11, 35, 36, 40 and 45). Gene symbols in brackets (“[]”) are based on a separate sequence analysis for genes for which Affymetrix provided no annotation. Probe sets indicated by “—” in the gene symbol column did not have any associated gene symbol.
Table 1 presents real-time RT-PCR data on the expression levels of seven genes selected among the top 100 listed in Fig. 4, in three “top responders” (patients # 35, 36 and 40). Expression levels at time points #3 and #4 are presented as a ratio of expression at these time points over the average expression at time points #1 and #2. The RT-PCR data confirmed the micro-array-based observations: indeed, CD36 was on average found to be down-regulated by 23-fold, FGL2 by 10-fold, GSPG2 by 30-fold, TLR8 by 19-fold, TLR2 by ninefold, ITGAM by 15-fold while TLR1 was moderately down-regulated in two of the three patients (average ratio 0.87).
Table 1.
Differential expression of selected genes post-treatment in the three “top responders” assessed by real-time RT-PCR
| Patient no. | Gene |
||||||
|---|---|---|---|---|---|---|---|
| CD36 | FGL2 | CSP2 | TLR8 | TLR2 | ITGAM | TLR1 | |
| 35 | 0.02 | 0.08 | 0.01 | 0.02 | 0.03 | 0.03 | 0.63 |
| 36 | 0.04 | 0.07 | 0.01 | 0.05 | 0.09 | 0.05 | 0.74 |
| 40 | 0.08 | 0.17 | 0.07 | 0.08 | 0.20 | 0.12 | 1.23 |
| Average | 0.04 | 0.110 | 0.03 | 0.05 | 0.11 | 0.07 | 0.87 |
Values represent the expression ratio at time point #4 over the average expression at the two pre-treatment time points.
CD36, thrombosponding receptor; FGL2, fibrinogen-like 2; CSPG2, chondroitin sulfate proteogly-can 2 (versican); TLR8, toll-like receptor 8; TLR2, toll-like receptor 2; ITGAM, integrin, alpha M (complement component 3 receptor 3 subunit); TLR1, toll-like receptor 1.
GO analysis identified 211 classes as significant at a p-value of 0.05. Table 2 lists the top 100 differentially expressed classes along with the fraction of probes within the class that underwent a significant change in expression (i.e., with an FDR of <0.05). In all but a single GO group within the top 100 differentially expressed classes, the fraction of significantly changed probes exceeded 50%. Thus, the significance of these classes was supported by large numbers of differentially expressed genes. A wide range of biological processes was represented among the differentially expressed GO classes, including apoptosis, endocytosis, signal transduction, fatty acid metabolism, antimicrobial humoral response and oxidative phosphorylation.
Table 2.
Top 100 differentially expressed gene ontology groups. “# genes” and “# probes” describe the number of genes and probes, respectively, included in each group
| Gene ontology (GO) group description | GO ID | Corrected p-value | # Genes | # Probes | Fraction of significantly changed probes | |
|---|---|---|---|---|---|---|
| 1 | Negative regulation of progression through cell cycle | GO:0045786 | 5.98E-10 | 176 | 582 | 74 |
| 2 | Regulation of apoptosis | GO:0042981 | 1.196E-09 | 126 | 379 | 69 |
| 3 | Ubiquitin-dependent protein catabolism | GO:0006511 | 2.333E-09 | 137 | 390 | 70 |
| 4 | Translation | GO:0043037 | 2.712E-09 | 157 | 396 | 69 |
| 5 | Endocytosis | GO:0006897 | 2.919E-09 | 136 | 402 | 75 |
| 6 | Modification-dependent protein catabolism | GO:0019941 | 2.92E-09 | 116 | 338 | 69 |
| 7 | Induction of apoptosis | GO:0006917 | 8.834E-08 | 142 | 454 | 76 |
| 8 | Positive regulation of signal transduction | GO:0009967 | 1.081E-07 | 108 | 303 | 66 |
| 9 | RNA metabolism | GO:0016070 | 1.556E-07 | 127 | 352 | 69 |
| 10 | Regulation of I-kappaB kinase/NF-kappaB cascade | GO:0043122 | 1.724E-07 | 98 | 273 | 64 |
| 11 | Anti-apoptosis | GO:0006916 | 1.907E-07 | 121 | 323 | 73 |
| 12 | Protein metabolism | GO:0019538 | 2.343E-07 | 178 | 494 | 75 |
| 13 | Negative regulation of apoptosis | GO:0043066 | 2.387E-07 | 141 | 360 | 74 |
| 14 | Protein kinase cascade | GO:0007243 | 3.698E-07 | 111 | 350 | 72 |
| 15 | Nuclear mRNA splicing, via spliceosome | GO:0000398 | 4.399E-07 | 156 | 412 | 69 |
| 16 | RNA splicing, via transesterification reactions with bulged adenosine as nucleophile | GO:0000377 | 4.627E-07 | 154 | 406 | 69 |
| 17 | Regulation of programmed cell death | GO:0043067 | 4.743E-07 | 86 | 255 | 69 |
| 18 | Regulation of Rho protein signal transduction | GO:0035023 | 4.895E-07 | 72 | 264 | 77 |
| 19 | Positive regulation of I-kappaB kinase/NF-kappaB cascade | GO:0043123 | 5.289E-07 | 92 | 250 | 64 |
| 20 | Positive regulation of apoptosis | GO:0043065 | 9.354E-07 | 129 | 417 | 74 |
| 21 | Secretory pathway | GO:0045045 | 0.000001469 | 146 | 439 | 74 |
| 22 | Actin cytoskeleton organization and biogenesis | GO:0030036 | 0.000002869 | 130 | 455 | 79 |
| 23 | Induction of programmed cell death | GO:0012502 | 0.000006975 | 109 | 310 | 72 |
| 24 | Regulation of translation | GO:0006445 | 0.000008306 | 94 | 252 | 67 |
| 25 | Negative regulation of cell proliferation | GO:0008285 | 0.00001519 | 164 | 426 | 77 |
| 26 | Protein targeting | GO:0006605 | 0.0000216 | 101 | 268 | 74 |
| 27 | Biological process unknown | GO:0000004 | 0.00002282 | 107 | 271 | 72 |
| 28 | Rho protein signal transduction | GO:0007266 | 0.00002294 | 90 | 334 | 77 |
| 29 | Cell division | GO:0051301 | 0.00002324 | 176 | 488 | 78 |
| 30 | Interphase of mitotic cell cycle | GO:0051329 | 0.00002346 | 50 | 156 | 69 |
| 31 | ATP metabolism | GO:0046034 | 0.00002794 | 33 | 71 | 62 |
| 32 | ATP synthesis coupled proton transport | GO:0015986 | 0.00002942 | 49 | 116 | 66 |
| 33 | Golgi vesicle transport | GO:0048193 | 0.00007368 | 96 | 288 | 73 |
| 34 | Dephosphorylation | GO:0016311 | 0.00007535 | 149 | 428 | 75 |
| 35 | Organelle organization and biogenesis | GO:0006996 | 0.0001081 | 158 | 483 | 80 |
| 36 | rRNA processing | GO:0006364 | 0.0001347 | 87 | 200 | 67 |
| 37 | Negative regulation of transcription | GO:0016481 | 0.0001359 | 101 | 321 | 77 |
| 38 | mRNA export from nucleus | GO:0006406 | 0.0001403 | 46 | 108 | 65 |
| 39 | RNA splicing | GO:0008380 | 0.0001422 | 73 | 206 | 65 |
| 40 | Negative regulation of transcription from RNA polymerase II promoter | GO:0000122 | 0.000153 | 77 | 199 | 75 |
| 41 | Positive regulation of transcription, DNA-dependent | GO:0045893 | 0.0001635 | 98 | 383 | 80 |
| 42 | Translational initiation | GO:0006413 | 0.0001662 | 58 | 181 | 66 |
| 43 | Fatty acid metabolism | GO:0006631 | 0.0001915 | 129 | 338 | 74 |
| 44 | Negative regulation of nucleobase, nucleoside, nucleotide and nucleic acid metabolism | GO:0045934 | 0.0001919 | 64 | 205 | 74 |
| 45 | Protein amino acid dephosphorylation | GO:0006470 | 0.0001922 | 139 | 403 | 76 |
| 46 | Mitosis | GO:0007067 | 0.000196 | 148 | 392 | 75 |
| 47 | Negative regulation of transcription, DNA-dependent | GO:0045892 | 0.0001973 | 122 | 332 | 78 |
| 48 | Cell cycle arrest | GO:0007050 | 0.0001988 | 78 | 233 | 66 |
| 49 | Regulation of small GTPase mediated signal transduction | GO:0051056 | 0.0002001 | 96 | 333 | 79 |
| 50 | MAPKKK cascade | GO:0000165 | 0.0002034 | 79 | 221 | 71 |
| 51 | Actin filament-based process | GO:0030029 | 0.0002068 | 106 | 364 | 79 |
| 52 | ATP biosynthesis | GO:0006754 | 0.0002079 | 54 | 123 | 67 |
| 53 | Ribosome biogenesis | GO:0007046 | 0.0002647 | 99 | 219 | 68 |
| 54 | Chromatin modification | GO:0016568 | 0.0003129 | 119 | 371 | 79 |
| 55 | Cytoskeleton organization and biogenesis | GO:0007010 | 0.0004188 | 106 | 331 | 81 |
| 56 | Regulation of translational initiation | GO:0006446 | 0.0004491 | 37 | 112 | 58 |
| 57 | Carboxylic acid metabolism | GO:0019752 | 0.0005162 | 159 | 416 | 79 |
| 58 | Establishment and/or maintenance of chromatin architecture | GO:0006325 | 0.0005255 | 150 | 463 | 77 |
| 59 | Response to virus | GO:0009615 | 0.0005433 | 85 | 163 | 67 |
| 60 | rRNA metabolism | GO:0016072 | 0.0006408 | 85 | 196 | 68 |
| 61 | M phase of mitotic cell cycle | GO:0000087 | 0.0007082 | 134 | 349 | 74 |
| 62 | Energy-coupled proton transport, down electrochemical gradient | GO:0015985 | 0.0007109 | 49 | 116 | 66 |
| 63 | mRNA transport | GO:0051028 | 0.0008505 | 47 | 113 | 63 |
| 64 | Receptor mediated endocytosis | GO:0006898 | 0.0009344 | 29 | 79 | 76 |
| 65 | DNA replication | GO:0006260 | 0.0009652 | 138 | 402 | 78 |
| 66 | Cell motility | GO:0006928 | 0.0009984 | 161 | 490 | 80 |
| 67 | Protein ubiquitination | GO:0016567 | 0.001189 | 61 | 171 | 74 |
| 68 | Calcium-mediated signaling | GO:0019722 | 0.001319 | 29 | 101 | 70 |
| 69 | Second-messenger-mediated signaling | GO:0019932 | 0.001362 | 57 | 134 | 70 |
| 70 | Antimicrobial humoral response (sensu Vertebrata) | GO:0019735 | 0.001445 | 97 | 200 | 71 |
| 71 | DNA-dependent DNA replication | GO:0006261 | 0.001464 | 52 | 119 | 68 |
| 72 | G1/S transition of mitotic cell cycle | GO:0000082 | 0.001495 | 24 | 69 | 62 |
| 73 | Response to endogenous stimulus | GO:0009719 | 0.001563 | 167 | 450 | 77 |
| 74 | I-kappaB kinase/NF-kappaB cascade | GO:0007249 | 0.001565 | 40 | 101 | 64 |
| 75 | Detection of biotic stimulus | GO:0009595 | 0.001595 | 21 | 41 | 54 |
| 76 | Oxidative phosphorylation | GO:0006119 | 0.001642 | 55 | 128 | 67 |
| 77 | RNA export from nucleus | GO:0006405 | 0.001829 | 56 | 127 | 66 |
| 78 | Positive regulation of transcription from RNA polymerase II promoter | GO:0045944 | 0.001918 | 42 | 166 | 75 |
| 79 | Ribosome biogenesis and assembly | GO:0042254 | 0.001955 | 75 | 166 | 68 |
| 80 | Regulation of cell growth | GO:0001558 | 0.002472 | 126 | 350 | 81 |
| 81 | Positive regulation of cell proliferation | GO:0008284 | 0.002495 | 127 | 315 | 75 |
| 82 | tRNA aminoacylation | GO:0043039 | 0.002611 | 44 | 95 | 67 |
| 83 | Chemotaxis | GO:0006935 | 0.002619 | 118 | 225 | 76 |
| 84 | Membrane lipid metabolism | GO:0006643 | 0.0027 | 32 | 85 | 67 |
| 85 | Protein amino acid glycosylation | GO:0006486 | 0.002737 | 111 | 286 | 75 |
| 86 | ER to Golgi vesicle-mediated transport | GO:0006888 | 0.002759 | 71 | 218 | 74 |
| 87 | Cell growth | GO:0016049 | 0.002879 | 122 | 360 | 79 |
| 88 | Microspike biogenesis | GO:0030035 | 0.002922 | 7 | 28 | 54 |
| 89 | Hexose metabolism | GO:0019318 | 0.002941 | 52 | 127 | 71 |
| 90 | Regulation of Cdc42 GTPase activity | GO:0043088 | 0.003189 | 8 | 26 | 50 |
| 91 | Activation of protein kinase activity | GO:0032147 | 0.00321 | 46 | 137 | 70 |
| 92 | Protein import into nucleus | GO:0006606 | 0.003246 | 51 | 171 | 68 |
| 93 | Phagocytosis | GO:0006909 | 0.003729 | 20 | 54 | 69 |
| 94 | Organ morphogenesis | GO:0009887 | 0.003855 | 127 | 372 | 81 |
| 95 | Proton transport | GO:0015992 | 0.004084 | 54 | 135 | 73 |
| 96 | Purine ribonucleoside triphosphate biosynthesis | GO:0009206 | 0.004127 | 43 | 88 | 67 |
| 97 | Regulation of cellular physiological process | GO:0051244 | 0.004351 | 110 | 303 | 79 |
| 98 | Positive regulation of transcription | GO:0045941 | 0.004509 | 91 | 303 | 79 |
| 99 | Cellular defense response | GO:0006968 | 0.004552 | 107 | 234 | 74 |
| 100 | Induction of apoptosis by extracellular signals | GO:0008624 | 0.004555 | 39 | 137 | 78 |
“Fraction of significantly changed probes” describes the percentage of probes that underwent a change in expression with FDR < 0.05. FDR, false discovery rate.
Finally, Fig. 5 illustrates the differences in patient-based SIS between time point #3 and pre-treatment (“Early SIS change”, Fig. 5a), and time point #4 and pre-treatment (“Late SIS change”), Fig. 5b. While eight out of 15 patients appeared to display an overall decrease in their levels of serum inflammatory mar- kers at the end of active therapy (point #3), a rebound towards higher levels of systemic inflammation appeared to occur between the third and fourth examination time points. Interestingly, all six “top responders” were among the ones with a positive late SIS change.
Fig. 5.

Summary inflammatory score (SIS) change at completion of treatment (“Early SIS Change”; (a) and at the last examination (“Late SIS Change”; (b). X-axis describes the patient number. “Top responders” indicated by darker bars. For SIS computation, see “Materials and methods”.
Discussion
To our knowledge, this is the first study to examine the relationship between the treatment of a localized infection, i.e., periodontitis, on global gene expression signatures of peripheral blood cells. In a group of patients with severe periodontitis, we demonstrate that local, mechanical anti-infective periodontal therapy has discernible effects on gene expression patterns of peripheral blood monocytes, i.e., on a cell population known to play an integral role in the host immune system as well as in the process of atherogenesis.
Given the attention that has been directed lately towards the systemic effects of periodontal infections, the present intervention study is particularly timely, and a number of elements of its design and findings deserve further comment. First, we enroled subjects with a significant oral infectious burden, as demonstrated by the pre-treatment clinical periodontal data and the baseline levels of periodontal pathogens in their subgingival plaque (Fig. 2). To be able to account for temporal variation in gene expression signatures and serum inflammatory mediator levels unrelated to the provided intervention, we obtained a pair of pre-treatment blood samples 1 week apart and carried out double pre-treatment gene expression and serological assessments. The antiinfective periodontal therapy included in all instances non-surgical debridement, followed by a minimum of two sessions of periodontal surgery (range 2-6), depending on each patient's individual treatment needs. Teeth deemed to be non-salvageable were always extracted, and treatment of endodontic infections was also provided when needed, in an attempt to eradicate all sources of oral infection during active treatment to the extent possible. However, we deliberately elected not to administer adjunctive antibiotics (systemic or local), to preclude confounding due to concomitant effects on occult non-oral infections. Importantly, all therapy was completed within a window of 6 weeks, and two post-treatment blood draws, one immediately upon completion of therapy and one 4 weeks later, were obtained. Parallel to the study of monocytic gene expression signatures that were the study's primary outcome, we also assessed multiple serum inflammatory mediators, to be able to correlate differences in gene expression to the actual systemic inflammatory status of the patients. Although inclusion of an untreated control group was not feasible for ethical reasons, enrollment of patients into the study occurred consecutively over a 2-year period, precluding any systematic, treatment-unrelated seasonal effect on gene expression or mediator levels. Collectively, our data provide a rather comprehensive view of the early effects of periodontal therapy on systemic inflammation.
Our findings demonstrate that periodontal therapy had discernible effects in monocytic gene expression. A comparison of gene expression levels at the last visit with the average pre-treatment levels revealed that more than 11,000 probe sets were differentially expressed with an FDR of <0.05, although the overall magnitude of these effects in the entire group was limited. However, the data also showed much more profound effects in a subset comprising approximately one-third of the enrolled cohort (Fig. 3), with a maximum absolute fold change for the top differentially expressed probe set amounting to 10.4 in this “responder” group (Fig. 4).
Several genes with interesting biological functions were encountered among the top 100 differentially expressed (Fig. 4), and were in their vast majority down-regulated. These observations were largely confirmed by real-time RT-PCR data (Table 1). The top gene, CD36, encodes for a glycoprotein that serves as a receptor for thrombospondin, which may function as a cell adhesion molecule by binding to collagen thrombospondin, anionic phospholipids and oxidized LDL. CD36 expression has recently been shown to be related to macrophage activation (Puig-Kroger et al. 2006), while soluble CD36 has been related to accelerated atherosclerosis in type 2 diabetes, and has been proposed to represent a marker of metabolic syndrome and a potential surrogate marker for atherosclerosis (Handberg et al. 2006). The third top gene (CSPG2) codes for chondroitin sulphate proteoglycan (versican), an important protein in wound healing and tissue remodelling that was recently shown to promote blood coagulation by suppressing the activity of tissue factor pathway inhibitor-1 (Zheng et al. 2006), to be induced in infiltrated monocytes during experimental myocardial infarction in an animal model (Toeda et al. 2005) and to be involved in oxidative stressinduced apoptosis (Wu et al. 2005). Similarly, the gene encoding for the integrin α M chain (ITGAM), which was also found to be down-regulated, contributes to the formation of a leucokyte-specific integrin that is important in the adherence of neutrophils and monocytes to stimulated endothelium and the firm adhesion and transmigration of leucokytes at sites of platelet deposition (Wang et al. 2005).
Interestingly, genes coding for TLR 8, 2, 1 and 4 were also found to be down-regulated after treatment. TLRs are highly conserved proteins that play a fundamental role in the recognition of pathogen-associated molecular patterns and mediate the production of necessary cytokines for the development of effective innate immunity (Morris et al. 2006). Multiple roles of TLR signalling in atherosclerosis have been described (Edfeldt et al. 2002, Mullick et al. 2005, Bjorkbacka 2006). TLR-4 was shown to be expressed by macrophages in murine and human lipid-rich atherosclerotic plaques and up-regulated by oxidized LDL (Xu et al. 2001). Interactions of oral pathogens with TLR-2 have been demonstrated (Harokopakis & Hajishengallis 2005, Hajishengallis et al. 2006, Harokopakis et al. 2006) and proposed to be involved in the atherosclerotic process (Hajishengallis et al. 2002).
As shown in Table 2, multiple GO groups relevant to several biological processes were differentially expressed after treatment, and a majority of the genes comprising these groups was in fact significantly affected. Such groups included apoptosis, endocytosis, chemotaxis and signal transduction (I-kB kinase/NF-kB cascade; Rho protein sig- nal transduction; small GTPase-mediated signal transduction; MAPKKK cascade; calcium-mediated signalling).
The effects of periodontal therapy on the levels of serum inflammatory mediators observed in this study are not entirely consistent with earlier reports (D'Aiuto et al. 2004a, b). The post-therapy clinical periodontal data obtained concomitantly with the final blood draw suggest that the therapy provided resulted in substantial reductions in gingival inflammation and pocket depth compared with the pre- treatment status. These data were corroborated by the qualitative micro- biological assessments that revealed a considerable reduction in subgingival levels of several periodontal pathogens including P. gingivalis, T. forsythia and T. denticola (Fig. 2c), although, in accordance with the literature that sug- gests that elimination of A. actinomyte- mecomitans is consistently achieved only though adjunctive systemic anti- biotic therapy (Slots & Ting 2002), A. actinomytemecomitans levels were unaffected. Nevertheless, a review of the PL scores at the last examination showed considerable levels of supra- gingival re-colonization, with average post-treatment plaque scores ranging between 52% and 77% (data not shown). Thus, it appears plausible that this rebound towards a recurrent bacter- ial stimulus 4 weeks after completion of therapy may underlie, at least in part, the shift towards a state of elevated sys- temic inflammation observed between the completion of therapy and the final examination. A comparison between the present findings and similar data pub- lished in the literature should be carried out with caution for several reasons: first, in the present report the systemic inflammatory status of each participant is characterized by a composite score that took into account levels of 19 individual serum biomarkers. In con- trast, the studies available today have focused on a small number of inflam- matory mediators, notably CRP and IL- 6. Second, the duration of periodontal therapy as well as the post-treatment time points at which these mediators were assessed in other studies are dif- ferent from the ones used here. For example, in studies carried out by D'Aiuto et al. (2004a, b), the therapeutic phase ranged from 1 to 3 months after the baseline visit, and the subsequent exam- inations were performed at 2 and 6 months after the completion of the treat- ment. Thus, the follow-up assessments of systemic inflammation in these studies are significantly more remote from baseline than those in the present study and, thereby, likely depending on a successful long-term maintenance of the therapeutic result. Finally, despite an overall favourable effect of periodontal therapy on CRP levels, a substantial variation in individual treatment responses has been documented (D'Aiuto et al. 2005).
The observation that the most pronounced differences in monocytic gene expression occurred in patients who all displayed a positive SIS at the last visit is perplexing and somewhat counterintuitive. Clearly, serum levels of inflam- matory mediators are dependent on the degree of activation of multiple cell populations, and the recorded shifts in gene expression signatures of peripheral monocytes should be viewed as a result rather than a cause of the patient's systemic inflammatory status. Nevertheless, despite the fact that the vast majority of the top 100 differentially expressed genes were down-regulated, approximately 45% of the genes changed with an FDR of 0.05 or less were in fact up-regulated. Obviously, in the interpretation of the biological processes in play, the functions of the involved genes are equally important as are the directional effects of the change in expression. Further studies are needed to analyse in detail the dynamics of the effect of periodontal therapy on the level of specific biomarers and its relation to monocytic gene expression.
Clinical Relevance.
Scientific rationale for the study: To expand our knowledge on the systemic effects of periodontal therapy, we studied changes in gene expression of peripheral monocytes in patients who received comprehensive periodontal therapy without adjunctive systemic antibiotics.
Principal findings: We observed discernible effects on monocytic gene expression after therapy, particularly pronounced in approximately onethird of the patients, and affecting genes relevant to innate immunity, apoptosis and cell signalling.
Practical implications: Periodontal therapy had profound, yet variable effects on gene expression signatures of peripheral blood monocytes, i.e., on blood cells central to the process of atherosclerosis. Our findings are consistent with a systemic antiinflammatory effect of periodontal treatment.
Supplementary Material
Acknowledgements
We are grateful to Elena Schwartz, RDH, for performing the clinical periodontal examinations, and to Richard Buchsbaum for the set-up and maintenance of databases.
Financial support was provided by the National Institutes of Health (grant # DE015,649), and an unrestricted gift by Colgate-Palmolive, NJ, USA.
Footnotes
Conflict of interest and source of funding The authors declare that they have no conflict of interests.
Supplementary material The following material is available for this article online: Fig. S1. Dendrogram for hierarchical clustering of expression profiles for all patient samples. Data for the top 500 probe sets showing interactions between patient and treatment were used as input for average linkage hierarchical clustering. Samples for several patients corresponding to post-treatment time points cluster together. This result supports the idea that there is a relatively coherent response in some patients that we refer to as top responders in the main text, especially in patients 35, 36 and 40.
Fig. S2. Visualization of the pairwise correlations of the expression profiles for each sample in the study. Data from all probe sets was used as input. Darker colors indicate lower correlations (correlations less that 0.75 would be shown as black, see scale bar). This figure indicates that a subset of samples exhibit substantially lower correlations with other samples. These largely correspond to post-treatment time points from patients identified as “top responders”, for example samples from patients 40, 36, 35 and 45.
This material is available as part of the online article from: http://www.blackwell-synergy.com/doi/abs/10.1111/j.1600-051X.2007.01113.x (This link will take you to the article abstract)
Publisher's Disclaimer: Please note: Blackwell Publishing is not responsible for the content or func- tionality of any supplementary materials supplied by the authors. Any queries (other than missing material) should be directed to the corresponding author for the article.
References
- Behle JH, Papapanou PN. Periodontal infections and atherosclerotic vascular disease: an update. International Dental Journal. 2006;56:256–262. doi: 10.1111/j.1875-595x.2006.tb00110.x. [DOI] [PubMed] [Google Scholar]
- Bjorkbacka H. Multiple roles of Toll-like receptor signaling in atherosclerosis. Current Opinion in Lipidology. 2006;17:527–533. doi: 10.1097/01.mol.0000245258.25387.ec. [DOI] [PubMed] [Google Scholar]
- D'Aiuto F, Nibali L, Parkar M, Suvan J, Tonetti MS. Short-term effects of intensive periodontal therapy on serum inflammatory markers and cholesterol. Journal of Dental Research. 2005;84:269–273. doi: 10.1177/154405910508400312. [DOI] [PubMed] [Google Scholar]
- D'Aiuto F, Parkar M, Andreou G, Suvan J, Brett PM, Ready D, Tonetti MS. Periodontitis and systemic inflammation: control of the local infection is associated with areduction in serum inflammatory markers. Journal of Dental Research. 2004a;83:156–160. doi: 10.1177/154405910408300214. [DOI] [PubMed] [Google Scholar]
- D'Aiuto F, Parkar M, Nibali L, Suvan J, Lessem J, Tonetti MS. Periodontal infections cause changes in traditional and novel cardiovascular risk factors: results from a randomized controlled clinical trial. American Heart Journal. 2006;151:977–984. doi: 10.1016/j.ahj.2005.06.018. [DOI] [PubMed] [Google Scholar]
- D'Aiuto F, Ready D, Tonetti MS. Periodontal disease and Creactive protein-associated cardiovascular risk. Journal of Periodontal Research. 2004b;39:236–241. doi: 10.1111/j.1600-0765.2004.00731.x. [DOI] [PubMed] [Google Scholar]
- Edfeldt K, Swedenborg J, Hansson GK, Yan ZQ. Expression of toll-like receptors in human atherosclerotic lesions: a possible pathway for plaque activation. Circulation. 2002;105:1158–1161. [PubMed] [Google Scholar]
- Elkind MS, Cole JW. Do common infections cause stroke? Seminars in Neurology. 2006;26:88–99. doi: 10.1055/s-2006-933312. [DOI] [PubMed] [Google Scholar]
- Elter JR, Hinderliter AL, Offenbacher S, Beck JD, Caughey M, Brodala N, Madianos PN. The effects of periodontal therapy on vascular endothelial function: a pilot trial. American Heart Journal. 2006;151:47. doi: 10.1016/j.ahj.2005.10.002. [DOI] [PubMed] [Google Scholar]
- Epstein SE, Zhu J, Burnett MS, Zhou YF, Vercellotti G, Hajjar D. Infection and atherosclerosis: potential roles of pathogen burden and molecular mimicry. Arteriosclerosis, Thrombosis & Vascular Biology. 2000;20:1417–1420. doi: 10.1161/01.atv.20.6.1417. [DOI] [PubMed] [Google Scholar]
- Fiehn NE, Larsen T, Christiansen N, Holmstrup P, Schroeder TV. Identification of periodontal pathogens in atherosclerotic vessels. Journal of Periodontology. 2005;76:731–736. doi: 10.1902/jop.2005.76.5.731. [DOI] [PubMed] [Google Scholar]
- Giacona MB, Papapanou PN, Lamster IB, Rong LL, D'Agati VD, Schmidt AM, Lalla E. Porphyromonas gingivalis induces its uptake by human macrophages and promotes foam cell formation in vitro. FEMS Microbiology Letters. 2004;241:95–101. doi: 10.1016/j.femsle.2004.10.009. [DOI] [PubMed] [Google Scholar]
- Hajishengallis G, Sharma A, Russell MW, Genco RJ. Interactions of oral pathogens with toll-like receptors: possible role in atherosclerosis. Annals of Periodontology. 2002;7:72–78. doi: 10.1902/annals.2002.7.1.72. [DOI] [PubMed] [Google Scholar]
- Hajishengallis G, Wang M, Harokopakis E, Triantafilou M, Triantafilou K. Porphyromonas gingivalis fimbriae proactively modulate beta2 integrin adhesive activity and promote binding to and internalization by macrophages. Infection and Immunity. 2006;74:5658–5666. doi: 10.1128/IAI.00784-06. [DOI] [PMC free article] [PubMed] [Google Scholar]
- Handberg A, Levin K, Hojlund K, Beck-Nielsen H. Identification of the oxidized low-density lipoprotein scavenger receptor CD36 in plasma: a novel marker of insulin resistance. Circulation. 2006;114:1169–1176. doi: 10.1161/CIRCULATIONAHA.106.626135. [DOI] [PubMed] [Google Scholar]
- Hansson GK. Inflammation, atherosclerosis, and coronary artery disease. New England Journal of Medicine. 2005;352:1685–1695. doi: 10.1056/NEJMra043430. [DOI] [PubMed] [Google Scholar]
- Haraszthy VI, Zambon JJ, Trevisan M, Zeid M, Genco RJ. Identification of periodontal pathogens in atheromatous plaques. Journal of Periodontology. 2000;71:1554–1560. doi: 10.1902/jop.2000.71.10.1554. [DOI] [PubMed] [Google Scholar]
- Harokopakis E, Albzreh MH, Martin MH, Hajishengallis G. TLR2 transmodulates monocyte adhesion and transmigration via Rac1- and PI3K-mediated inside-out signaling in response to Porphyromonas gingivalis fimbriae. Journal of Immunology. 2006;176:7645–7656. doi: 10.4049/jimmunol.176.12.7645. [DOI] [PubMed] [Google Scholar]
- Harokopakis E, Hajishengallis G. Integrin activation by bacterial fimbriae through a pathway involving CD14, Toll-like receptor 2, and phosphatidylinositol-3-kinase. European Journal of Immunology. 2005;35:1201–1210. doi: 10.1002/eji.200425883. [DOI] [PubMed] [Google Scholar]
- International Workshop for the Classification of Periodontal Diseases and Conditions Consensus report: periodontitis as a manifestation of systemic diseases. Annals of Periodontology. 1999;4M:64. [Google Scholar]
- Irizarry RA, Bolstad BM, Collin F, Cope LM, Hobbs B, Speed TP. Summaries of Affymetrix GeneChip probe level data. Nucleic Acids Research. 2003;31:e15. doi: 10.1093/nar/gng015. [DOI] [PMC free article] [PubMed] [Google Scholar]
- Kozarov EV, Dorn BR, Shelburne CE, Dunn WA, Jr., Progulske-Fox A. Human atherosclerotic plaque contains viable invasive Actinobacillus actinomycetemcomitans and Porphyromonas gingivalis. Arteriosclerosis Thrombosis and Vascular Biology. 2005;25:e17–e18. doi: 10.1161/01.ATV.0000155018.67835.1a. [DOI] [PubMed] [Google Scholar]
- Lalla E, Lamster IB, Hofmann MA, Bucciarelli L, Jerud AP, Tucker S, Lu Y, Papapanou PN, Schmidt AM. Oral infection with a periodontal pathogen accelerates early atherosclerosis in apolipoprotein E-null mice. Arteriosclerosis Thrombosis and Vascular Biology. 2003;23:1405–1411. doi: 10.1161/01.ATV.0000082462.26258.FE. [DOI] [PubMed] [Google Scholar]
- Lamb DJ, El-Sankary W, Ferns GA. Molecular mimicry in atherosclerosis: a role for heat shock proteins in immunisation. Atherosclerosis. 2003;167:177–185. doi: 10.1016/s0021-9150(02)00301-5. [DOI] [PubMed] [Google Scholar]
- Lee HK, Braynen W, Keshav K, Pavlidis P. ErmineJ: tool for functional analysis of gene expression data sets. BMC Bioinformatics. 2005;6:269. doi: 10.1186/1471-2105-6-269. [DOI] [PMC free article] [PubMed] [Google Scholar]
- Loos BG, Craandijk J, Hoek FJ, Wertheim-van Dillen PM, van der Velden U. Elevation of systemic markers related to cardiovascular diseases in the peripheral blood of periodontitis patients. Journal of Periodontology. 2000;71:1528–1534. doi: 10.1902/jop.2000.71.10.1528. [DOI] [PubMed] [Google Scholar]
- Mercanoglu F, Oflaz H, Oz O, Gokbuget AY, Genchellac H, Sezer M, Nisanci Y, Umman S. Endothelial dysfunction in patients with chronic periodontitis and its improvement after initial periodontal therapy. Journal of Periodontology. 2004;75:1694–1700. doi: 10.1902/jop.2004.75.12.1694. [DOI] [PubMed] [Google Scholar]
- Morris GE, Parker LC, Ward JR, Jones EC, Whyte MK, Brightling CE, Bradding P, Dower SK, Sabroe I. Cooperative molecular and cellular networks regulate Toll-like receptor-dependent inflammatory responses. FASEB Journal. 2006;20:2153–2155. doi: 10.1096/fj.06-5910fje. [DOI] [PubMed] [Google Scholar]
- Mullick AE, Tobias PS, Curtiss LK. Modulation of atherosclerosis in mice by Toll-like receptor 2. Journal of Clinical Investigation. 2005;115:3149–3156. doi: 10.1172/JCI25482. [DOI] [PMC free article] [PubMed] [Google Scholar]
- Papapanou PN. Periodontal diseases: epidemiology. Annals of Periodontology. 1996;1:1–36. doi: 10.1902/annals.1996.1.1.1. [DOI] [PubMed] [Google Scholar]
- Papapanou PN, Abron A, Verbitsky M, Picolos D, Yang J, Qin J, Fine JB, Pavlidis P. Gene expression signatures in chronic and aggressive periodontitis: a pilot study. European Journal of Oral Science. 2004;112:216–223. doi: 10.1111/j.1600-0722.2004.00124.x. [DOI] [PubMed] [Google Scholar]
- Papapanou PN, Neiderud A-M, Papadimitriou A, Sandros J, Dahlén G. “Checkerboard” assessments of periodontal microbiota and serum antibody responses: a case-control study. Journal of Periodontology. 2000;71:885–897. doi: 10.1902/jop.2000.71.6.885. [DOI] [PubMed] [Google Scholar]
- Pihlstrom BL, Michalowicz BS, Johnson NW. Periodontal diseases. Lancet. 2005;366:1809–1820. doi: 10.1016/S0140-6736(05)67728-8. [DOI] [PubMed] [Google Scholar]
- Puig-Kroger A, Dominguez-Soto A, Martinez-Munoz L, Serrano-Gomez D, Lopez-Bravo M, Sierra-Filardi E, Fernandez-Ruiz E, Ruiz-Velasco N, Ardavin C, Groner Y, Tandon N, Corbi AL, Vega MA. RUNX3 negatively regulates CD36 expression in myeloid cell lines. Journal of Immunology. 2006;177:2107–2114. doi: 10.4049/jimmunol.177.4.2107. [DOI] [PubMed] [Google Scholar]
- Ross R. Atherosclerosis - an inflammatory disease. New England Journal of Medicine. 1999;340:115–126. doi: 10.1056/NEJM199901143400207. [DOI] [PubMed] [Google Scholar]
- Roth GA, Moser B, Roth-Walter F, Giacona MB, Harja E, Papapanou PN, Schmidt AM, Lalla E. Infection with a periodontal pathogen increases mononuclear cell adhesion to human aortic endothelial cells. Atherosclerosis. 2007;190:271–281. doi: 10.1016/j.atherosclerosis.2006.03.018. [DOI] [PubMed] [Google Scholar]
- Seinost G, Wimmer G, Skerget M, Thaller E, Brodmann M, Gasser R, Bratschko RO, Pilger E. Periodontal treatment improves endothelial dysfunction in patients with severe periodontitis. American Heart Journal. 2005;149:1050–1054. doi: 10.1016/j.ahj.2004.09.059. [DOI] [PubMed] [Google Scholar]
- Slade GD, Ghezzi EM, Heiss G, Beck JD, Riche E, Offenbacher S. Relationship between periodontal disease and Creactive protein among adults in the Atherosclerosis Risk in Communities study. Archives of Internal Medicine. 2003;163:1172–1179. doi: 10.1001/archinte.163.10.1172. [DOI] [PubMed] [Google Scholar]
- Slade GD, Offenbacher S, Beck JD, Heiss G, Pankow JS. Acutephase inflammatory response to periodontal disease in the US population. Journal of Dental Research. 2000;79:49–57. doi: 10.1177/00220345000790010701. [DOI] [PubMed] [Google Scholar]
- Slots J, Ting M. Systemic antibiotics in the treatment of periodontal disease. Periodontology 2000. 2002;28:106–176. doi: 10.1034/j.1600-0757.2002.280106.x. [DOI] [PubMed] [Google Scholar]
- Socransky SS, Smith C, Martin L, Paster BJ, Dewhirst FE, Levin AE. “Checkerboard” DNA-DNA hybridization. Biotechniques. 1994;17:788–792. [PubMed] [Google Scholar]
- Stelzel M, Conrads G, Pankuweit S, Maisch B, Vogt S, Moosdorf R, Flores-de-Jacoby L. Detection of Porphyromonas gingivalis DNA in aortic tissue by PCR. Journal of Periodontology. 2002;73:868–870. doi: 10.1902/jop.2002.73.8.868. [DOI] [PubMed] [Google Scholar]
- Storey JD, Tibshirani R. Statistical significance for genomewide studies. Proceedings of the National Academy of Sciences. 2003;100:9440–9445. doi: 10.1073/pnas.1530509100. [DOI] [PMC free article] [PubMed] [Google Scholar]
- Toeda K, Nakamura K, Hirohata S, Hatipoglu OF, Demircan K, Yamawaki H, Ogawa H, Kusachi S, Shiratori Y, Ninomiya Y. Versican is induced in infiltrating monocytes in myocardial infarction. Molecular and Cellular Biochemistry. 2005;280:47–56. doi: 10.1007/s11010-005-8051-4. [DOI] [PubMed] [Google Scholar]
- Tonetti M, D'Aiuto F, Nibali L, Donald A, Storry C, Parkar M, Suvan J, Hingorani AD, Vallance P, Deanfield J. Treatment of periodontitis and endothelial function. New England Journal of Medicine. 2007;356:911–920. doi: 10.1056/NEJMoa063186. [DOI] [PubMed] [Google Scholar]
- Wang Y, Sakuma M, Chen Z, Ustinov V, Shi C, Croce K, Zago AC, Lopez J, Andre P, Plow E, Simon DI. Leukocyte engagement of platelet glycoprotein Ibalpha via the integrin Mac-1 is critical for the biological response to vascular injury. Circulation. 2005;112:2993–3000. doi: 10.1161/CIRCULATIONAHA.105.571315. [DOI] [PubMed] [Google Scholar]
- Wu T, Trevisan M, Genco RJ, Falkner KL, Dorn JP, Sempos CT. Examination of the relation between periodontal health status and cardiovascular risk factors: serum total and high density lipoprotein cholesterol, Creactive protein, and plasma fibrinogen. American Journal of Epidemiology. 2000;151:273–282. doi: 10.1093/oxfordjournals.aje.a010203. [DOI] [PubMed] [Google Scholar]
- Wu Y, Wu J, Lee DY, Yee A, Cao L, Zhang Y, Kiani C, Yang BB. Versican protects cells from oxidative stress-induced apoptosis. Matrix Biology. 2005;24:3–13. doi: 10.1016/j.matbio.2004.11.007. [DOI] [PubMed] [Google Scholar]
- Xu XH, Shah PK, Faure E, Equils O, Thomas L, Fishbein MC, Luthringer D, Xu XP, Rajavashisth TB, Yano J, Kaul S, Arditi M. Toll-like receptor-4 is expressed by macrophages in murine and human lipid-rich atherosclerotic plaques and upregulated by oxidized LDL. Circulation. 2001;104:3103–3108. doi: 10.1161/hc5001.100631. [DOI] [PubMed] [Google Scholar]
- Zheng PS, Reis M, Sparling C, Lee DY, La Pierre DP, Wong CK, Deng Z, Kahai S, Wen J, Yang BB. Versican G3 domain promotes blood coagulation through suppressing the activity of tissue factor pathway inhibitor-1. Journal of Biological Chemistry. 2006;281:8175–8182. doi: 10.1074/jbc.M509182200. [DOI] [PubMed] [Google Scholar]
Associated Data
This section collects any data citations, data availability statements, or supplementary materials included in this article.