

Abstract

The N-H bond length in backbone peptide groups of the protein GB3 has been studied by liquid crystal NMR, using five structurally conserved mutants of this protein. In the absence of additional information, the impact of dynamic fluctuations of the N-H vector orientation on the 15N-1H dipolar interaction cannot be separated from a change in N-H bond length. However, a change in N-H bond length directly impacts the orientation of C′-H vectors in the peptide group, and simultaneous analysis of 13C′-HN and 15N-HN residual dipolar couplings, measured under five different alignment orientations, permits modelfree determination of the average equilibrium N-H bond length in GB3, yielding rNHeq = 1.008 ± 0.006 Å. Anharmonicity of the bond stretching results in a slightly longer time-averaged bond length <rNH> = 1.015 ± 0.006 Å, and an effective bond length reff = <rNH-3>-1/3 = 1.023 ± 0.006 Å pertinent for NMR relaxation analysis, not including the impact of zero-point or other angular fluctuations in N-H orientation. Using a reference frame defined by the backbone Cα-C′ vectors of the protein, angular fluctuations for N-H vectors in elements of secondary structure are approximately 1.5 fold larger for out-of-plane fluctuations than motions within the peptide plane and not much larger than anticipated on the basis of quantum mechanical analysis of their zero-point librations.
Quantitative interpretation of 15N NMR relaxation rates in terms of motion hinges on the value of the 15N-1H internuclear distance. Neutron diffraction of small model peptides suggested a value of 1.020-1.024 Å.1 From an NMR relaxation perspective, spectral density terms resulting from ultrafast motions such as zero-point librations do not significantly contribute to relaxation and simply attenuate the effective internuclear 15N-1H dipolar coupling. Their impact is therefore similar to a lengthening of the N-H bond, and an increased effective bond length can be used to remove the effect of the nearly uniform normal mode librations and vibrations from the modelfree order parameters, often extracted from such data.2 Internal motions also scale the internuclear dipolar couplings observed in solid state and liquid crystal NMR, with both technologies potentially providing access to quantitative analysis of the amplitude and direction of motions integrated over the entire sub-ms time scale. Although the equilibrium N-H bond length is known to be sensitive to hydrogen bonding, DFT calculations indicate this dependence to be weak for normal, high barrier hydrogen bonds, with an approximate 0.01 Å decrease in rNHeq when rH..O increases from 1.8 to 2.5 Å, in agreement with prior computational results (Supporting Information).2,3
Quantum mechanics defines the lowest vibrational states of any molecular bond. A detailed description of the impact of normal mode vibrations (bond stretching) and librations (bending) on NMR-observable parameters has been presented by Case.2 Different definitions of the bond length are required for different purposes (Fig. 1A): The equilibrium bond length, rNHeq, corresponds to the internuclear distance of lowest energy. The average <rNH> distance includes averaging over the lowest vibrational bond stretching mode, which due to anharmonicity of the potential is calculated to be ca 0.015 Å longer than rNHeq. From an NMR relaxation perspective, where the strength of the dipolar coupling scales with rNH-3, the pertinent bond length equals reff = <rNH-3>-1/3. As motions of the N-H bond vector caused by processes other than the universal and largely structure-independent zero-point normal mode librations and vibrations also scale the 15N-1H dipolar interaction, it has remained difficult to establish experimentally precise baseline values for <rNH> and reff. Here, we report concerted measurement and analysis of 13C′-13Cα, 13C′-1HN and 15N-1HN residual dipolar couplings (RDCs), measured at very high precision in perdeuterated, amide-protonated forms of five mutants of the small and previously well-studied protein GB3. These mutants, K19AD47K, K19ED40N, K19AT11K, and two which include a C- and N-terminal His-tag, K19EK4A-C-His6 and K19EK4A-N-His6, previously were shown to map the five-dimensional alignment space when dissolved in a liquid crystalline Pf1 suspension.4 Using an improved stability, iterative implementation5 of the DIDC method,6 alignment tensors are derived independent of a starting structure, i.e. with no adverse impact from coordinate uncertainty in the reference model. Alternate iterative approaches can also be used for this purpose.7,8 Excluding the invisible N-terminus, four residues identified by iterative DIDC as highly dynamic, and five residues for which resonance overlap interfered with accurate measurement of 13C′-13Cα, 13C′-1HN or 15N-1HN RDCs in one or more of the five mutants, leaves 45 sets of three RDCs per mutant for analysis.
Figure 1.
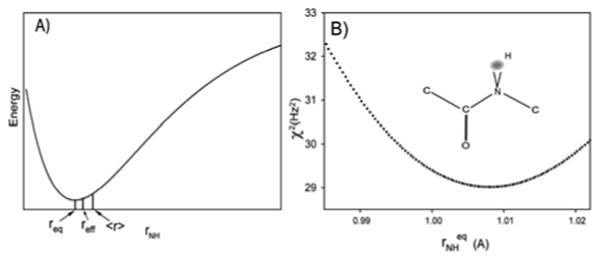
Amide N-H bond length in peptide groups. (A) Bond energy versus rNH bond length, and definitions of rNHeq, <rNH>, and reff (<rNH−3>−1/3). (B) Total χ2 fitting error of Cα-HN RDCs to GB3 structure (see text) as a function of rNHeq, with , where i is the alignment index and j is the residue index. Values for <rNH> and reff follow directly from rNHeq (see Figure S2). The HN cloud in the inset represents the proton distribution generated using eq S28.
Assuming uniform C′-Cα and N-HN bond lengths, the alignment tensor coefficients derived from the iterative DIDC method can be written in matrix format, Amat, and their ratio (Fig. 2)
Figure 2.

Alignment matrix elements obtained using iterative DIDC5 from Cα-C′ RDCs (y axis) versus values obtained from N-H RDCs. Matrix elements result from five mutants, each measured twice with slightly different HNCO experiments and different GB3 and Pf1 concentrations.
| (1) |
represents the ratio of the strengths of the 13C′-13Cα and 15N-1HN dipolar interaction constants, which falls very close to the value previously reported9 using ubiquitin RDCs and its X-ray structure. Besides the assumption of uniform C′-Cα and N-HN bond lengths, two additional approximations are used in eq 1: First, all 45 included residues have uniform SNH as well as SC′Cα order parameters. Second, angular internal motion of C′-Cα and N-HN vectors, which determines SNH and SC′Cα, is assumed to be axially symmetric. Using simulated data, we previously have shown5 that the impact of these approximations upon the derived Amat values, used to calculate the ratio in eq 1, is much smaller than the uncertainty caused by RDC measurement error. The very tight correlation observed in Fig. 2 also confirms the validity of these assumptions.
With values for the average order parameters SC′Cα and SNH being unknown, the RDC data do not uniquely define <rNH−3> and <rCαC′-3>. The brackets, < >, denote vibrational averaging, where for Cα-C′ to a very good approximation,2 <rCαC′> = <rCαC′−3>−1/3 = 1.525 Å.10 By defining S′NH=SNH/SC′Cα, a value of
| (2) |
is then obtained from the Amat ratios (Fig. 2). Note that S′NH defines the order of the N-H vectors relative to the average order parameter of the Cα-C′ vectors, which is taken as a proxy for the motion of the entire backbone, including C′-N and N-Cα vectors. Fluctuations of the peptide plane about the Cαi-1-Cαi vector, so-called γ motions,11-14 have a larger impact on the orientations of Ni-Hi vectors than on the backbone Cαi-1-C′i-1 , C′i-1-Ni and Ni-Cαi vectors. Together with zero-point librations of the N-H vector, these motions therefore dominate the impact on S′NH. The problem of finding the average N-H bond length and angular motion is now reduced to solving the positional distribution of the HN nuclei relative to the backbone frame.
Considering that N-H bond stretching motions occur at higher frequencies than librational motions, librational and stretching motions to first order can be considered uncorrelated, allowing factorization of the positional distribution of the proton associated with any given N-H vector:
| (3a) |
where ρ1(r) denotes bond stretching (Supporting Info. Eq S25) and
| (3b) |
separates the angular motion into in-plane (σv) and out-of-plane (σu) components, described by two independent Gaussian distributions. Bond stretching motions impact averaging of the inverse cubic dependence of 15N-1H dipolar couplings on rNH. Based on the narrow range of infrared N-H stretching frequencies, the amplitudes of such motions are quite uniform, and their impact can be calculated (Supporting Information) to yield:
| (4) |
In our study, the time-averaged N-H orientations are taken from the iterative DIDC analysis of the very high precision RDC data, recorded on the perdeuterated mutants of GB3. High accuracy of these N-H orientations is exemplified by exceptionally good fits to the 3JHNHα Karplus curve (rmsd 0.33 Hz; Supporting Information). Three independent parameters σu, σv and <rNH> are then determined by fitting C′-HN and 15N-1H RDCs data to eq 3.
We employ a two-stage procedure when fitting the positional distribution of each amide proton to the ten RDCs (Ni-Hi and C′i-1-Hi RDCs for each of the five GB3 mutants): First, the axially symmetric internal motion model is applied, assuming uniform σu = σv values for all 45 residues included in the analysis. Whereas in this model the internal motion would not be separable from a change in bond length if only N-H RDCs were considered, the two-bond C′-HN RDCs lift this degeneracy because the N-H bond length also impacts the C′-HN vector orientations. Second, after a global value for rNHeq has been determined, rNHeq is fixed at this value and the constraint σu = σv is removed. This then makes it possible to evaluate the N-H motional asymmetry by simultaneously fitting σu and σv to the five sets of C′-HN and 15N-1H RDCs. Below, we describe these two stages in more detail.
In the first stage, the amide protons of the previously determined GB3 structure (PDB entry 2OED)15 are replaced by axially symmetric Gaussian distributions centered around the N-H vector orientations obtained from the above iterative DIDC analysis of the very high precision RDC data. Since the orientation of the molecular frame obtained from iterative DIDC analysis is arbitrary, it first needs to be overlaid with that of the experimental 2OED structure. For this purpose, the 13C′-13Cα RDCs are best-fit to the 2OED coordinates. Then, using all 45 DIDC-accepted N-H vectors, the optimal value of <rNH> follows from a one-dimensional search: For each value of <rNH>, an axially symmetric Gaussian distribution of 33,635 N-H vectors is generated where the width is defined by S′NH, obtained from S′NH<rNH-3> = 0.872 Å-3. The ρ1(r) distribution in this ensemble (and thereby <rNH>, as well as reff and rNHeq, cf eq 4) is described by standard quantum statistical mechanics (Supporting Information Eq S24), and a singular value decomposition (SVD) fit of the C′-HN RDCs to this ensemble yields χ2.
The <rNH> obtained from this search (Fig. 1B), 1.023Å, is in excellent agreement with neutron scattering data (Table 1) and also agrees remarkably well with a prior NMR analysis of less precise RDCs, which neglected the effect of N-H bond stretching and libration but used a three-parameter model for motions of rigid peptide planes.13 The <S′NH> = 0.910 value we obtain when using <rNH> = 1.023Å is smaller than the 0.938 value expected for zero-point motion alone (Table 1). Backbone motions other than those affecting the reference Cα-C′ vectors are responsible for this difference. For example, γ motions around the Cα-Cα axis11-14 have little impact on the Cα-C′ axis due to the small angle (∼20°) between these axes, but strongly affect the N-H vectors, oriented nearly perpendicular to Cαi-1-Cαi.
Table 1.
Average dynamics parameters and amide N-H bond lengths (Å).
| rNHeqa | reffb | <rNH> c | S′NH | σtrg | S′C′HNh | |
|---|---|---|---|---|---|---|
| this work d | 1.008 ± 0.006 | 1.015 ± 0.006 | 1.023 ± 0.006 | 0.910 ± 0.016 | 9.9° ± 0.9° | 0.981 ± 0.004 |
| Others | 1.022e | 0.938f | 8.2°f | 0.994f |
req is the equilibrium bond length;
reff = <rNH-3>-1/3, where <…> denotes the bond stretching average;
<r> is the stretching-averaged bond length with the difference between req and <r> resulting from anharmonicity;
Uncertainty in the averaged value based on jackknife analysis;
<rNH> from neutron scattering1;
Value for N-H zero point libration in N-methylacetamide, obtained from MP2 quantum calculation, divided by the corresponding SCαC′ value of 0.990.
σtr = (σu2 + σv2)1/2.
S′C′HN is the C′-HN order parameter relative to the Cα-C′-N backbone.
In the second stage, we explore the motional asymmetry of the N-H bond vector. Using the ρ1(r) function that corresponds to <rNH> = 1.023Å, the N-H and C′-HN RDCs are fit to ensembles of structures where the two parameters S′NH and η (asymmetry of motion parameter)5,6 define the ellipsoidal cone-shaped Gaussian distributions of the proton positions, corresponding to independent σu and σv values (eq 3b). Rather than fitting individual S′NH and η values for each residue, which is adversely affected by error propagation, N-H vectors in each of the four β strands as well as the single α-helix are treated as having the same S′NH and η, and a two-dimensional grid search for the S′NH and η values yielding the best fit to C′-HN and N-H RDCs is carried out. Results are summarized in Table 2. The principal axes of the ellipsoidal cones are defined such that positive η values correspond to out-of-plane motion being larger than in-plane motion, as is found for all five fragments. To provide a more intuitive picture of these motions, the corresponding rms angular fluctuations are also listed in Table 2. In agreement with earlier analyses,5,12,16 we find the largest motional amplitude in solvent-exposed Igg-recognition strand β2.
Table 2.
Average dynamics parameters of individual secondary structure fragments. a
| β1 | β2 | β3 | β4 | α1 | |
|---|---|---|---|---|---|
| S′NH b | 0.923±0.029 | 0.867±0.032 | 0.924±0.025 | 0.931±0.011 | 0.900±0.026 |
| ηNH | 0.016±0.026 | 0.048±0.026 | 0.024±0.020 | 0.017±0.011 | 0.025±0.045 |
| In-planec | 8 ± 3° | 9 ± 1° | 7 ± 3° | 7 ± 1° | 9 ± 5° |
| Out-of plane c | 10 ± 1° | 15 ± 3° | 11 ± 2° | 10 ± 1° | 12 ± 3° |
Extracted from 5 independent alignment N-H and C′-HN RDCs fitting, comprising residues Y3-N8 (β1), K13-K19 (β2), E42-D46 (β3), T51-T55 (β4), and (A23-D36) α1, values include the effect of zero point motions;
The error is the standard deviation within each element of secondary structure, obtained from standard jackknife analysis;
Root-mean-square amplitude of motion.
The value <rNH> = 1.023Å obtained from our study is equivalent to an effective bond length reff = 1.015Å. This is considerably smaller than the reff = 1.041 Å value obtained when a rigid model is used to relate 15N-1H RDCs to 13Cα-13C′ and 13C′-15N RDCs, where both the zero-point librations and the impact of larger angular fluctuations about the Cα-Cα axis (γ motions) are absorbed into reff. For analysis of 15N NMR relaxation data, factoring out only the nearly uniform effect of zero-point N-H librations2 increases reff by 2.2% to 1.037 Å. This latter value is appropriate when characterizing backbone dynamics from 15N relaxation data, but note that site-to-site deviations from this value can be as large as ±0.005 Å (Supporting Information Fig. S5). The effect of γ motions should not be absorbed into reff as such motions are relaxation active and can vary residue by residue.
The RDCs used in the present study were obtained for perdeuterated mutants of GB3, yielding narrower line widths and removal of very small systematic RDC errors resulting from cross-correlated relaxation.17 The new RDCs are therefore more accurate than values used in prior GB3 studies.5,12 Analysis of these new RDC values in terms of N-H order parameters, in the exact same manner as previously carried out for the protonated GB3 mutants,5 yields values that lack the S > 1 outliers obtained previously. Excepting the three highly mobile residues K10-L12, RDC-derived S values agree remarkably well (pairwise rmsd 0.03) with those obtained from 15N relaxation16 (Supporting Information Fig. S4).
Supplementary Material
Acknowledgments
This work was supported in part by the Intramural Research Program of the NIDDK, NIH, and by the Intramural AIDS-Targeted Antiviral Program of the Office of the Director, NIH. We thank D.A. Torchia for useful discussions.
Footnotes
Supporting Information Available: Theoretical analysis of positional distribution of HN under zero-point motion; calculated impact of H-bonding on rNHeq; plot of experimental 3JHNHα vs DIDC-derived dihedral angle; tables with RDC values.
References
- 1.Kvick A, Alkaraghouli AR, Koetzle TF. Acta Crystallogr Sect B-Struct Commun. 1977;33:3796–3801. [Google Scholar]
- 2.Case DA. J Biomol NMR. 1999;15:95–102. doi: 10.1023/a:1008349812613. [DOI] [PubMed] [Google Scholar]
- 3.Guo H, Karplus M. J Phys Chem. 1992;96:7273–7287. [Google Scholar]
- 4.Yao LS, Bax A. J Am Chem Soc. 2007;129:11326–11327. doi: 10.1021/ja073937+. [DOI] [PubMed] [Google Scholar]
- 5.Yao L, Vogeli B, Torchia DA, Bax A. J Phys Chem B. 2008;112:6045–6056. doi: 10.1021/jp0772124. [DOI] [PubMed] [Google Scholar]
- 6.Tolman JR. J Am Chem Soc. 2002;124:12020–12030. doi: 10.1021/ja0261123. [DOI] [PubMed] [Google Scholar]
- 7.Lakomek NA, Carlomagno T, Becker S, Griesinger C, Meiler J. J Biomol NMR. 2006;34:101–115. doi: 10.1007/s10858-005-5686-0. [DOI] [PubMed] [Google Scholar]
- 8.Lange OF, Lakomek NA, Fares C, Schroder GF, Walter KFA, Becker S, Meiler J, Grubmuller H, Griesinger C, de Groot BL. Science. 2008;320:1471–1475. doi: 10.1126/science.1157092. [DOI] [PubMed] [Google Scholar]
- 9.Ottiger M, Bax A. J Am Chem Soc. 1998;120:12334–12341. [Google Scholar]
- 10.Engh RA, Huber R. Acta Crystallogr A. 1991;47:392–400. [Google Scholar]
- 11.Lienin SF, Bremi T, Brutscher B, Bruschweiler R, Ernst RR. J Am Chem Soc. 1998;120:9870–9879. [Google Scholar]
- 12.Bouvignies G, Bernado P, Meier S, Cho K, Grzesiek S, Bruschweiler R, Blackledge M. Proc Natl Acad Sci U S A. 2005;102:13885–13890. doi: 10.1073/pnas.0505129102. [DOI] [PMC free article] [PubMed] [Google Scholar]
- 13.Bernado P, Blackledge M. J Am Chem Soc. 2004;126:4907–4920. doi: 10.1021/ja036977w. [DOI] [PubMed] [Google Scholar]
- 14.Bremi T, Bruschweiler R. J Am Chem Soc. 1997;119:6672–6673. [Google Scholar]
- 15.Ulmer TS, Ramirez BE, Delaglio F, Bax A. J Am Chem Soc. 2003;125:9179–9191. doi: 10.1021/ja0350684. [DOI] [PubMed] [Google Scholar]
- 16.Hall JB, Fushman D. J Biomol NMR. 2003;27:261–275. doi: 10.1023/a:1025467918856. [DOI] [PubMed] [Google Scholar]
- 17.de Alba E, Tjandra N. J Magn Reson. 2006;183:160–165. doi: 10.1016/j.jmr.2006.08.003. [DOI] [PubMed] [Google Scholar]
Associated Data
This section collects any data citations, data availability statements, or supplementary materials included in this article.