Abstract
Recent studies have established that vitamin D plays multiple biological roles beyond calcium metabolism; however, whether vitamin D is involved in energy metabolism is unknown. To address this question, we characterized the metabolic phenotypes of vitamin D receptor (VDR)-null mutant mice. Under a normocalcemic condition, VDR-null mice displayed less body fat mass and lower plasma triglyceride and cholesterol levels compared with wild-type (WT) mice; when placed on a high-fat diet, VDR-null mice showed a slower growth rate and accumulated less fat mass globally than WT mice, even though their food intake and intestinal lipid transport capacity were the same as WT mice. Consistent with the lower adipose mass, plasma leptin levels were lower and white adipocytes were histologically smaller in VDR-null mice than WT mice. The rate of fatty acid β-oxidation in the white adipose tissue was higher, and the expression of uncoupling protein (UCP) 1, UCP2 and UCP3 was markedly upregulated in VDR-null mice, suggesting a higher energy expenditure in the mutant mice. Experiments using primary brown fat culture confirmed that 1,25-dihydroxyvitamin D3 directly suppressed the expression of the UCPs. Consistently, the energy expenditure, oxygen consumption, and CO2 production in VDR-null mice were markedly higher than in WT mice. These data indicate that vitamin D is involved in energy metabolism and adipocyte biology in vivo in part through regulation of β-oxidation and UCP expression.
Keywords: adipocytes, uncoupling proteins, energy metabolism
obesity, characterized by excess body adipose mass, is a major risk factor for the metabolic syndrome, an increasingly prevalent health problem that is associated with cardiovascular disease, type II diabetes, and cancer (21). Adipose tissues exist in two forms, white adipose tissue (WAT) and brown adipose tissue (BAT). WAT, the storage depot of the body, stores excess energy in the form of triglyceride. In addition, WAT releases signals such as leptin to inform the body of its energy state (19, 20). The main function of BAT is to regulate thermogenesis. BAT expresses uncoupling proteins (UCPs) that separate oxidative phosphorylation from ATP production, producing heat in place of ATP (15, 17, 34). BAT expresses three UCPs, UCP1, UCP2, and UCP3. The primary role of UCP1 is the dissipation of energy as heat. The primary roles of UCP2 and UCP3 are less well characterized; however, both proteins have uncoupling capabilities (15, 17).
The vitamin D receptor (VDR) is a member of the nuclear receptor superfamily that mediates the actions of 1α,25-dihydroxyvitamin D3 [1,25(OH)2D3], the hormonal form of vitamin D (22). The classical function of 1,25(OH)2D3 is to regulate calcium homeostasis (12, 24). However, VDR is expressed in cells not involved in calcium metabolism, and 1,25(OH)2D3 is involved in the regulation of many noncalcemic functions (36). Previous studies have shown that 1,25(OH)2D3 suppresses adipocyte differentiation in 3T3-L1 preadipocytes (6, 26); however, the in vivo role of 1,25(OH)2D3 and VDR in adipogenesis and metabolism remains unknown. In the present study, we used VDR-null mutant mice as a model to address this question. Our data provide evidence that VDR plays a role in energy metabolism, at least in part, through regulation of the UCPs.
MATERIALS AND METHODS
Animals and treatment.
One-month-old C57BL/6 wild-type (WT) and VDR-deficient [VDR(−/−)] mice were weaned on a high lactose-high calcium diet (HCa, TD.96348, Harlan Teklad), which was able to normalize the plasma calcium level in VDR(−/−) mice as reported previously (28). For high-fat-diet feeding, mice were maintained on the HCa diet for 4 mo and then switched to a high-fat diet (HF, containing 42% fat, TD.88137; Harlan Teklad) and high-calcium water (containing 2 mM CaCl2) for 5 wk. The mice were weighed weekly to monitor their body weight. At the end of the treatment, the animals were killed, and plasma, WAT, and BAT were harvested. To measure intestinal triglyceride absorption, mice were gavaged with 250 μl olive oil after 6 h of fasting. Blood triglyceride levels were determined at different time points following the gavage. Before the gavage, the mice were injected intraperitoneally with 3.33 ml/kg body wt of 15% Triton [a lipoprotein lipase (LPL) inhibitor] to block the uptake of lipoproteins by tissues (7). For indirect calorimetric measurement, male WT and VDR(−/−) mice were individually placed in the respiratory chambers of a LabMaster System (TSE Systems, Midland, MI). After they were acclimated to the chambers for 2–3 days, oxygen consumption, CO2 production, energy expenditure, food and water intake, and locomotive movement were recorded for the following 3 days. The animal studies were approved by the Institutional Animal Care and Use Committee at the University of Chicago.
Plasma parameters.
Total plasma cholesterol and triglyceride levels were determined using the Infinity cholesterol and triglyceride reagents from Thermo Scientific (Waltham, MA). Total free fatty acid levels were determined using a NEFA C test kit from Wako (Richmond, VA). Plasma calcium levels were determined using the Calcium Liquicolor Kit (Stanbio, Boerne, TX). Plasma leptin levels were measured using a commercial ELISA kit (Diagnostic Systems Lab, Webster, TX). Serum thyroid-stimulating hormone (TSH) was measured using a sensitive, heterologous, disequilibrium double-antibody precipitation RIA (38). Serum total thyroxine (T4) and triiodothyronine (T3) concentrations were measured by a solid-phase RIA (Coat-a-Count; Diagnostic Products, Los Angeles, CA) as described previously (1).
Histology.
WAT and BAT were fixed in 10% formalin (pH 7.4), processed, and paraffin embedded. Sections (5 μm) were cut with a Leica microtome 2030 and stained with hematoxylin and eosin.
BAT culture.
Brown fat pads were dissected immediately after mice were killed and placed in cold PBS (pH 7.4) kept on ice. The fat pads were rinsed with cold PBS, transferred to cold DMEM containing 2% FBS and 1 μg/ml insulin, and cut with sterile scissors into small pieces. The fat pieces were cultured in six-well plates at 37°C and 5% CO2 in the presence or absence of 10−8 M 1,25(OH)2D3, and total RNAs were extracted after 24 h. The RNAs were subject to Northern blot analyses with 32P-labeled cDNA probes of UCPs.
White adipocyte culture.
Primary white adipocytes were cultured as previously described (25). Briefly, epididymal fat pads were dissected immediately after mice were killed and placed in Krebs-Ringer buffer (3.5 ml/g wet wt) supplemented with 25 mM HEPES (pH 7.4), 4% FBS, 5 mM glucose, and 1 mg/ml type II collagenase (Sigma). Samples were minced and then shaken in a water bath at 37°C for 40 min. The adipocytes were then transferred to a conical tube and washed three times with the Krebs-Ringer buffer. The isolated primary adipocytes were cultured in 24-well plates in DMEM supplemented with 2% FBS and 1 μg/ml insulin.
Fatty acid β-oxidation assay.
Cultured primary adipocytes were incubated with 500 μM [3H]palmitate and 500 μM carnitine for 1 h. Cell lysates were precipitated two times with tricarboxylic acid and then neutralized with 6 N NaOH. The resulting solutions were applied to a DOWEX-1x2–400 Ion Exchange column and eluted with water into scintillation vials. The amount of tritiated water was measured with a scintillation counter.
Northern blot.
Total cellular RNA was extracted using TRIzol reagents (Invitrogen, Grand Island, NY). Northern blot analysis was carried out as described previously (29). Briefly, total RNAs (10–20 μg/lane) were separated on 1% agarose gels containing 0.6 M formaldehyde and transferred to Nylon membranes that were cross-linked in an ultraviolet cross-linker. Hybridization was carried out at 63°C in the hybridization buffer described by Church and Gilbert (9) with a cDNA probe labeled with [32P]dATP using the Prime-a-Gene Labeling System (Promega, Madison, WI). After being washed, the membranes were exposed to X-ray films at −80°C for autoradiography. Ethidium bromide-stained 18S RNA was used as an internal loading control.
RT-PCR.
First-strand cDNAs were synthesized from 2 μg of total RNAs in 20 μl reaction using Moloney murine reverse transcriptase reverse transcriptase (Invitrogen, Carlsbad, CA) and hexanucleotide random primers. The first-strand cDNAs served as the template for the PCR, which was carried out using a Bio-Rad DNA Engine. Glyceraldehyde-3-phosphate dehydrogenase served as the internal control.
Statistical analysis.
Data values were presented as means ± SE. Statistical comparisons were made using Student's t-test, with P < 0.05 being considered significant.
RESULTS
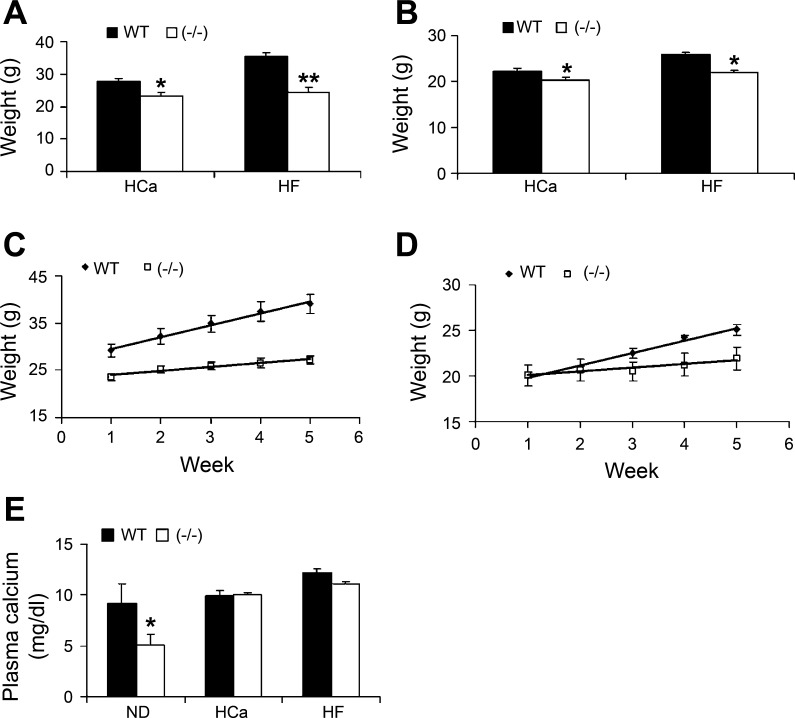
We used genetic mutant mice lacking the VDR as a model to investigate the role of VDR in energy metabolism. As shown in Fig. 1, both male (Fig. 1A) and female (Fig. 1B) VDR(−/−) mice weighed significantly less than the WT counterparts on the HCa diet. When the mice were fed the HF diet, the body weight difference between WT and VDR(−/−) mice dramatically increased (Fig. 1, A and B), as both male and female VDR(−/−) gained weight at a slower rate than WT mice (Fig. 1, C and D). The weight difference was bigger in male mice than in female mice on either diet. Because VDR(−/−) mice had lower body mass before HF feeding, their slower growth cannot be completely explained by the resistance to the HF diet. In contrast to hypocalcemia seen in VDR(−/−) mice on the regular rodent chow, the HCa diet normalized the plasma calcium levels in VDR(−/−) mice (Fig. 1E). During the 5-wk HF diet feeding period, the high-calcium water was able to maintain the plasma calcium level at the normal range in VDR(−/−) mice (Fig. 1E). Therefore, the difference in weight gain in WT and VDR(−/−) mice was unlikely because of a difference in plasma calcium.
Fig. 1.
Body weight and serum calcium levels. A and B: body weight of male (A) and female (B) wild-type (WT) and vitamin D receptor-deficient [VDR(−/−)] mice at 4 mo of age on the high-calcium (HCa) or on the high-fat (HF) diet for 5 wk. C and D: growth curve of male (C) and female (D) WT and VDR(−/−) mice on the HF diet. E: serum calcium levels of WT and VDR(−/−) mice on normal rodent chow (ND), HCa diet, or HF diet supplemented with high-calcium water. *P < 0.05 and **P < 0.005 vs. WT; n = 4–11 mice in each genotype.
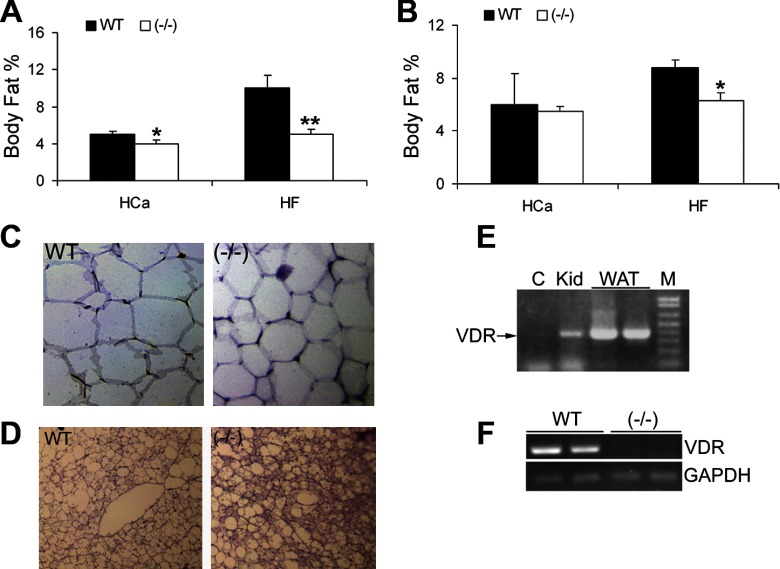
We then determined the effect of VDR inactivation on body fat depots. As shown in Fig. 2, VDR transcript was readily detected by RT-PCR in both WAT (Fig. 2E) and BAT (Fig. 2F) of WT animals but was absent from VDR(−/−) mice, indicating that the fat is the direct target organ of vitamin D. On the HCa diet, only male VDR(−/−) mice displayed significantly less body fat than WT mice. There was no difference in the body fat percentages of female mice (Fig. 2, A and B). On the HF diet, both male and female VDR(−/−) mice exhibited significantly lower body fat compared with WT mice (Fig. 2, A and B). Histological examination of the gonadal WAT showed that VDR(−/−) mice on the HF diet appeared to have smaller adipocytes compared with WT mice (Fig. 2C). Although VDR(−/−) mice had less BAT compared with WT mice regardless of the diets, the BAT in VDR(−/−) mice on HF diet accumulates less lipids and preserved much better cell morphology characteristic of brown fat than WT mice (Fig. 2D).
Fig. 2.
Body fat percentage and morphology of white adipose tissue (WAT) and brown adipose tissue (BAT). A and B: body fat percentage of male (A) and female (B) WT and VDR(−/−) mice on the HCa diet or HF diet. *P < 0.05 and **P < 0.005 vs. WT; n = 4–11 in each genotype. C and D: hematoxylin and eosin (H&E) staining of WAT (C) or BAT (D) from WT and VDR(−/−) mice on the HF diet. E and F: RT-PCR examination of vitamin D receptor (VDR) expression in WAT (E) and BAT (F). C, negative control; Kid, kidney; M, molecular weight marker.
We further determined the WAT depot distribution in the body as subcutaneous, gonadal, and perirenal fat and the BAT in these mice. As shown in Table 1, on the HCa diet, male VDR(−/−) mice tended to have less fat in each depot; however, only the gonadal fat was significantly lower compared with WT mice. Female VDR(−/−) mice on the HCa diet had significantly less BAT but did not display significant differences in WAT depots, consistent with the observation that female VDR(−/−) mice did not display significantly lower body fat. On the HF diet, VDR(−/−) mice displayed significantly less adipose tissue in all four depots regardless of genders, but the difference between male WT and VDR(−/−) mice was more dramatic than between female mice (Table 1). Therefore, unless specifically indicated, only male mice were used in the following investigations.
Table 1.
Body fat distribution in WT and VDR(−/−) mice on HCa or HF diet
| HCa Diet |
HF Diet | |||
|---|---|---|---|---|
| WT | VDR(−/−) | WT | VDR(−/−) | |
| Subcutaneous | ||||
| Male | 0.59±0.18 | 0.39±0.22 | 1.59±1.09 | 0.47±0.22* |
| Female | 0.52±0.12 | 0.45±0.18 | 1.13±0.49 | 0.56±0.16† |
| Gonadal | ||||
| Male | 0.68±0.13 | 0.36±0.16* | 1.68±0.91 | 0.53±0.31* |
| Female | 0.52±0.17 | 0.45±0.12 | 0.70±0.26 | 0.59±0.32 |
| Perirenal | ||||
| Male | 0.22±0.10 | 0.14±0.05 | 0.57±0.34 | 0.18±0.07* |
| Female | 0.29±0.10 | 0.22±0.06 | 0.43±0.15 | 0.27±0.14 |
| Brown fat | ||||
| Male | 0.20±0.07 | 0.16±0.37 | 0.44±0.16 | 0.21±0.05* |
| Female | 0.22±0.05 | 0.17±0.05† | 0.30±0.08 | 0.21±0.05† |
Values (g) are means ± SE; n = 4–11 mice in each genotype. HCa, high calcium; HF, high fat; WT, wild type; VDR(−/−), vitamin D receptor deficient.
P < 0.005 and
P < 0.05 vs. WT.
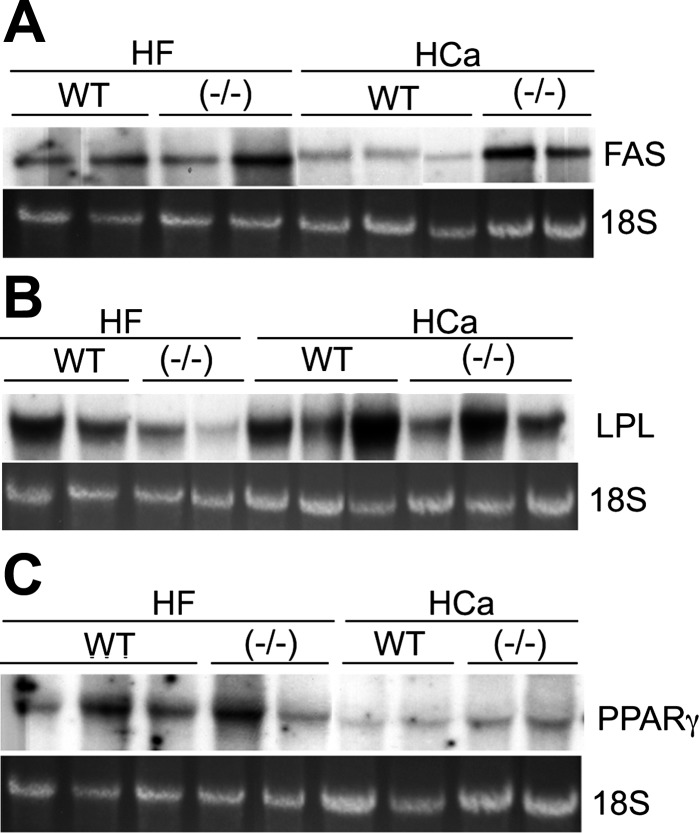
Fatty acid synthase (FAS), the rate-limiting enzyme involved in de novo fatty acid synthesis (4), was higher in VDR(−/−) mice than in WT mice on the HCa; however, the difference was decreased when the mice were placed on the HF diet (Fig. 3A). However, the expression of malonyl-CoA dehydrogenase and stearoyl CoA-desaturase-1, two other enzymes involved in fatty acid metabolism, was not significantly different between WT and VDR(−/−) mice (data not shown). LPL, which is responsible for the breakdown of circulating triglycerides (35), was similar in VDR(−/−) and WT mice on the HCa diet but lower in VDR(−/−) mice when placed on the HF diet (Fig. 3B). Peroxisome proliferator-activated receptor (PPAR)-γ, the gene responsible for the expression of a number of adipocytic genes, seemed to be expressed at slightly higher levels in VDR(−/−) mice on the HCa diet; however, the difference disappeared when the mice were placed on the HF diet (Fig. 3C).
Fig. 3.
Gene expression in WAT. Total RNAs were isolated from WAT of male WT and VDR(−/−) mice on the HCa diet or HF diet, and mRNA expression of the following genes was determined by Northern blot analyses: fatty acid synthase (FAS; A), lipoprotein lipase (LPL; B), peroxisome proliferator-activated receptor-γ (PPARγ; C). All experiments were repeated at least 2–3 times with similar results, and shown are representative data.
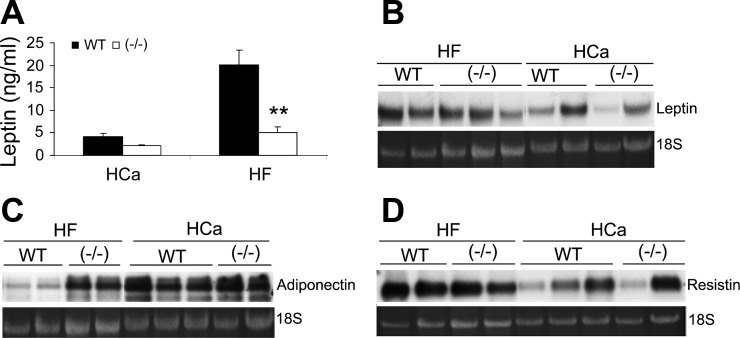
We also assessed the levels of adipokines. On the HCa diet, circulating leptin levels in VDR(−/−) mice tended to be lower than in WT mice, but the difference was not statistically significant; however, on the HF diet, the increase in plasma leptin levels was much less in VDR(−/−) mice compared with WT mice (Fig. 4A). This is consistent with the notion that plasma leptin levels reflect the fat mass in the body (32). Indeed, leptin mRNA expression in WAT was lower in VDR(−/−) mice on both diets (Fig. 4B). However, the decrease in leptin levels was not enough to influence the food intake in VDR(−/−) mice (Fig. 5C). Adiponectin is an anti-hyperglycemic adipokine whose levels are inversely correlated to body weight (2). On the HCa diet, adiponectin mRNA expression in the WAT was indistinguishable in WT and VDR(−/−) mice; the HF diet reduced adiponectin expression in WT mice but not in VDR(−/−) mice (Fig. 4C). There was no detectable difference in resistin expression between WT and VDR(−/−) mice on the HCa diet or HF diet, even though resistin levels were increased in response to high-fat feeding in both mice (Fig. 4D).
Fig. 4.
Levels of adipokines from WAT. A: plasma leptin levels in WT and VDR(−/−) mice on the HCa diet or HF diet. **P < 0.005 vs. WT; n = 6–9 in each genotype. B–D: Northern blot analyses of leptin mRNA (B), adiponectin mRNA (C), and resistin mRNA (D) expression in WAT from male WT and VDR(−/−) mice on the HCa diet or HF diet as indicated. All experiments were repeated at least 2–3 times with similar results, and shown are representative data.
Fig. 5.
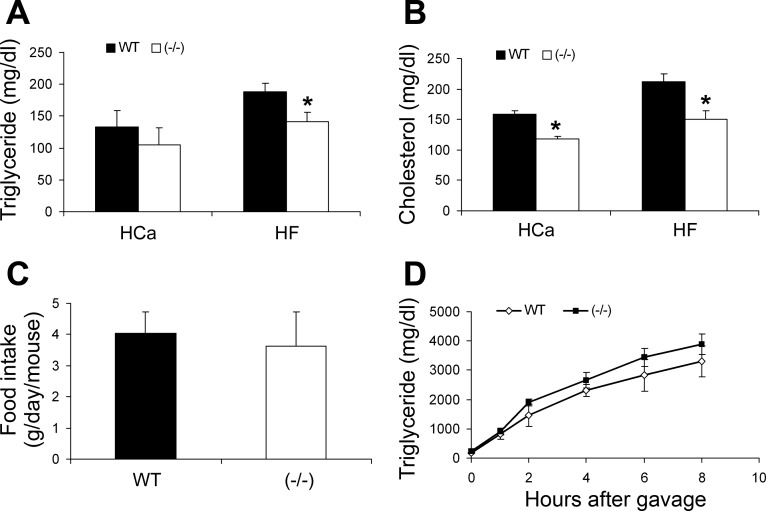
Plasma lipid levels and intestinal lipid absorption. A and B: concentration of total plasma triglyceride (TG, A) and cholesterol (B) in male WT and VDR(−/−) mice on the HCa diet or HF diet. C: food intake of male WT and VDR(−/−) mice. D: intestinal lipid absorption. Male WT and VDR(−/−) mice (n = 4–6) were gavaged with olive oil, and triglyceride accumulation in the plasma was determined with time. *P < 0.05 vs. WT; n = 6–11 in each genotype.
The difference observed in the fat depots between WT and VDR(−/−) mice prompted us to measure the plasma lipid levels. There was no significant difference in circulating triglyceride, free fatty acids, or cholesterol between female WT and VDR(−/−) mice fed either the HCa or HF diet (data not shown). There was also no significant difference in free fatty acid levels in male mice on either of the diets (data not shown). Male VDR(−/−) mice tended to have lower triglyceride levels on the HCa diet, but the difference was not significant (Fig. 5A); on the HF diet, however, the triglyceride levels were significantly lower in male VDR(−/−) mice compared with the WT counterparts (Fig. 5A). Interestingly, plasma cholesterol levels in male VDR(−/−) mice were significantly lower than in WT mice on both diets (Fig. 5B). Based on these observations, we focused on male mice in the following investigations into the mechanism underlying the phenotypic differences in WT and VDR(−/−) mice.
Because the plasma lipid levels of the VDR(−/−) mice were decreased compared with WT mice, we monitored mouse food intake. The VDR(−/−) mice ate the same amount of food as WT mice (Fig. 5C), so we investigated whether difference in intestinal lipid absorption accounted for the difference in their plasma lipid levels. To this end, fasted mice were subject to a gavage of olive oil, and blood triglyceride levels were measured at different time points afterward. Surprisingly, no difference in the rate of intestinal triglyceride absorption was seen between WT and VDR(−/−) mice (Fig. 5D).
The lower body fat mass and plasma lipid profile in VDR(−/−) mice suggested an increase in the basal body metabolism. Thyroid hormone is known to stimulate metabolism (11, 37), and we therefore determined TSH, T3, and T4 levels in the plasma. VDR(−/−) mice did not have increased circulating thyroid hormones compared with WT mice (data no shown). Therefore, the phenotypic difference in VDR(−/−) and WT mice was unlikely caused by thyroid hormone.
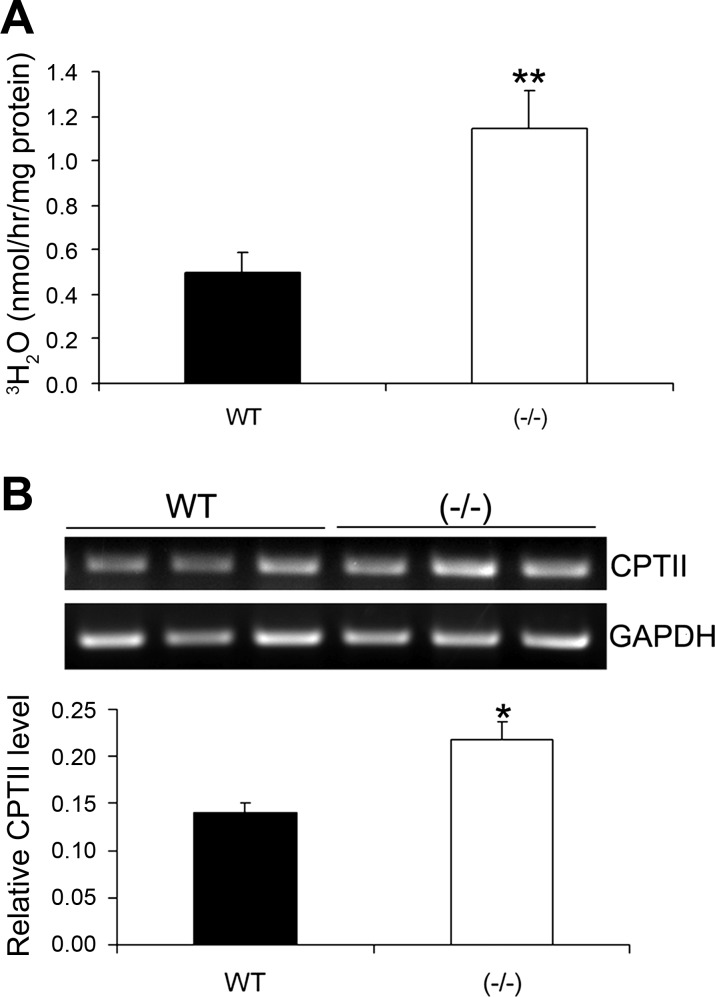
To explore the mechanism underlying the difference in plasma lipid profile, we measured fatty acid β-oxidation in primary white adipocytes isolated from WT and VDR(−/−) mice. As shown in Fig. 6, in the presence of carnitine, β-oxidation occurred at a higher rate in the white adipocytes of VDR(−/−) mice compared with WT mice (Fig. 6A). Examination of key genes involved in β-oxidation revealed that carnitine palmitoyltransferase II (CPTII), the protein responsible for transporting fatty acids into the mitochondrial matrix, was increased in VDR(−/−) mice (Fig. 6B). The increased rate of β-oxidation in adipocytes may partially explain the decreased level of circulating lipids in VDR(−/−) mice.
Fig. 6.
Fatty acid β-oxidation in WAT. A: rate of β-oxidation in white adipocytes isolated from male WT and VDR(−/−) mice. β-Oxidation was measured by monitoring the production of 3H2O after treatment with tritiated palmitate. B: RT-PCR analysis of carnitine palmitoyltransferase (CPT) II mRNA levels in WAT from WT and VDR(−/−) mice. *P < 0.05 and **P < 0.005 vs. WT; n = 5–6 in each genotype.
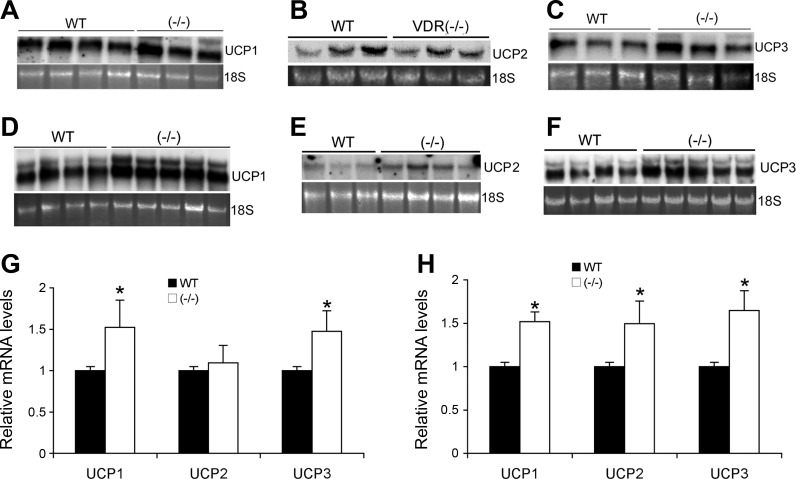
The brown fat plays a key role in thermoregulation and metabolism in mice. BAT expresses three UCPs. UCP1 is involved in the regulation of nonshivering thermogenesis (14). Although the roles of UCP2 and UCP3 are less well understood, both exhibit uncoupling abilities when expressed in yeast (15, 17). Interestingly, the expression of the UCPs in the BAT of VDR(−/−) mice was markedly upregulated. On the HCa diet, UCP1 and UCP3 were expressed at a higher level in VDR(−/−) mice compared with WT mice (Fig. 7, A, C, and G), whereas UCP2 levels were similar in these mice (Fig. 7, B and G); when the mice were placed on the HF diet, the expression of UCP1, UCP2, and UCP3 was increased much more in VDR(−/−) mice than in WT mice (Fig. 7, D–F and H). These results indicate that energy uncoupling is taking place at a higher rate in the BAT of VDR(−/−) mice, suggesting a higher basal energy expenditure. These results explain, at least in part, the lower adipose mass and lower plasma lipid profile in the mutant mice.
Fig. 7.
Expression of uncoupling protein (UCP) in BAT. A–C: total RNAs were isolated from BAT in male WT and VDR(−/−) mice fed the HCa diet, and UCP1 (A), UCP2 (B), and UCP3 (C) mRNA were determined by Northern blotting. D–F: BAT total RNAs were isolated form WT and VDR(−/−) mice on the HF diet, and UCP1 (D), UCP2 (E), and UCP3 (F) expression was determined by Northern blotting. G and H: PhosphorImaging quantitative data of the UCP mRNA levels from WT and VDR(−/−) mice on the HCa (G) or HF (H) diet. *P < 0.01 vs. WT.
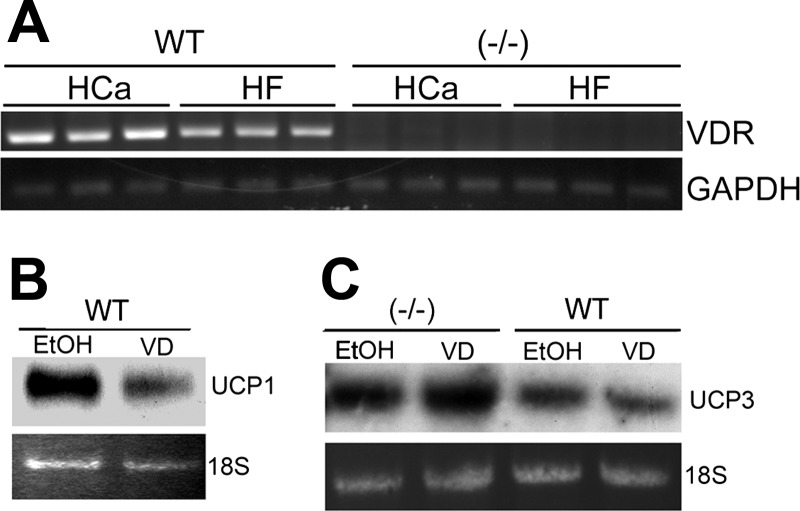
UCPs are known to be under the direct regulation of β-adrenergic receptor 3 (Adrβ3) (17, 39). Adrβ3 expression was unchanged in the BAT of VDR(−/−) mice compared with WT mice, suggesting that it is not involved in VDR regulation of UCP expression (data not shown). Interestingly, VDR levels in the BAT were decreased in WT mice on the HF diet (Fig. 8A), in reverse correlation with the UCP expression, and consistent with the notion that vitamin D directly downregulates UCP expression in BAT. To test this hypothesis, primary BAT was isolated from WT and VDR(−/−) mice and treated with 1,25(OH)2D3. As shown in Fig. 8, the expression of UCP1 and UCP3 was markedly decreased in WT BAT cells after 24 h of treatment (Fig. 8, B and C); however, as expected, 1,25(OH)2D3 had no effect on the cells from VDR(−/−) mice (Fig. 8C), indicating that the regulation is mediated by VDR. Therefore 1,25(OH)2D3 appears to directly downregulate UCP1 and UCP3 expression in BAT; as a result, inactivation of VDR leads to the increased expression of these genes in VDR(−/−) mice, leading to changes in energy metabolism.
Fig. 8.
Suppression of UCP expression in primary brown fat tissues by 1α,25-dihydroxyvitamin D3 [1,25(OH)2D3]. A: RT-PCR determination of VDR expression in the BAT from WT and VDR(−/−) mice fed the HCa diet or the HF diet as indicated. B and C: primary BAT isolated from WT or VDR(−/−) mice were treated for 24 h with 1,25(OH)2D3 (10−8 M, VD), and UCP1 (B) and UCP3 (C) expression was analyzed by Northern blotting. All experiments were repeated at least 2–3 times with similar results, and shown are representative data.
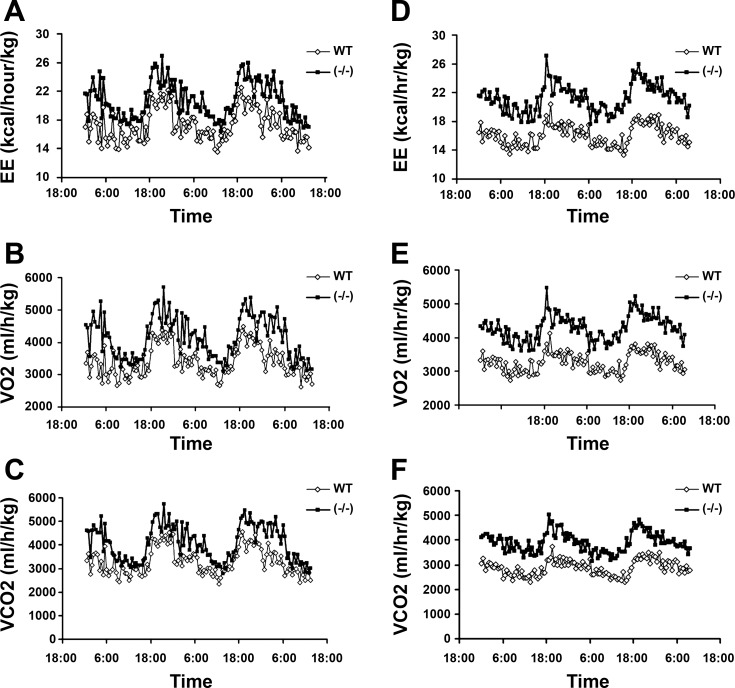
Finally, we further assessed the role of VDR in energy metabolism by indirectly measuring calorimetric parameters of WT and VDR(−/−) mice. As shown in Fig. 9, total energy expenditure was markedly higher in VDR(−/−) mice than WT mice in either daytime and nighttime under the HCa diet condition (Fig. 9A); consistently, the oxygen consumption (Fig. 9B) and CO2 production (Fig. 9C) of VDR(−/−) mice were also higher than WT mice. When the mice were placed on the HF diet, the difference in energy expenditure (Fig. 9D), oxygen consumption (Fig. 9E), and CO2 production (Fig. 9F) was even larger between WT and VDR(−/−) mice, with VDR(−/−) mice being much higher in all of these parameters. However, there was no significant difference in locomotive movement (data not shown) and in food intake between WT and VDR(−/−) mice. These data confirm that VDR(−/−) mice have increased energy metabolism, and the higher energy expenditure is not attributable to increased food intake or physical movement.
Fig. 9.
Calorimetric parameters. Male WT and VDR(−/−) mice fed the HCa diet (A–C) or the HF diet (E–F) were individually placed in the metabolic cages and acclimated to the chambers for 2–3 days before the 3-day measurement. A and D: energy expenditure (EE); B and E: oxygen consumption; and C and F: carbon dioxide production, under the HCa or the HF dietary condition, respectively; n = 5–6 for each genotype.
DISCUSSION
1,25(OH)2D3 is a pluripotent hormone involved in the regulation of a variety of biological processes. Beyond its traditional actions in the regulation of calcium homeostasis, great progress has been made in recent years to understand the role of vitamin D in renal and cardiovascular functions, in immune regulation, and in cancer prevention (23). However, little is known about its role in energy metabolism and adipocyte biology in vivo. Adipocytes express VDR and thus are potential targets of vitamin D regulation. In the present study, we investigated the effect of VDR deficiency on energy metabolism by characterizing the metabolic phenotype of VDR-null mutant mice. The data demonstrate that vitamin D is involved in energy metabolism in animals at least in part through regulation of the UCPs.
Because of the function of vitamin D in regulation of calcium homeostasis, VDR(−/−) mice develop hypocalcemia on regular rodent chow (30). To avoid the interference of the calcemic abnormality, in this study, we maintained the normocalcemic status of VDR(−/−) mice with the HCa diet or high-calcium water when treated with the HF diet. This ensured that the metabolic phenotypes seen in VDR(−/−) mice were a direct result of VDR inactivation rather than secondary to abnormal calcium metabolism. The main finding of this study is that VDR(−/−) mice have less body fat mass and lower plasma levels of triglyceride and cholesterol than the WT counterparts. The phenotypic difference was widened between WT and VDR(−/−) mice when the mice were placed on the HF diet, as VDR(−/−) mice gained less weight and accumulated less fat mass than WT mice, even though the food intake and intestinal lipid absorption were the same as WT mice. Therefore, the phenotypic difference in these two genotypes is unlikely caused by the difference in energy intake, but rather by the difference in energy expenditure, which is markedly higher in VDR(−/−) mice (Fig. 9).
Studies of 3T3-L1 proadipocytes have previously shown that 1,25(OH)2D3 blocks adipocyte differentiation in vitro (6, 26), which predict an increase in adipogenesis in the absence of VDR. Therefore, it is somewhat surprising that mice lacking VDR actually have less fat mass. The discrepancy between in vitro and in vivo observations is unclear, but it is possible that, because VDR expression follows a specific temporal pattern during adipocyte differentiation (6, 26), the global VDR inactivation starting from the embryonic stages in VDR(−/−) mice may not recapitulate the blockade of vitamin D signaling seen in the in vitro 3T3-L1 adipogenesis. Because fat mass was reduced in all depots in VDR(−/−) mice, the defect in fat accumulation appears to be global. The decrease in adiposity can be attributed to a lower number of adipocytes, smaller size of adipocytes, or both. Whereas it is unclear whether there is a defect in adipogenesis in VDR(−/−) mice, the adipocytes in VDR(−/−) mice appeared to be smaller under the HF dietary stress, suggesting that VDR(−/−) mice stored less lipids in the fat tissues than WT mice. This is consistent with the fact that VDR(−/−) mice had lower plasma triglyceride and cholesterol concentration on both diets.
The low plasma lipid levels and adiposity seen in VDR(−/−) mice could be a consequence of reduced energy intake or increased energy expenditure. The observations that VDR(−/−) mice consumed as much food as WT mice and had normal lipid absorption in the intestine basically excluded the possibility of decreased energy intake as the underlying mechanism. However, evidence obtained from WAT and BAT studies and indirect calorimetric measurement demonstrates an increase in energy expenditure in VDR(−/−) mice.
In WAT, despite the reduction in fat mass, the expression of most genes and adipokines surveyed in the study was normal in VDR(−/−) mice. The expression of PPARγ, the master regulator of adipocyte differentiation, was not significantly different in WT and VDR(−/−) mice. On the HCa diet, VDR(−/−) mice displayed a slight increase in FAS expression, probably a compensatory effect secondary to the depressed plasma lipid levels. LPL is an enzyme that hydrolyzes triglyceride-rich lipoproteins (35), and the decreased LPL expression seen in VDR(−/−) mice on the HF diet may also reflect the depressed plasma lipid levels.
Adipokines that play a role in energy metabolism include leptin, resistin, and adiponectin. Leptin is the major energy sensor in the body, and leptin levels are known to be proportional to the fat mass (32). The fact that VDR(−/−) mice exhibited a decreased level of circulating leptin reflects their low fat mass; thus, it is not surprising that the drastic differences in circulating leptin were not seen in leptin mRNA levels. Adiponectin has been implicated in increasing β-oxidation and decreasing circulating triglyceride levels (16, 44), and a high-fat dietary treatment is known to suppress adiponectin expression (5). Consistently, in WT mice, adiponectin expression was suppressed on the HF diet; however, VDR(−/−) mice still maintained the high-level adiponectin expression on this diet, which is consistent with the apparently higher β-oxidation in WAT of the mutant mice.
Fatty acid β-oxidation is a process taking place in mitochondria by which fatty acids are broken down to produce ATP (13, 31). Within white adipocytes, triglycerides are constantly converted into fatty acids and back into triglyceride in a futile cycle. In a fasted state, fatty acids are released by adipocytes to provide energy (42). In VDR(−/−) mice, the basal β-oxidation in WAT is significant higher, accompanied with increased mRNA expression of CPTII. These data suggest that, in the WAT of VDR(−/−) mice, instead of being converted back to triglyceride, a larger portion of the fatty acids derived from stored triglycerides is oxidized, leading to higher basal energy expenditure.
The more important finding that points to higher energy expenditure in VDR(−/−) mice is the elevated UCP expression and the metabolic data from indirect calorimetric measurement. UCP1 and UCP3 were markedly upregulated in the BAT of VDR(−/−) mice regardless of dietary conditions, and UCP2 was upregulated in VDR(−/−) placed on a HF diet. BAT is a main site of metabolic regulation in mice, and on the HF diet VDR(−/−) mice preserved the BAT morphology better than WT mice. UCPs are expressed in the mitochondria and serve to uncouple the electron transport chain from the production of ATP. UCP1 is expressed only in the BAT and is mainly responsible for adaptive thermogenesis (14). Overexpression of UCP1 in WAT caused a reduction in adipose stores in transgenic mice (27). The physiological roles of UCP2 and UCP3 remain unclear. UCP2 is widely expressed in the BAT, WAT, heart, and kidney (15). A positive association has been reported between UCP2, energy expenditure, and resting metabolic rate based in humans (8, 43); on the other hand, however, there is no significant weight difference between UCP2-null and WT mice on a normal or HF diet (3). UCP3 expression is restricted to skeletal muscle and brown fat and is thought to influence metabolic rate, since transgenic mice overexpressing UCP3 are resistant to diet-induced obesity (10). Increased UCP3 expression has also been linked to sleeping metabolic rates and increased energy expenditure in Pima Indians (40), providing evidence that the increased expression of UCP3 in the VDR(−/−) mice may contribute to their increased metabolic rate. However, UCP3 knockout mice displayed no change in weight or oxygen consumption compared with WT mice (18). Interestingly, both UCP2 and UCP3 are upregulated in the UCP1 knockout mice, suggesting compensatory roles of these proteins in the regulation of energy homeostasis (33). Because UCPs uncouple the production of ATP from the electron transport chain, VDR(−/−) mice would have to use more energy than WT mice to produce the same amount of ATP. This at least partly explains the low fat mass phenotype seen in VDR(−/−) mice and the accompanied high energy expenditure. Vitamin D regulation of UCPs was not via Adrβ3, and the thyroid hormone was not involved in the development of the phenotypes either. The experiment using primary brown fat culture confirmed that 1,25(OH)2D3 suppresses UCP expressions through direct gene regulation and that basal UCP expression is upregulated in the brown fat of VDR (−/−) mice. Consistently, a prior study has reported suppression of UCP2 by 1,25(OH)2D3 in human adipose tissues (41). Furthermore, we showed here that BAT VDR levels were decreased in WT mice on the HF diet, providing further evidence that the VDR is involved in UCP downregulation.
VDR(−/−) mice have higher energy expenditure compared with WT mice on either the HCa or the HF diet. The high energy expenditure explains, at least in part, the low adiposity and low plasma lipid profiles in VDR(−/−) mice. However, because VDR is ubiquitously expressed, the higher energy expenditure does not necessarily only result from the loss of VDR in the adipose tissues. Global VDR deficiency, which is the model used in this study, may likely alter body adiposity and energy expenditure in a number of ways. Future studies should be directed at the role of VDR in adipose and nonadipose tissues in the regulation of total body energy metabolism.
In summary, this study demonstrates that the VDR-mediated action of vitamin D is involved in energy metabolism and adipocyte biology in vivo. In the absence of VDR, animals display low fat mass, resistance to high-fat-induced fat accumulation, and reduced plasma lipid levels, due to increased energy expenditure. The underlying mechanism for these metabolic abnormalities is that vitamin D is involved in the regulation of β-oxidation in WAT and directly suppresses the expression of UCP1 and UCP3 in BAT. These data unveil a novel aspect of vitamin D biology in regulation of energy metabolism.
GRANTS
This work was supported in part by National Institutes of Health Grants T32 DK-07074, DK-20595, and R01 HL-085793.
Acknowledgments
We thank XiaoHua Liao for performing the thyroid hormone assays.
The costs of publication of this article were defrayed in part by the payment of page charges. The article must therefore be hereby marked “advertisement” in accordance with 18 U.S.C. Section 1734 solely to indicate this fact.
REFERENCES
- 1.Alonso M, Goodwin C, Liao X, Page D, Refetoff S, Weiss RE. Effects of maternal levels of thyroid hormone (TH) on the hypothalamus-pituitary-thyroid set point: studies in TH receptor beta knockout mice. Endocrinology 148: 5305–5312, 2007. [DOI] [PubMed] [Google Scholar]
- 2.Arita Y, Kihara S, Ouchi N, Takahashi M, Maeda K, Miyagawa J, Hotta K, Shimomura I, Nakamura T, Miyaoka K, Kuriyama H, Nishida M, Yamashita S, Okubo K, Matsubara K, Muraguchi M, Ohmoto Y, Funahashi T, Matsuzawa Y. Paradoxical decrease of an adipose-specific protein, adiponectin, in obesity. Biochem Biophys Res Commun 257: 79–83, 1999. [DOI] [PubMed] [Google Scholar]
- 3.Arsenijevic D, Onuma H, Pecqueur C, Raimbault S, Manning BS, Miroux B, Couplan E, Alves-Guerra MC, Goubern M, Surwit R, Bouillaud F, Richard D, Collins S, Ricquier D. Disruption of the uncoupling protein-2 gene in mice reveals a role in immunity and reactive oxygen species production. Nat Genet 26: 435–439, 2000. [DOI] [PubMed] [Google Scholar]
- 4.Asturias FJ, Chadick JZ, Cheung IK, Stark H, Witkowski A, Joshi AK, Smith S. Structure and molecular organization of mammalian fatty acid synthase. Nat Struct Mol Biol 12: 225–232, 2005. [DOI] [PubMed] [Google Scholar]
- 5.Barnea M, Shamay A, Stark AH, Madar Z. A high-fat diet has a tissue-specific effect on adiponectin and related enzyme expression. Obesity (Silver Spring) 14: 2145–2153, 2006. [DOI] [PubMed] [Google Scholar]
- 6.Blumberg JM, Tzameli I, Astapova I, Lam FS, Flier JS, Hollenberg AN. Complex role of the vitamin D receptor and its ligand in adipogenesis in 3T3-L1 cells. J Biol Chem 281: 11205–11213, 2006. [DOI] [PubMed] [Google Scholar]
- 7.Borensztajn J, Rone MS, Kotlar TJ. The inhibition in vivo of lipoprotein lipase (clearing-factor lipase) activity by triton WR-1339. Biochem J 156: 539–543, 1976. [DOI] [PMC free article] [PubMed] [Google Scholar]
- 8.Bouchard C, Perusse L, Chagnon YC, Warden C, Ricquier D. Linkage between markers in the vicinity of the uncoupling protein 2 gene and resting metabolic rate in humans. Hum Mol Genet 6: 1887–1889, 1997. [DOI] [PubMed] [Google Scholar]
- 9.Church G, Gilbert W. Genomic Sequencing. Proc Natl Acad Sci USA 81: 1991–1995, 1984. [DOI] [PMC free article] [PubMed] [Google Scholar]
- 10.Clapham JC, Arch JR, Chapman H, Haynes A, Lister C, Moore GB, Piercy V, Carter SA, Lehner I, Smith SA, Beeley LJ, Godden RJ, Herrity N, Skehel M, Changani KK, Hockings PD, Reid DG, Squires SM, Hatcher J, Trail B, Latcham J, Rastan S, Harper AJ, Cadenas S, Buckingham JA, Brand MD, Abuin A. Mice overexpressing human uncoupling protein-3 in skeletal muscle are hyperphagic and lean. Nature 406: 415–418, 2000. [DOI] [PubMed] [Google Scholar]
- 11.Danforth E Jr, Burger A. The role of thyroid hormones in the control of energy expenditure. Clin Endocrinol Metab 13: 581–595, 1984. [DOI] [PubMed] [Google Scholar]
- 12.Dusso A, Brown A, Slatopolsky E. Vitamin D. Am J Physiol Renal Physiol 289: F8–F28, 2005. [DOI] [PubMed] [Google Scholar]
- 13.Eaton S Control of mitochondrial beta-oxidation flux. Prog Lipid Res 41: 197–239, 2002. [DOI] [PubMed] [Google Scholar]
- 14.Enerback S, Jacobsson A, Simpson EM, Guerra C, Yamashita H, Harper ME, Kozak LP. Mice lacking mitochondrial uncoupling protein are cold-sensitive but not obese. Nature 387: 90–94, 1997. [DOI] [PubMed] [Google Scholar]
- 15.Fleury C, Neverova M, Collins S, Raimbault S, Champigny O, Levi-Meyrueis C, Bouillaud F, Seldin MF, Surwit RS, Ricquier D, Warden CH. Uncoupling protein-2: a novel gene linked to obesity and hyperinsulinemia. Nat Genet 15: 269–272, 1997. [DOI] [PubMed] [Google Scholar]
- 16.Fruebis J, Tsao TS, Javorschi S, Ebbets-Reed D, Erickson MR, Yen FT, Bihain BE, Lodish HF. Proteolytic cleavage product of 30-kDa adipocyte complement-related protein increases fatty acid oxidation in muscle and causes weight loss in mice. Proc Natl Acad Sci USA 98: 2005–2010, 2001. [DOI] [PMC free article] [PubMed] [Google Scholar]
- 17.Gong DW, He Y, Karas M, Reitman M. Uncoupling protein-3 is a mediator of thermogenesis regulated by thyroid hormone, beta3-adrenergic agonists, and leptin. J Biol Chem 272: 24129–24132, 1997. [DOI] [PubMed] [Google Scholar]
- 18.Gong DW, Monemdjou S, Gavrilova O, Leon LR, Marcus-Samuels B, Chou CJ, Everett C, Kozak LP, Li C, Deng C, Harper ME, Reitman ML. Lack of obesity and normal response to fasting and thyroid hormone in mice lacking uncoupling protein-3. J Biol Chem 275: 16251–16257, 2000. [DOI] [PubMed] [Google Scholar]
- 19.Greenberg AS, Obin MS. Obesity and the role of adipose tissue in inflammation and metabolism. Am J Clin Nutr 83: 461S–465S, 2006. [DOI] [PubMed] [Google Scholar]
- 20.Guerre-Millo M Adipose tissue and adipokines: for better or worse. Diabetes Metab 30: 13–19, 2004. [DOI] [PubMed] [Google Scholar]
- 21.Haslam DW, James WP. Obesity. Lancet 366: 1197–1209, 2005. [DOI] [PubMed] [Google Scholar]
- 22.Haussler MR, Whitfield GK, Haussler CA, Hsieh JC, Thompson PD, Selznick SH, Dominguez CE, Jurutka PW. The nuclear vitamin D receptor: biological and molecular regulatory properties revealed. J Bone Miner Res 13: 325–349, 1998. [DOI] [PubMed] [Google Scholar]
- 23.Holick CN, Stanford JL, Kwon EM, Ostrander EA, Nejentsev S, Peters U. Comprehensive association analysis of the vitamin D pathway genes, VDR, CYP27B1, and CYP24A1, in prostate cancer. Cancer Epidemiol Biomarkers Prev 16: 1990–1999, 2007. [DOI] [PubMed] [Google Scholar]
- 24.Jones G, Strugnell S, DeLuca H. Current understanding of the molecular actions of vitamin D. Physiol rev 78: 1193–1231, 1998. [DOI] [PubMed] [Google Scholar]
- 25.Jurczak MJ, Danos AM, Rehrmann VR, Allison MB, Greenberg CC, Brady MJ. Transgenic overexpression of protein targeting to glycogen markedly increases adipocytic glycogen storage in mice. Am J Physiol Endocrinol Metab 292: E952–E963, 2007. [DOI] [PubMed] [Google Scholar]
- 26.Kong J, Li YC. Molecular mechanism of 1,25-dihydroxyvitamin D3 inhibition of adipogenesis in 3T3-L1 cells. Am J Physiol Endocrinol Metab 290: E916–E924, 2006. [DOI] [PubMed] [Google Scholar]
- 27.Kopecky J, Clarke G, Enerback S, Spiegelman B, Kozak LP. Expression of the mitochondrial uncoupling protein gene from the aP2 gene promoter prevents genetic obesity. J Clin Invest 96: 2914–2923, 1995. [DOI] [PMC free article] [PubMed] [Google Scholar]
- 28.Li YC, Amling M, Pirro AE, Priemel M, Meuse J, Baron R, Delling G, Demay MB. Normalization of mineral ion homeostasis by dietary means prevents hyperparathyroidism, rickets, and osteomalacia, but not alopecia in vitamin D receptor-ablated mice. Endocrinology 139: 4391–4396, 1998. [DOI] [PubMed] [Google Scholar]
- 29.Li YC, Bolt MJ, Cao LP, Sitrin MD. Effects of vitamin D receptor inactivation on the expression of calbindins and calcium metabolism. Am J Physiol Endocrinol Metab 281: E558–E564, 2001. [DOI] [PubMed] [Google Scholar]
- 30.Li YC, Pirro AE, Amling M, Delling G, Baron R, Bronson R, Demay MB. Targeted ablation of the vitamin D receptor: an animal model of vitamin D-dependent rickets type II with alopecia. Proc Natl Acad Sci USA 94: 9831–9835, 1997. [DOI] [PMC free article] [PubMed] [Google Scholar]
- 31.Maassen JA, Romijn JA, Heine RJ. Fatty acid-induced mitochondrial uncoupling in adipocytes as a key protective factor against insulin resistance and beta cell dysfunction: a new concept in the pathogenesis of obesity-associated type 2 diabetes mellitus. Diabetologia 50: 2036–2041, 2007. [DOI] [PMC free article] [PubMed] [Google Scholar]
- 32.Maffei M, Halaas J, Ravussin E, Pratley RE, Lee GH, Zhang Y, Fei H, Kim S, Lallone R, Ranganathan S, Kem PA, Friedman JM. Leptin levels in human and rodent: measurement of plasma leptin and ob RNA in obese and weight-reduced subjects. Nat Med 1: 1155–1161, 1995. [DOI] [PubMed] [Google Scholar]
- 33.Matthias A, Jacobsson A, Cannon B, Nedergaard J. The bioenergetics of brown fat mitochondria from UCP1-ablated mice. Ucp1 is not involved in fatty acid-induced de-energization (“uncoupling”). J Biol Chem 274: 28150–28160, 1999. [DOI] [PubMed] [Google Scholar]
- 34.Matthias A, Ohlson KB, Fredriksson JM, Jacobsson A, Nedergaard J, Cannon B. Thermogenic responses in brown fat cells are fully UCP1-dependent. UCP2 or UCP3 do not substitute for UCP1 in adrenergically or fatty scid-induced thermogenesis. J Biol Chem 275: 25073–25081, 2000. [DOI] [PubMed] [Google Scholar]
- 35.Merkel M, Heeren J, Dudeck W, Rinninger F, Radner H, Breslow JL, Goldberg IJ, Zechner R, Greten H. Inactive lipoprotein lipase (LPL) alone increases selective cholesterol ester uptake in vivo, whereas in the presence of active LPL it also increases triglyceride hydrolysis and whole particle lipoprotein uptake. J Biol Chem 277: 7405–7411, 2002. [DOI] [PubMed] [Google Scholar]
- 36.Nagpal S, Na S, Rathnachalam R. Noncalcemic actions of vitamin D receptor ligands. Endocr Rev 26: 662–687, 2005. [DOI] [PubMed] [Google Scholar]
- 37.Oppenheimer JH, Schwartz HL, Mariash CN, Kinlaw WB, Wong NC, Freake HC. Advances in our understanding of thyroid hormone action at the cellular level. Endocr Rev 8: 288–308, 1987. [DOI] [PubMed] [Google Scholar]
- 38.Pohlenz J, Maqueem A, Cua K, Weiss RE, Van Sande J, Refetoff S. Improved radioimmunoassay for measurement of mouse thyrotropin in serum: strain differences in thyrotropin concentration and thyrotroph sensitivity to thyroid hormone. Thyroid 9: 1265–1271, 1999. [DOI] [PubMed] [Google Scholar]
- 39.Rohlfs EM, Daniel KW, Premont RT, Kozak LP, Collins S. Regulation of the uncoupling protein gene (Ucp) by beta 1, beta 2, and beta 3-adrenergic receptor subtypes in immortalized brown adipose cell lines. J Biol Chem 270: 10723–10732, 1995. [DOI] [PubMed] [Google Scholar]
- 40.Schrauwen P, Xia J, Bogardus C, Pratley RE, Ravussin E. Skeletal muscle uncoupling protein 3 expression is a determinant of energy expenditure in Pima Indians. Diabetes 48: 146–149, 1999. [DOI] [PubMed] [Google Scholar]
- 41.Shi H, Norman AW, Okamura WH, Sen A, Zemel MB. 1alpha,25-dihydroxyvitamin D3 inhibits uncoupling protein 2 expression in human adipocytes. Faseb J 16: 1808–1810, 2002. [DOI] [PubMed] [Google Scholar]
- 42.Vaughan M The production and release of glycerol by adipose tissue incubated in vitro. J Biol Chem 237: 3354–3358, 1962. [PubMed] [Google Scholar]
- 43.Walder K, Norman RA, Hanson RL, Schrauwen P, Neverova M, Jenkinson CP, Easlick J, Warden CH, Pecqueur C, Raimbault S, Ricquier D, Silver MH, Shuldiner AR, Solanes G, Lowell BB, Chung WK, Leibel RL, Pratley R, Ravussin E. Association between uncoupling protein polymorphisms (UCP2-UCP3) and energy metabolism/obesity in Pima indians. Hum Mol Genet 7: 1431–1435, 1998. [DOI] [PubMed] [Google Scholar]
- 44.Yamauchi T, Kamon J, Waki H, Terauchi Y, Kubota N, Hara K, Mori Y, Ide T, Murakami K, Tsuboyama-Kasaoka N, Ezaki O, Akanuma Y, Gavrilova O, Vinson C, Reitman ML, Kagechika H, Shudo K, Yoda M, Nakano Y, Tobe K, Nagai R, Kimura S, Tomita M, Froguel P, Kadowaki T. The fat-derived hormone adiponectin reverses insulin resistance associated with both lipoatrophy and obesity. Nat Med 7: 941–946, 2001. [DOI] [PubMed] [Google Scholar]


