Abstract
Present studies determined the roles of the cyclooxygenase (COX) versus the lipoxygenase (LO) pathways in the metabolic pathway of arachidonic acid (AA) in the internal anal sphincter (IAS) tone. Studies were performed in the rat IAS versus the nontonic rectal smooth muscle (RSM). Indomethacin, the dual COX inhibitor, but not nordihydroguaiaretic acid (NDGA), the LO inhibitor, produced a precipitous decrease in the IAS tone. However, when added in the background of indomethacin, NDGA caused significant reversal of the IAS tone. These inhibitors had no significant effect on the RSM. To follow the significance of COX versus LO pathways, we examined the effects of AA and its metabolites. In the IAS, AA caused an increase in the IAS tone (Emax = 38.8 ± 3.0% and pEC50 = 3.4 ± 0.1). In the RSM, AA was significantly less efficacious and potent (Emax = 11.3 ± 3.5% and pEC50 = 2.2 ± 0.3). The AA metabolites (via COXs) PGF2α and U-46619 (a stable analog of thromboxane A2) produced increases in the IAS tone and force in the RSM. Conversely, AA metabolites (via 5-LO) lipoxin A4, 5-HETE, and leukotriene C4 decreased the IAS tone. Finally, the contractile effects of AA in the IAS were selectively attenuated by the COX-1 but not the COX-2 inhibitor. Collectively, the specific effects of AA and the COX inhibitor, the Western blot and RT-PCR analyses showing specifically higher levels of COX-1, suggest a preferential role of the COX (specifically COX-1) pathway versus the LO in the regulation of the IAS tone.
Keywords: smooth muscle tone, thromboxanes, prostaglandin F2α
the internal anal sphincter (IAS), an inner ring of smooth muscle in the anal canal, exhibits spontaneous tone that undergoes relaxation in response to the rectoanal inhibitory reflex (21). The basal tone in the IAS is one of the critical components responsible for the rectoanal continence. The IAS dysfunction, on the other hand, may lead to rectoanal incontinence and a number of other rectoanal motility disorders (1, 2, 21). Despite the critical role of the basal IAS tone in the rectoanal continence, the molecular mechanisms regulating the tone are not exactly understood. Previous studies from our laboratory show that the IAS tone is partially (∼25%) regulated by a local renin-angiotensin system (RAS) both in vivo (14) and in vitro (11, 13) settings. The present studies are designed to determine the nature of extracellular signal that may provide a trigger for the remaining portion of the IAS tone.
Recent studies in the IAS (15) in agreement with those in the human and cat lower esophageal sphincter (LES) (5, 6) show that group I secreted phospholipase A2 (sPLA2) plays an important role in the basal tone. The LES studies show that sPLA2 activity results in the release of arachidonic acid (AA) from the smooth muscle cell membrane phospholipids, which leads to contraction of the smooth muscle.
AA is metabolized by cyclooxygenases (COX-1 and COX-2) (20) or by 5-lipoxygenase (5-LO) (16), resulting in the formation of physiologically active metabolites (4, 17, 22, 26). Once integrated within the smooth muscle system, AA may produce different leukotrienes, lipoxins and 5-HETE (primarily via 5-LO), and thromboxanes or prostaglandins (primarily via COXs). These end products may produce variable effects in different smooth muscle preparations. The final net effect of AA, therefore, depends upon the relative importance of either the COX or 5-LO pathway and the specific effects of their end products. The effect and the role of AA metabolites in the IAS smooth muscle may provide important information on the role of COX versus 5-LO, along with their end products, in the IAS tone. Presently, such information in the IAS is not available.
In the present studies, we evaluated the effects of AA, AA-metabolizing enzymes (COX and 5-LO), and AA metabolites in the basal tone of the IAS. The data provide evidence for the distinct roles of and metabolizing enzymes in modulating the IAS basal tone. In addition, the present data show that the COX (excitatory) and 5-LO (inhibitory) pathways play opposite roles in the regulation of the IAS basal tone. Data also show that inhibition of 5-LO diverts the AA metabolic traffic toward the COX pathway.
MATERIAL AND METHODS
Tissue preparation.
Male Sprague-Dawley rats (300–350 g) were euthanized by decapitation, and IAS and RSM smooth muscle strips were prepared as described before (10, 11). Briefly, using sharp dissection, the IAS and RSM strips exclusively from the circular smooth muscle layer of the muscularis propria (∼0.5 mm × 7 mm) were prepared in the oxygenated Krebs′ physiological solution (KPS). The composition of KPS was as follows (in mM): 118.07 NaCl, 4.69 KCl, 2.52 CaCl2, 1.16 MgSO4, 1.01 NaH2PO4, 25 NaHCO3, and 11.10 glucose. The experimental protocol of the study was approved by the Institutional Animal Care and Use Committee of Thomas Jefferson University and was in accordance with the recommendations of the American Association for the Accreditation of Laboratory Animal Care.
Measurement of isometric tension.
The smooth muscle strips were transferred to 2-ml muscle baths containing oxygenated KPS at 37°C. One end of the strip was anchored at the bottom of the muscle bath while the other end was connected to a force transducer (model FT03; Grass Instruments, Quincy, MA). Isometric tension was measured by the PowerLab/8SP data acquisition system (ADInstruments) and recorded with Chart 4.1.2 (ADInstruments). Each smooth muscle strip was initially stretched to a tension of 0.7 g followed by 90 min of equilibration. During this period, the smooth muscle strips were replenished with fresh KPS every 20 min. The IAS smooth muscle strips were defined by their development of spontaneous tone and relaxation in response to electrical field stimulation (10 Hz, 20 V, 0.5-ms pulse duration, and 4 s of train duration). The rectal smooth muscles (RSM), on the other hand, were characterized by the lack of significant spontaneous tone and by the phasic activity.
Drug responses.
We examined the effects of AA (0.1–300 μM) before and after pretreatment with COX inhibitor indomethacin and 5-LO inhibitor nordihydroguaiaretic acid (NDGA). For these studies, we used lower concentrations (1 μM) of these inhibitors that cause minimal decrease in the IAS tone. We also tested the effects of indomethacin and NDGA (0.1–300 μM) in basal IAS tone. Additionally, we tested the effects of 5-LO products leukotrienes B4, C4, and D4 (LTB4, LTC4, LTD4, respectively), lipoxin (LX)A4, and 5-HETE (1–300 nM for all) and the effects of COX products PGF2α and thromboxane (Tx)A2 analog (1 nM to 100 μM). [Because of the unstable nature of TxA2 in solution, we used the synthetic stable analog of TxA2, U-46619 (9).] To determine the specific isoform of COX in the AA-increased IAS tone, some experiments were performed to determine the effects of SC-560 (COX-1 inhibitor) and rofecoxib (COX-2 inhibitor), both 0.1 and 0.3 μM, on the effects of AA. Relaxant and contractile responses in the IAS were measured and normalized by the maximal increase in the IAS tone by 100 μM bethanechol and by the maximum decrease by 50 mM EDTA, respectively, as previously described (3, 13, 18).
Western blot analysis.
Western blot studies were performed to determine the relative expression of 5-LO, COX-1, and COX-2 in the IAS versus the RSM. The IAS and RSM tissues were isolated as described in Tissue preparation and subjected to homogenization, protein extraction, and concentration determination by the method of Lowry et al. (19). Different protein groups were then separated according to their molecular weights by gel electrophoresis and transferred onto a nitrocellulose membrane (NCM) at 4°C.
The NCM was then incubated with the specific primary antibodies (goat anti-5-LO, rabbit anti-COX-1, and goat anti-COX-2; all at 1:1.000) for 2 h at RT. After NCMS were washed with Tris-buffered saline-Tween, they were incubated with horseradish peroxidase-labeled secondary antibody (1:10,000) for 1 h at RT. The corresponding bands were visualized with enhanced chemiluminescence substrate using the SuperSignal West Pico Chemiluminescent Substrate (Pierce, Rockford, IL) and Hyperfilm MP (Amersham Bioscience).
NCMs were then stripped of antibodies using the Restore Western Blot Stripping Buffer (Pierce) for 5 min at RT and then reprobed for α-actin using the specific primary (mouse IgG 1:10,000 for α-actin) and secondary (1:10,000) antibodies. Bands corresponding to different proteins were scanned (SnapSacn.310; Agfa, Ridgefield Park, NJ), and the integrated optical density (IOD) was determined using Image-Pro Plus 4.0. The relative densities were calculated by normalizing the IOD of each blot with that of α-actin.
RT-PCR.
Total RNAs from the IAS and RSM were isolated and purified by the acid guanidine-phenol-chloroform method (8) and quantified by the measurement of absorbance at 260 nm on a spectrophotometer. Total RNA (2.0 μg) was subjected to first-strand cDNA synthesis using oligo(dT) primers (Promega, Madison, WI) and Omniscript RT Kit (Qiagen, Germantown, MD) in a final volume of 20 μl at 42°C for 60 min. PCR primers specific for 5-LO, COX-1, COX-2, and β-actin cDNA were designed as shown in Table 1. PCR was performed in a Promega 2× Master Mix (Promega) in a final volume of 25 μl, using a Perkin-Elmer Thermal Cycler (PerkinElmer Life and Analytical Sciences). The PCR conditions consisted of 94°C for 2 min, followed by 35 cycles of 94°C for 30 s (denaturation), 59°C for 30 s (annealing), and 72°C for 1 min (extension). In the end, it was allowed a final extension at 72°C for 7 min. The PCR products were separated on 1.5% (wt/vol) agarose gel containing ethidium bromide and were visualized with UV light. The relative densities of 5-LO, COX-1, and COX-2 were calculated by normalizing the densities of each blot with that of β-actin.
Table 1.
Primers used in RT-PCRs for amplification of mRNA encoding COX-1, COX-2, 5-LO, and β-actin
| Primer | Strand | Sequence, 5′–3′ | Accession No. |
|---|---|---|---|
| COX-1 | Forward | ctcaccagtcattccctgttgttac | S67721 |
| Reverse | ctccatccagcacctggtacttaa | ||
| COX-2 | Forward | accgtggtgaatgtatgagcatagga | S67722 |
| Reverse | tcaggtgttgcacgtagtcttcgat | ||
| 5-LO | Forward | agaagcgcaaatacaggctccatga | J03960 |
| Reverse | gccatccagtagttcgtaatcaacg | ||
| β-actin | Forward | tgtttgagaccttcaacacccc | NM_007393 |
| Reverse | acgtcacacttcatgatggaa |
COX, cyclooxygenase; LO, lipoxygenase.
Drugs and antibodies.
AA, LTB4, LTC4, LTD4, LXA4, 5-HETE, PGF2α, and U-46619 were from Cayman (Cayman Chemical, Ann Arbor, MI). Bethanechol, indomethacin, NDGA, SC-560, and the antibody for α-actin were from Sigma-Aldrich (St. Louis, MO). Rofecoxib was obtained from Fisher (Fisher Scientific, Pittsburgh, PA). All other antibodies were from Santa Cruz (Santa Cruz Biotechnology, Santa Cruz, CA).
Data analysis.
Results were expressed as means ± SE. Concentration-response curves were analyzed using a nonlinear interactive fitting program (GraphPad Prism 3.0; Graph Pad Software). Agonist potencies and maximum responses were expressed as pEC50 (negative logarithm of the molar concentration of agonist producing 50% of the maximum response) and Emax (maximum effect elicited by the agonist), respectively. Inhibitor potencies and maximum inhibition were expressed as pIC50 (negative logarithm of the molar concentration of inhibitor producing 50% of the maximum inhibition) and Imax (maximum inhibition elicited by the inhibitor), respectively, calculated from the concentration-response curves. Statistical significance was tested by the one-way ANOVA followed by the Dunnett post hoc test when three or more different groups were compared. To compare only two different groups, the unpaired Student's t-test was used. A P value of <0.05 was considered to be statistically significant.
RESULTS
Effect of AA on the basal IAS tone and RSM force.
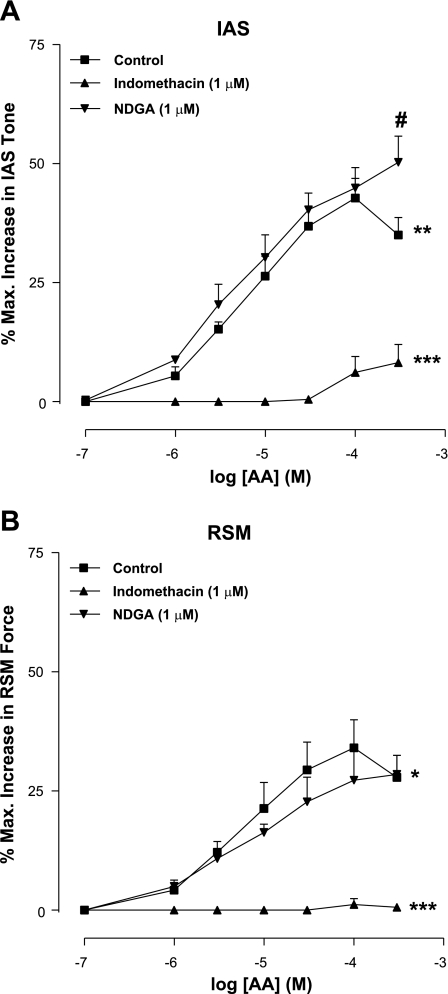
AA produced concentration-dependent increase in IAS tone with an Emax of 38.8 ± 3.0% and pEC50 of 3.4 ± 0.1 (n = 4; Fig. 1). In the RSM, on the other hand, AA was significantly (P < 0.05) less efficacious and potent in increasing the force of the RSM (Emax of 27.8 ± 4.6% and pEC50 of 2.6 ± 0.6; n = 4). The differences in the effects of AA in the IAS and RSM suggest the predominant role of AA integration in the IAS and the importance of its metabolites in the IAS tone.
Fig. 1.
Cumulative concentration-response curves for arachidonic acid (AA), showing significant increase in the internal anal sphincter (IAS) tone (A) and rectal smooth muscle (RSM) force (B; *P < 0.05). AA is more efficacious and potent in producing increase in the IAS tone versus force in the RSM (**P < 0.05). Indomethacin causes significant attenuation of AA effects both in the IAS and RSM (***P < 0.05). #P < 0.05. Data represent means ± SE of 4 independent determinations. NDGA, nordihydroguaiaretic acid.
Indomethacin significantly inhibited the AA-induced increases in the IAS tone as well as in the RSM force (n = 4; Fig. 1). Because of the low amplitude responses, it was not possible to calculate the pEC50 for AA in the presence of indomethacin.
NDGA had no significant effect (P > 0.05) on the overall concentration-response curve of AA. However, in the presence of NDGA, we observed a significant augmentation of the increase in the IAS tone caused by the higher concentration of AA (300 μM) (n = 4; Fig. 1A). This suggests that attenuation of the 5-LO inhibitory pathway in the IAS diverts the AA metabolic pathway in the direction of COX excitatory pathway. Interestingly, in the RSM, such augmentation of AA responses was not observed (P > 0.05; Fig. 1B).
Effects of indomethacin and NDGA on the IAS basal tone versus RSM force.
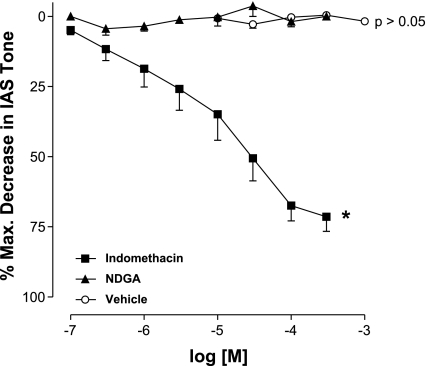
Indomethacin and NDGA are well known inhibitors of AA metabolism by the COXs and the 5-LO enzymes, respectively. Indomethacin concentration-dependently reduced the IAS basal tone with Imax of 71.5 ± 5.2% and pIC50 of 4.7 ± 0.3 (n = 9). On the other hand, NDGA and NaHCO3 (the aqueous solvent for both indomethacin and NDGA) did not produce any significant effect (P > 0.05; n = 4; Fig. 2). In contrast with the IAS, in the RSM, neither indomethacin nor NDGA produced any significant effect. This lack of effect of the inhibitors may have been because of the absence of any significant spontaneous tone in the RSM. To rule this out, experiments were repeated where the RSM force was elevated by 100 μM bethanechol. In these experimental settings, neither indomethacin nor NDGA had any significant effect on the elevated force of the RSM (data not shown).
Fig. 2.
Cumulative concentration-response curves for the dual cyclooxygenases (COXs) inhibitor indomethacin, the selective inhibitor of 5-lipoxygenase (5-LO) NDGA, and vehicle in the IAS of rats. Indomethacin produces a significant decrease in the IAS basal tone (*P < 0.05). NDGA and vehicle do not produce any significant effect (P > 0.05). Data represent means ± SE of 4–9 independent determinations.
Time course of indomethacin and NDGA effects on IAS basal tone.
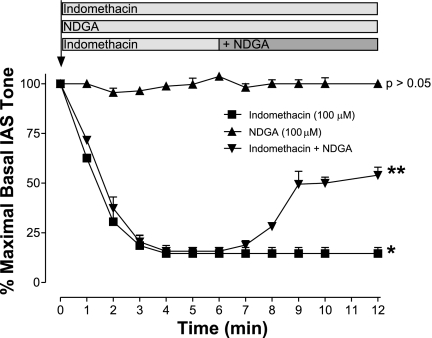
We evaluated the effect of indomethacin and NDGA (both 100 μM) on the basal tone of the IAS over different time intervals. Indomethacin produced maximal decrease in the IAS tone within 5 min of administration, which was maintained for at least 20 to 40 min (n = 4). On the contrary, in the basal state NDGA produced no significant effect (P > 0.05; n = 4). However, when NDGA was administered following the peak effect of indomethacin, NDGA caused an immediate and significant increase in the IAS tone (n = 4; Fig. 3). These results suggest that a part of the initial inhibitory effect by indomethacin in the IAS may be via the inhibitory 5-LO pathway. In addition, the data suggest that because of the dominant excitatory effect of COX, the functional expression of 5-LO inhibitory pathway was only discernible following complete COX inhibition.
Fig. 3.
Time course of the effect of indomethacin or NDGA (both at 100 μM) and the combination of indomethacin plus NDGA on the basal IAS tone. Data show significant (*P < 0.05; n = 4) sustained decrease in the IAS tone with indomethacin alone, whereas NDGA has no significant effect (P > 0.05; n = 4). NDGA administered 5 min following pretreatment with indomethacin causes significant reversal of the suppressed basal tone (**P < 0.05; n = 4).
Effects of COX and 5-LO metabolites on IAS basal tone.
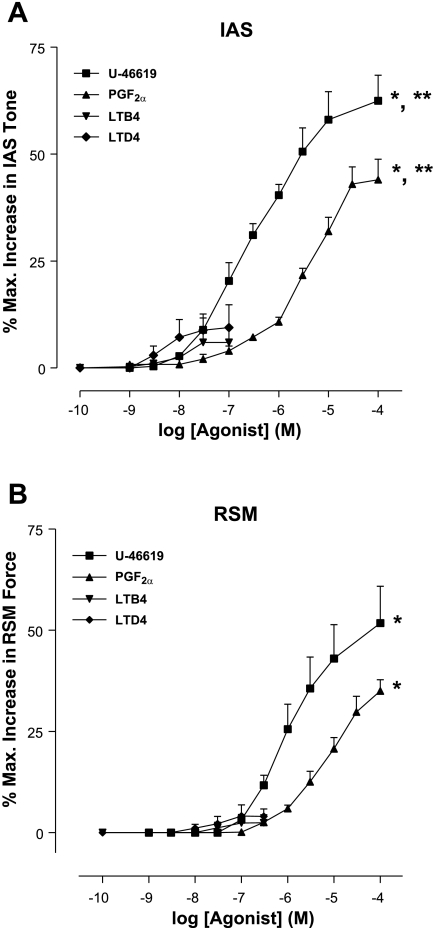
We evaluated the effects of the AA metabolites produced via COXs (PGF2α and TxA2) and 5-LO (LTB4, LTC4, LTD4, LXA4, and 5-HETE). Because of the unstable nature of TxA2, we examined the effect of U-46619, which is a stable analog of TxA2. U-46619 and PGF2α produced a prominent, significant, and concentration-dependent increase in the IAS tone (n = 4; Fig. 4A). On the other hand, LTB4 and LTD4 produced significantly less efficacious and potent increases in the IAS tone. A similar pattern of the effect of COX pathway metabolites was observed in the RSM; however, these agents were significantly more efficacious and potent in the IAS versus the RSM (n = 4; Fig. 4, A and B, and Table 2).
Fig. 4.
Concentration-response curves of the COX products thromboxane A2 (TxA2; represented here by its synthetic analog U-46619), prostaglandin F2α (PGF2α), and leukotrienes B4 and D4 (LTB4 and LTD4, respectively) in the IAS (A) and RSM (B). Note that only PGF2α and TxA2 produce significant increase in the IAS basal tone (*P < 0.05; n = 4). In addition, data show significantly higher potency and efficacy of the metabolites in the case of IAS versus RSM (**P < 0.05; n = 4).
Table 2.
Values of Emax and pEC50 for different agonists in the IAS
| Agonist | Effect on IAS |
Emax, % |
pEC50
|
||
|---|---|---|---|---|---|
| Tone | IAS | RSM | IAS | ||
| PGF2α | † | 44.0±4.8 | 35.5±2.7 | 4.0±0.1* | 3.5±0.1 |
| U-46619 | † | 62.4±6.0 | 52.8±7.3 | 5.3±0.2* | 4.5±0.2 |
| LTB4 | ‡ | 6.0±3.4 | 2.4±2.0 | NP | NSE |
| LTC4 | § | 21.2±1.7* | NSE | 5.2±0.4* | NSE |
| LTD4 | ‡ | 9.5±5.3 | 4.0±1.9 | NP | NSE |
| LXA4 | § | 27.0±2.5* | NSE | 5.1±0.6* | NSE |
| 5-HETE | § | 27.3±2.2* | NSE | 4.5±0.4* | NSE |
Values are means ± SE. IAS, internal anal sphincter; Emax, maximal response of smooth muscle elicited by the agonist; pEC50, –log EC50; LTB4, LTC4, and LTD4, leukotrienes B4, C4, and D4, respectively; LXA4, lipoxin A4; NSE, no significant effect; NP, not possible to calculate.
P < 0.05, significantly different from rectum smooth muscle (RSM; by the Student's t-test);
a prominent increase;
a modest increase;
a prominent decrease.
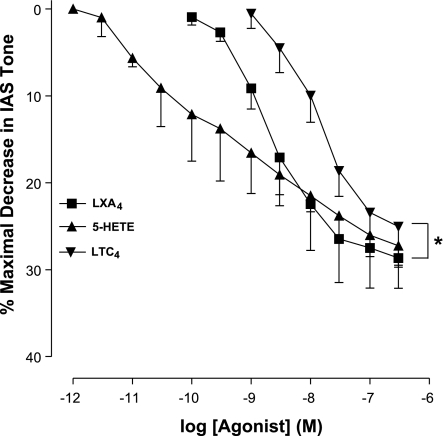
Interestingly, the AA metabolites released via the 5-LO (especially LXA4, 5-HETE, and LTC4) pathway, rather than increase, produced significant and concentration-dependent decrease in the basal tone of the IAS (n = 4; Fig. 5). Because of the absence of significant levels of basal tone in the RSM, the effects of AA metabolites that produce IAS relaxation were not examined. The values for Emax and pEC50 are summarized in Table 2.
Fig. 5.
Concentration-response curves with leukotriene C4 (LTC4), lipoxin A4 (LXA4), and 5-HETE, the major products of AA metabolism via the 5-LO pathway. These agents produce concentration-dependent and significant (*P < 0.05; n = 4) decreases in the IAS basal tone.
Protein expression of COX-1, COX-2, and 5-LO using Western blot analyses.
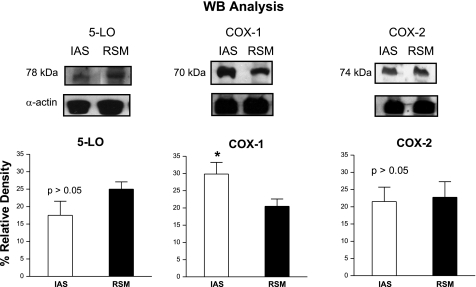
We evaluated the presence of COX-1, COX-2, and 5-LO in protein extracts from IAS and RSM. Although both tissues expressed COX-1, COX-2, and 5-LO, the IAS expressed significantly higher levels of COX-1 (n = 4; Fig. 6). There were no significant differences in the levels of COX-2 and 5-LO in the IAS compared with the RSM (P > 0.05; n = 4; Fig. 6).
Fig. 6.
Western blots (WB) analysis of IAS and RSM protein extracts for COXs and 5-LO. The integrated optical density was analyzed, and the percent relative density was calculated relative to that of α-actin. Columns show means ± SE of 4 independent determinations. Note that IAS expresses significantly (P < 0.05) higher levels of COX-1 than the RSM. Data show no significant differences in the levels of 5-LO and COX-2 between the IAS and the RSM (P > 0.05). Unpaired Student's t-test: *P < 0.05.
mRNA expression of COX-1, COX-2, and 5-LO using RT-PCR analyses.
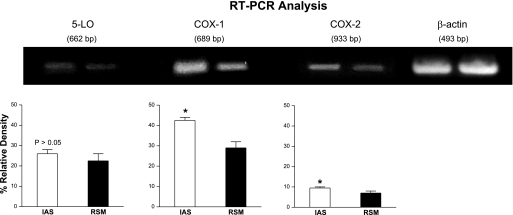
RT-PCR studies were performed to determine the relative levels of COX-1, COX-2, and 5-LO using RNA extracts from IAS and RSM. The IAS expressed significantly higher levels of COX-1 and COX-2 mRNAs (n = 4; Fig. 7). The levels of 5-LO, however, were not significantly different between the two tissues (P > 0.05; n = 4; Fig. 7).
Fig. 7.
RT-PCR for 5-LO, COX-1, and COX-2 using total RNA from the IAS and the RSM. Total RNA was subjected to RT at 37°C for 2 h and amplification in a thermocycler. The RT-PCR products were separated in an ethidium bromide-containing 1.5% agarose gel by electrophoresis and visualized on a UV transluminator, and the relative density of each band was analyzed. The percent relative density of COX and 5-LO bands was calculated as the ratio of β-actin. Data show significantly higher expression of COX-1 and COX-2 in the IAS versus RSM (*P < 0.05; n = 4). However, there were no significant differences in the levels of 5-LO in the IAS versus RSM (P > 0.05; n = 4). Unpaired Student's t-test: *P < 0.05.
These results suggest significant differences in the translational versus transcriptional levels of these enzymatic systems between the two tissues. The IAS had characteristically higher levels of COX-1 mRNA compared with the RSM (n = 4). On the other hand, COX-2 mRNA levels were only marginally significantly different from the RSM (n = 4). Regarding 5-LO, there were no significant differences in the levels of 5-LO mRNAs in the IAS versus the RSM (P > 0.05; n = 4). Data with the protein and mRNA expression levels with COX-1 are directly complimentary, showing characteristically higher levels of COX-1 in the IAS. The significance of comparable levels of 5-LO in both tissues remains to be determined.
Effect of COX-1 versus COX-2 selective inhibitors on the effect of AA-induced increase in the IAS tone.
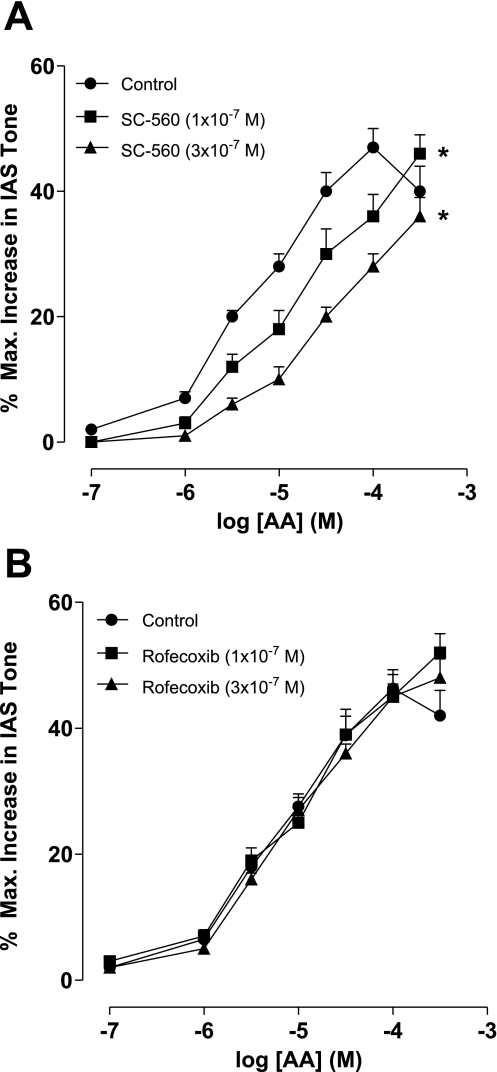
To determine the specific nature of COX-1 versus COX-2 in the rapidly induced increase in the IAS tone by AA, we examined the effect of SC-560 and rofecoxib, COX-1 and COX-2 inhibitors (7, 23), respectively. Data show that SC-560 caused concentration-dependent decrease in the AA-induced increase in the IAS tone (n = 4; Fig. 8A). Rofecoxib, on the other hand, had no significant effect on AA-induced increase in the IAS tone (P > 0.05; n = 4; Fig. 8B). These data combined with the higher expression of COX-1 in the IAS suggest that COX-1 is primarily responsible for the AA-induced increase in the IAS tone. However, exact significance of the higher levels of COX-2 mRNA in the IAS remains to be determined.
Fig. 8.
Effect of COX-1 (SC-560; A) and COX-2 (rofecoxib; B) selective inhibitors on the increase in the IAS tone by AA. As shown, SC-560 causes significant and concentration-dependent rightward shift in the AA concentration-response curves (*P < 0.05; n = 4; A). Rofecoxib, on the other hand, has no significant effect (P > 0.05; n = 4; B). These data suggest significant contribution of COX-1 versus COX-2 in AA metabolic pathway in the IAS.
DISCUSSION
Present studies suggest COX and 5-LO pathways play counter-regulatory roles in the IAS tone. In this regard, although the COX pathway is primarily excitatory, 5-LO may be inhibitory. The data further suggest that the COX pathway is in part responsible for the basal tone in the IAS. The role of COXs and 5-LO in the present studies was determined by the effect of AA and its metabolites and of the selective inhibitors of COXs and 5-LO. In addition, we examined the translational and transcriptional levels of these two distinct enzymatic pathways in the IAS.
Earlier studies from our laboratory suggest the involvement of a local RAS in part for the maintenance of the IAS basal tone via both in vivo (14) and in vitro (11, 13) experiments. Such findings clearly suggest the involvement of additional unknown mechanisms that provide external trigger for the genesis of basal tone. Previous studies in the human and cat LES (5, 6) suggest that AA metabolites produced via COX activity sustain basal tone in the LES. In the present study we specifically examined the role of AA metabolites via COX and 5-LO in the IAS tone. For the direct comparison, we also examined their role in the RSM, which is primarily phasic in nature.
The studies show COX inhibition by indomethacin causes significant and concentration-dependent decrease in the basal tone of the IAS. Second, the overall effect of AA is to increase the IAS tone. AA increased the IAS basal tone in a concentration-dependent manner. AA was significantly more efficacious and potent in the IAS than in the RSM. These effects of AA in the anorectal smooth muscle were selectively mediated via COX as they were virtually abolished by the lower concentrations of the dual COX inhibitor. These data suggest that AA metabolism via COXs contributes significantly toward the IAS basal tone. To provide further credence to the hypothesis, COX metabolites PGF2α and TxA2 (TxA2 represented by the synthetic analog U-46619) (20) cause potent increases in the IAS tone.
COX-mediated AA metabolism occurs primarily by two enzyme isoforms: COX-1 and COX-2. The constitutive isoform COX-1 is responsible for the production of prostaglandins and thromboxanes. COX-2, on the other hand, has been demonstrated to be involved in the inflammatory or mitogenic processes (26). Western blot and RT-PCR data show that the overall levels of COXs, especially COX-1, in the IAS is significantly higher that in the RSM. These results may provide an explanation for the more efficacious and more potent effects of AA in the IAS versus the RSM.
AA may also be converted by 5-LO into other physiologically relevant compounds such as LTB4, LTC4, LTD4, LXA4, and 5-HETE (4, 16, 17, 22). Detailed examination reveals that 5-LO inhibitor NDGA causes no significant effect on the IAS tone. Interestingly, however, NDGA partly reverses the indomethacin-decreased IAS tone. Additionally, the predominant effect of 5-LO metabolites (LTC4, LXA4, and 5-HETE) (16) is to decrease the IAS smooth muscle tone rather than increase as caused by the COX products. The other metabolites LTB4 and LTD4 do, however, produce marginal increases in the IAS tone without any significant effect on the RSM force. These data provide evidence for counter-regulation between the COX and the 5-LO pathways in the basal tone IAS tone. Additionally, current data suggest that in contrast with the prominent role of COX, the role of 5-LO in the IAS tone regulation may be limited.
Above data suggest that AA may potentially acquire the course of the excitatory pathways of COX or inhibitory via 5-LO in the IAS. This dual (excitatory and inhibitory) course that AA may follow versus the unidirectional course of thromboxane analog U-46619 may explain relatively lower efficacy and potency of AA in causing an increase in the IAS tone.
Superficially, similar trends of the effects of AA and metabolites may give an impression that these substances possess similar roles in the IAS and RSM. However, in-depth examination reveals important differences. The IAS compared with the RSM has higher levels of COX-1 and COX-2 at both the transcriptional and translational levels. Furthermore, functional studies reveal no significant effect of COX inhibition on the ongoing activity of RSM in contrast with its effect on the basal tone in the IAS. In addition, preliminary findings show that in the basal state IAS has characteristically higher levels of AA and metabolites (especially PGF2α and TxA2; unpublished observations).
Western blots and RT-PCR analyses reveal the presence of not only COX but also 5-LO in the anorectal tissues. To determine the functional significance of 5-LO, we examined the effects of 5-LO inhibition by NDGA. The data show that although NDGA by itself produces no significant effect, it partly reverses indomethacin-attenuated IAS tone. We speculate that that this reversal is because of the underlying portion of the counter-regulatory inhibitory pathway that is mediated via 5-LO.
Diverse studies show that COX and 5-LO have different affinities for AA. Km values for AA in the case of COX and 5-LO range from 1 to 3 μM and from 10 to 20 μM, respectively (24, 25). This difference may partly explain the divergent effects of NDGA, i.e., the lack of a significant effect by NDGA itself and significant increase in the IAS tone by NDGA following the COX inhibition. In addition, this difference may explain the predominantly excitatory role of COX by the revelation of potent decrease in the IAS tone with COX inhibition alone. Additionally, it may also explain the lack of significant effect of NDGA on the overall concentration-response curve of AA except at the higher concentrations (300 μM). We speculate lower affinity of 5-LO for AA compared with COX may primarily direct AA metabolic traffic in the direction of COX pathway. However, additional experiments monitoring AA metabolites in the presence of indomethacin and NDGA may further unravel this issue.
Recent studies from our laboratory have shown that COX-1 is primarily responsible for the basal tone in the IAS (12). Although this was not the main focus of the studies, following the lead from those findings, it was considered important to determine the role of COX-1 versus COX-2 in the AA-induced increase in the IAS tone. Significant attenuation of the AA effect by SC-560 and not by rofecoxib suggests that rapid conversion of AA into excitatory metabolites is primarily dependent upon the constitutive COX-1 pathway. The data, however, do not rule out the role of the inducible COX-2 pathway following long-term exposure of AA in the IAS.
In summary, these studies suggest that the biosynthesis of AA and its conversion into prostanoids by COXs, especially COX-1, within the smooth muscle cells may be important for the basal IAS tone. Conversely, 5-LO metabolites may provide inhibitory modulation of the IAS tone. These data provide evidence for the counter-regulation between the COX and the 5-LO pathways in the IAS. The studies have pathophysiological relevance in the anorectal motility disorders that affect the IAS.
GRANTS
The studies were supported by National Institute of Diabetes and Digestive and Kidney Diseases Grant DK-35385 and an institutional grant from Thomas Jefferson University (Philadelphia, PA).
The costs of publication of this article were defrayed in part by the payment of page charges. The article must therefore be hereby marked “advertisement” in accordance with 18 U.S.C. Section 1734 solely to indicate this fact.
REFERENCES
- 1.Bellicini N, Molloy PJ, Caushaj P, Kozlowski P. Fecal incontinence—a review. Dig Dis Sci 53: 41–46, 2008. [DOI] [PubMed] [Google Scholar]
- 2.Bharucha AE, Fletcher JG. Recent advances in assessing anorectal structure and functions. Gastroenterology 133: 1069–1074, 2007. [DOI] [PubMed] [Google Scholar]
- 3.Biancani P, Walsh JH, Behar J. Vasoactive intestinal polypeptide: a neurotransmitter for relaxation of the rabbit internal anal sphincter. Gastroenterology 89: 867–874, 1985. [DOI] [PubMed] [Google Scholar]
- 4.Borgeat P, Samuelsson B. Arachidonic acid metabolism in polymorphonuclear leukocytes: unstable intermediate in formation of dihydroxy acids. Proc Natl Acad Sci USA 76: 32313–33217, 1979. [DOI] [PMC free article] [PubMed] [Google Scholar]
- 5.Cao W, Harnett KM, Behar J, Biancani P. Group I secreted PLA2 in the maintenance of human lower esophageal sphincter tone. Gastroenterology 119: 243–252, 2000. [DOI] [PubMed] [Google Scholar]
- 6.Cao WB, Harnett KM, Chen Q, Jain MK, Behar J, Biancani P. Group I secreted PLA2 and arachidonic acid metabolites in the maintenance of cat LES tone. Am J Physiol Gastrointest Liver Physiol 277: G585–G598, 1999. [DOI] [PubMed] [Google Scholar]
- 7.Chan CC, Boyce C, Brideau S, Charleson W, Cromlish W, Ethier D, Evans J, Ford-Hutchinson AW, Forrest MJ, Gauthier JY, Gordon R, Gresser M, Guay J, Kargman S, Kennedy B, Leblanc Y, Leger S, Mancini J, O'Neill GP, Ouellet M, Patrick D, Percival MD, Perrier H, Prasit P, Rodger I, Tagari P, Therien M, Vickers P, Visco D, Wang Z, Webb J, Wong E, Xu LJ, Young RN, Zamboni R, Riendeau D. Rofecoxib [Vioxx, MK-0966; 4-(4′-methylsulfonylphenyl)-3-phenyl-2-(5H)-furanone]: a potent and orally active cyclooxygenase-2 inhibitor. Pharmacological and Biochemical Profiles. J Pharmacol Exp Ther 290: 551–560, 1999. [PubMed] [Google Scholar]
- 8.Chomczynski P, Sacchi N. Single step method of RNA isolation by acid guanidinium thiocyanate-phenol-chloroform extraction. Anal Biochem 162: 156–159, 1987. [DOI] [PubMed] [Google Scholar]
- 9.Coleman RA, Humphrey PP, Kennedy I, Levy GP, Lumley P. Comparison of the actions of U-46619, a prostaglandin H2-analog, with those of prostaglandin H2 and thromboxane A2 on some isolated smooth muscle preparations. Br J Pharmacol 73: 773–778, 1981. [DOI] [PMC free article] [PubMed] [Google Scholar]
- 10.De Godoy MAF, De Oliveira AM, Rattan S. Angiotensin II-induced relaxation of anococcygeus smooth muscle via desensitization of AT1 receptor, and activation of AT2 receptor associated with nitric-oxide synthase pathway. J Pharmacol Exp Ther 311: 394–401, 2004. [DOI] [PubMed] [Google Scholar]
- 11.De Godoy MAF, Dunn SR, Rattan S. Evidence for the role of angiotensin II biosynthesis in the rat internal anal sphincter tone. Gastroenterology 127: 127–138, 2004. [DOI] [PubMed] [Google Scholar]
- 12.De Godoy MAF, Rattan N, Rattan S. COX-1 vs. COX-2 as a determinant of the basal tone in the internal anal sphincter. Am J Physiol Gastrointest Liver Physiol 296: G219–G225, 2009. [DOI] [PMC free article] [PubMed] [Google Scholar]
- 13.De Godoy MAF, Rattan S. Autocrine regulation of internal anal sphincter tone by renin-angiotensin system: comparison with phasic smooth muscle. Am J Physiol Gastrointest Liver Physiol 289: G1164–G1175, 2005. [DOI] [PubMed] [Google Scholar]
- 14.De Godoy MAF, Rattan S. Angiotensin-converting enzyme and angiotensin II receptor subtype 1 inhibitors restitute hypertensive internal anal sphincter in the spontaneously hypertensive rats. J Pharmacol Exp Ther 318: 725–734, 2006. [DOI] [PubMed] [Google Scholar]
- 15.De Godoy MAF, Rattan S. Role of phospholipase A2 (group I secreted) in the genesis of basal tone in the internal anal sphincter smooth muscle. Am J Physiol Gastrointest Liver Physiol 293: G979–G986, 2007. [DOI] [PubMed] [Google Scholar]
- 16.Evans JF, Ferguson AD, Mosley RT, Hutchinson JH. What's all the FLAP about?: 5-lipoxygenase-activating protein inhibitors for inflammatory diseases. Trends Pharmacol Sci 29: 72–78, 2008. [DOI] [PubMed] [Google Scholar]
- 17.Goetzl EJ, Sun EF. Generation of uniquemono-hydroxy-eicosatetetraenoic acids from arachidonic acid by human neutrophils. J Exp Med 150: 406–411, 1979. [DOI] [PMC free article] [PubMed] [Google Scholar]
- 18.Grider JR Neurotransmitters mediating the intestinal peristaltic reflex in the mouse. J Pharmacol Exp Ther 307: 460–467, 2003. [DOI] [PubMed] [Google Scholar]
- 19.Lowry OH, Rosebrough NJ, Farr AL, Randall RJ. Protein measurement with the folin phenol reagent. J Biol Chem 193: 265–275, 1951. [PubMed] [Google Scholar]
- 20.Nakahata N Thromboxane A2: physiology/pathophysiology, cellular signal transduction and pharmacology. [Review]. Pharmacol Ther 118: 18–35, 2008. [DOI] [PubMed] [Google Scholar]
- 21.Rattan S The internal anal sphincter: regulation of smooth muscle tone and relaxation. Neurogastroenterol Motil 17: 50–59, 2005. [DOI] [PubMed] [Google Scholar]
- 22.Roberts LJ, Lewis RA, Oates JA, Austen KF. Prostaglandin, thromboxane, and 12-hydroxy-5,8,10,14-eicosatetranoic acid production by ionophore-stimulated rat serosal mast cells. Biochim Biophys Acta 575: 185–192, 1979. [DOI] [PubMed] [Google Scholar]
- 23.Smith CJ, Zhang Y, Koboldt CM, Muhammad J, Zweifel BS, Shaffer A, Talley JJ, Masferrer JL, Seibert K, Isakson PC. Pharmacological analysis of cycloosygenase-1 in inflammation. Proc Natl Acad Sci USA 95: 13313–13318, 1998. [DOI] [PMC free article] [PubMed] [Google Scholar]
- 24.Soberman RJ, Austen KF. Kinetics of the arachidonic acid 5- and 15-lipoxygenases of the human polymorphonuclear leukocyte. Adv Prostaglandin Thromboxane Leukot Res 15: 169–171, 1985. [PubMed] [Google Scholar]
- 25.Thuresson ED, Lakkides KM, Rieke CJ, Sun Y, Wingerd BA, Micielli R, Mulichak MG, Malkowski MG, Garabito RM. Prostaglandin endoperoxide H synthase-1: the functions of cyclooxygenase active site residues in the binding, positioning, and oxygenation of arachidonic acid. J Biol Chem 276: 10343–10357, 2001. [DOI] [PubMed] [Google Scholar]
- 26.Turini ME, DuBois RN. Cyclooxygenase-2: a therapeutic target. Annu Rev Med 53: 35–57, 2002. [DOI] [PubMed] [Google Scholar]


