Abstract
Eccentric cardiac remodeling seen in dilated cardiomyopathy or regurgitant valvular disease is a well-known process of heart failure progression, but its mechanoenergetic profile has not been yet established. We made a volume overload (VO) heart failure model in rats and for the first time investigated left ventricular (LV) mechanical work and energetics in cross-circulated whole heart preparations. Laparotomy was performed in 14 Wistar male rats, and abdominal aortic-inferior vena caval shunt was created in seven rats (VO group). Another seven rats underwent a sham operation without functional shunt (Sham group). LV dimensions changes were followed with weekly transthoracic echocardiography. Three months after surgery, we measured LV pressure and volume and myocardial O2 consumption in isolated heart cross circulation. LV internal dimensions in both systolic and diastolic phases were significantly increased in the VO group versus the Sham group (P < 0.05). LV pressure was markedly decreased in the VO group versus in the Sham group (P < 0.05). LV end-systolic pressure-volume relation shifted downward, and myocardial O2 consumption related to Ca2+ handling significantly decreased. The contractile response to Ca2+ infusion was attenuated. Nevertheless, the increase in Ca2+ handling-related O2 consumption per unit change in LV contractility in the VO group was significantly higher than that in the Sham group (P < 0.05). The levels of sarco(endo)plasmic reticulum Ca2+-ATPase 2a protein were reduced in the VO group (P < 0.01). In conclusion, VO failing rat hearts had a character of marked contractile dysfunction accompanied with less efficient energy utilization in the Ca2+ handling processes. These results suggest that restoring Ca2+ handling in excitation-contraction coupling would improve the contractility of the myocardium after eccentric cardiac remodeling.
Keywords: eccentric left ventricular hypertrophy, myocardial oxygen consumption, Ca2+ handling, sarco(endo)plasmic reticulum Ca2+-ATPase 2a, cross circulation, aortocaval shunt
heart failure is a major cause of mortality and morbidity. It is due to various diseases such as hypertension, ischemic heart disease, valvular heart disease, congenital heart disease, cardiomyopathy, myocarditis, and others. The heart is subject to excessive and/or long-term overload, which induces myocardial hypertrophy. Hypertrophy initially compensates cardiac function but finally leads to heart failure. The process of hypertrophy and heart failure progression is divided into two mechanisms, depending on the type of overload: pressure overloading (PO) and volume overloading (VO). PO induces concentric hypertrophy to normalize wall stress from the increase in pressure placed on cardiomyocytes. Concentric remodeling of the left ventricle (LV) is characterized by an increase in ventricular wall thickness due to vertical growing of cardiomyocytes, which is caused by the parallel addition of sarcomeres (8).
Conversely, VO promotes eccentric hypertrophy to compensate for excess blood volume in the LV chamber. Eccentric remodeling of the LV is characterized by a relatively small increase in wall thickness and longitudinal growing of cardiomyocytes.
Morphological analyses, functional studies using echocardiography (4), and molecular studies (10) have been conducted on both PO and VO rat hearts. However, the cardiac mechanoenergetics studies have not yet been well conducted. We have established a method to analyze specifically the LV mechanical work and energetics in an excised, blood-perfused whole heart preparation with a cross-circulation method (7, 14, 17, 19, 20, 24) and analyzed LV mechanoenergetics in a PO heart failure model.
In the present study, we focused on the investigation of the mechanical work and energetics in a VO heart failure model with an arteriovenous (AV) shunt in rats.
MATERIALS AND METHODS
Animals
All animal experiments were performed with the approval of the Animal Care Committee of the Massachusetts General Hospital and the Mount Sinai School of Medicine and in accordance with the National Institutes of Health Guide for the Care and Use of Laboratory Animals. Fourteen male Wistar rats (Charles River, MA) weighing 300–350 g were randomized into two groups: 1) rats subjected to abdominal aortocaval shunt procedures as described previously (VO rats, n = 7) (22) and 2) Sham-operated rats (Sham rats, n = 7).
Creation of the Animal Models
VO was induced via the aortocaval shunt method (5, 22). All rats were anesthetized for surgery with intraperitoneal injection of 50 mg/kg pentobarbital sodium. After endotracheal intubation, artificial ventilation was initiated. Heparin (200 units ip) was added to prevent thrombosis during aortic and vena caval occlusion and promote shunt patency. Ventral laparotomy was performed, and the abdominal aorta and inferior vena cava were exposed by blunt dissection between the renal arterial branch and the iliac bifurcation. Both vessels were temporally occluded at both proximal and distal sites of the intended shunt point with a Bulldog clip. An 18-gauge angio-catheter was inserted over a needle into the exposed free wall of the abdominal aorta and advanced through the medial wall into the vena cava to create the shunt. After the needle and the angio-catheter were withdrawn, the ventral aortic puncture site was sealed with a drop of cyanoacrylate (Krazy Glue; Elmer's Product Canada, Toronto, Ontario, Canada) to prevent or stop bleeding from the aortic puncture site. Successful shunt could be confirmed by seeing the mixing of oxygenated blood into the vena cava from the abdominal aorta. Sham-operated animals served as controls and were subjected to the same surgeries but had no functional shunt.
Echocardiography
Cardiac function after shunt creation was monitored weekly with transthoracic echocardiography (M mode and pulse wave Doppler) using a Vivid 7 ultrasound system (GE Healthcare, Waukesha, WI) equipped with a 14-MHz transducer under sedation with a low dose (25 mg/kg ip) of pentobarbital sodium. An M-mode pacing of the LV was obtained from the parasternal short-axis view at the level of the papillary muscles. M-mode recordings were then analyzed at a sweep speed of 150 mm/s with the axis of the probe aligned with the middle of the ventricle. The following parameters were measured and calculated using the leading edge method described by the American Society of Echocardiography (4, 12): LV internal dimensions (LVID) at both diastole and systole (LVIDd and LVIDs, respectively), LV posterior wall dimensions at both diastole and systole, interventricular septal (IVS) dimensions at both diastole (IVSd) and systole, heart rate (HR), percentage of LV fractional shortening, LV ejection fraction (EF), and cardiac output.
LV Mechanical and Energetic Studies
Surgical preparations.
LV mechanical and energetic studies were performed 3 mo after the creation of aortocaval shunt on the excised cross-circulated rat heart preparations, as reported previously (13). In each experiment, one VO or Sham rat and two retired breeder male crj:Wistar rats weighing 450–650 g were anesthetized with pentobarbital sodium (50 mg/kg ip), intubated, and ventilated. The study rat (VO or Sham) was used as heart donor, and the other two were used as blood supplier and metabolic supporter rats, respectively. All rats were heparinized (1,000 units intravascular). The beating donor heart was excised without an interruption of coronary perfusion and supported by cross circulation with the other metabolic supporter rat as previously reported in detail (7, 14, 17, 19, 24). The coronary arterial oxygenated blood of the donor heart was supplied from the common carotid arteries of the supporter rat using arterial cross-circulation tubing and a cannula inserted into the brachiocephalic artery of the donor heart. The coronary venous blood of the donor heart was collected from a cannula inserted into the right ventricle (RV) via the superior vena cava and the right atrium and returned to the right external jugular vein of the supporter rat using venous cross-circulation tubing and a cannula. The excised heart was maintained at 37°C by a heater. A thin latex balloon (balloon material volume, 0.08 or 0.10 ml) was inserted from the left atrial appendage into the LV and primed with water. The maximum unstretched volume of the used balloon was large enough to exceed measured end-diastolic volume in both VO and Sham rat hearts. The balloon was connected to a 0.5-ml precision glass syringe with fine scales (minimum scale, 0.005 ml) to allow changing LV volume (LVV) in 0.025-ml steps and also connected to a pressure transducer for measuring LV pressure (LVP) measurement. LVV was increased in steps up to an end-diastolic pressure (EDP) of around 10 mmHg in the control volume run. Systolic unstressed volume (V0) was determined by filling the balloon to the level where peak isovolumic pressure and hence pressure-volume area (PVA; see Data Analysis) were zero. The sum of intraballoon water volume and balloon material volume was used as an initial estimate of V0. V0 normalized by LV mass to 1 g was then finally determined as the volume-axis intercept of the best-fit end-systolic pressure (ESP)-volume relation (ESPVR). We obtained the best-fit ESPVR with an equation (ESP = A{1−exp[−B(V−V0)]}; A and B are parameters) by means of the least-squares method (Delta-Graph, DeltaPoint; Monterey, CA) on a personal computer (14, 17, 19, 24). We also obtained the best-fit EDP-volume relation (EDPVR) with an equation (EDP = A′{exp[B′(V−V0)]−1}; A′ and B′ are parameters). Correlation coefficients of the best-fit ESPVRs were higher than 0.98 (Table 1).
Table 1.
Variables of bodies, hearts, and lungs
| Sham | VO | P | |
|---|---|---|---|
| Body weight, g | 609±81 | 609±66 | 0.823 |
| LV weight, g | 1.05±0.15 | 1.41±0.21 | 0.016* |
| RV weight, g | 0.23±0.04 | 0.38±0.07 | 0.006* |
| LV + RV weight, g | 1.28±0.18 | 1.79±0.26 | 0.008* |
| LV weight/body weight, % | 0.17±0.02 | 0.23±0.02 | 0.007* |
| RV weight/body weight, % | 0.03±0.01 | 0.06±0.01 | 0.005* |
| LV + RV weight/body weight, % | 0.21±0.02 | 0.29±0.03 | 0.004* |
| Lung weight, g | 1.97±0.47 | 2.26±0.48 | 0.319 |
Values are means ± SD; n = 7 Sham rats and 7 volume overload (VO) rats. LV, left ventricle; RV, right ventricle; P, value of probability.
P < 0.05 vs. Sham.
The HR was constantly maintained by electrical pacing of the right atrium, and the pacing rate was adjusted around 300 beats/min to avoid causing incomplete relaxation or arrhythmia. The systemic arterial blood pressure of the supporter rat served as the coronary perfusion pressure (90–120 mmHg). Arterial O2 saturation and O2 content of the supporter rat were monitored with an oximeter (model IL682 CO-Oxymeter; Instrumentation Laboratory) and maintained within their physiological ranges with ventilation adjustment and supplemental O2 and sodium bicarbonate.
Calculation of O2 consumption.
Total myocardial O2 consumption per beat (V̇o2) was obtained as the product of coronary flow and coronary AV O2 content difference (AVO2D) divided by the pacing rate (300 beats/min) (14, 17, 19, 24). Total coronary blood flow was continuously measured with an ultrasonic flowmeter (model T206; Transonic System, Ithaca, NY) placed in the middle of the venous drainage tubing from the RV. LV thebesian flow is negligible. The coronary AVO2D was continuously measured by passing all the arterial and venous cross-circulation blood through the cuvettes of a custom-made AVO2D analyzer (PWA-200S, Shoe Technica; Chiba, Japan) as previously reported in detail (14, 17, 19, 24).
Calculation of PVA.
PVA was defined as the systolic PVA circumscribed by the curvilinear ESPVR, the EDPVR, and the systolic portion of the ventricular pressure-volume trajectory and was obtained by the integration of ESPVR and EDPVR. The areas under the ESPVR and EDPVR were obtained by the integration of the best-fit exponential functions. Based on our previous publications (14, 17, 19, 24), we obtained control ESPVR and determined a midrange LV volume (mLVV) under which contractility changes in response to Ca2+ infusion (16). As the balloon volume generally changed between 0 and 0.10 ml in Sham rats and between 0 and 0.20 ml in VO rats, respectively, we adopted mLVV normalized by LV mass to 1 g at balloon volume of 0.05 ml for Sham LVs and at balloon volume of 0.10 ml for VO LVs. We calculated ESP at mLVV (ESPmLVV) and PVA at mLVV (PVAmLVV) to assess LV mechanical work and energetics in the two groups.
As shown previously (14, 17, 19, 24), the V̇o2-PVA relationship was linear in the rat LV. Its slope represents the O2 cost of PVA, and its V̇o2 intercept represents the PVA-independent V̇o2. The PVA-independent V̇o2 is composed of V̇o2 in excitation-contraction (E-C) coupling (18) and basal metabolism (11, 17). The RV was kept collapsed (and therefore unloaded) by continuous hydrostatic drainage of the coronary venous return so that the RV PVA and hence PVA-dependent V̇o2 were assumed to be negligible (19, 20). The RV component of total V̇o2, which is considered constant irrespective of LV volume, was calculated by multiplying biventricular V̇o2 under unloaded LV volume with the ratio of the RV weight divided by the sum of the RV and LV weight. The RV PVA-independent V̇o2 (14, 17, 19, 24) was subtracted from the total V̇o2 to yield LV V̇o2 expressed as V̇o2. The LV (including the septum) and the RV were weighed at the end of the experiment for normalization of LVV.
Experimental protocol.
LVP, LV V̇o2, and systolic PVA data were obtained at more than five different LV volumes from 0 to 0.2 ml of intraballoon volume in 0.025-ml increments, without inotropic interventions [control volume-loading run (vol-run)]. After the vol-run, the Ca2+ inotropic run (Ca2+ ino-run) was performed at an mLVV by intracoronary infusion of 1% CaCl2 solution. The infusion rate of CaCl2 solution was increased stepwise from 0 to 6 ml/h. Steady-state V̇o2 was reached 2 to 3 min after change of LV volume and 4 min after change of infusion rate. Finally, cardiac arrest was induced by intracoronary infusion of 1 M KCl (12 ml/h) to obtain O2 consumption for basal metabolism. At each steady state, data were sampled at 500 Hz for 2 s simultaneously, and the sampling was usually repeated three times at 0.5- to 1-min intervals.
Data Analysis
V̇o2 for Ca2+ handling during the Ca2+ ino-run.
In previous mechanoenergetic studies in excised rat hearts (14, 17, 19, 24), a linear V̇o2-PVA relation obtained during Ca2+ infusion (Ca2+ V̇o2-PVA relation) was shifted upward in parallel with the control V̇o2-PVA relation before Ca2+ infusion. Such parallelism was also observed in VO rat hearts in our preliminary experiments. The V̇o2-intercept (PVA-independent V̇o2) corresponds primarily to the V̇o2 for Ca2+ handling in E-C coupling and for basal metabolism (11, 17, 18). The increased V̇o2 intercept of the Ca2+ V̇o2-PVA relation is attributable to the increased V̇o2 for enhanced Ca2+ handling due to the unchanged V̇o2 for basal metabolism (17). Thus, at increasing levels of inotropy, the intercept of the V̇o2-PVA relationship increases, but the slope remains unchanged. Based on this parallelism, the lines of V̇o2-PVA linear relationships at different rates of Ca2+ infusion at an mLVV were drawn in parallel to the control V̇o2-PVA relation line, as described previously (14, 17, 19, 24).
During the Ca2+ ino-run at an mLVV, ESPVR curves at different infusion rates were obtained as best-fit exponential function curves. We calculated PVAmLVV during Ca2+ infusion on a personal computer (14, 17, 19, 24). We then obtained the two composite V̇o2-PVAmLVV data points. After we drew the lines, including each V̇o2-PVAmLVV data point, in parallel to the control V̇o2-PVA relation, we obtained the V̇o2 intercept at each infusion rate. We subtracted basal metabolic V̇o2 per beat, measured in KCl-arrested hearts, from PVA-independent V̇o2 to obtain V̇o2 for Ca2+ handling in E-C coupling.
LV contractility.
Our recently proposed index for LV contractility (i.e., equivalent maximal elastance [eEmax]) was calculated from ESP-volume ratio of the specific virtual triangular area, which is energetically equivalent to PVAmLVV as previously described (17, 20).
O2 cost of LV contractility.
The O2 cost of LV contractility was obtained as the slope of the linear relation between V̇o2 for Ca2+ handling in E-C coupling and eEmax at an mLVV during the Ca2+ ino-run. At every infusion rate, there was a corresponding eEmax and a corresponding V̇o2 for Ca2+ handling in E-C coupling derived from the V̇o2-PVA intercept (PVA-independent V̇o2). eEmax and PVA-independent V̇o2 were also linearly related. The slope of the latter linear relationship, defined as the O2 cost of LV contractility, quantifies the change in V̇o2 for Ca2+ handling per unit change in LV contractility.
Western blot for sarco(endo)plasmic reticulum Ca2+-ATPase 2a and sodium-calcium exchanger proteins.
LV myocardium from each heart was frozen and stored at −80°C after the mechanoenergetic studies. The frozen hearts were thawed and homogenized. The homogenates were matched for protein concentration, subjected to SDS-PAGE, and transferred to nitrocellulose membranes. For immunoreactions, the blots were incubated with primary antibodies to sarco(endo)plasmic reticulum Ca2+-ATPase 2a (SERCA2a; Affinity Bioreagents, Golden, CO), sodium-calcium exchanger (NCX)1 [Chemicon (Millipore), Billerica, MA], and GAPDH (Sigma-Aldrich, St. Louis, MO) and then subjected to enhanced chemiluminescence for detection. Both SERCA2a and NCX1 expressions were normalized to GAPDH expression.
Statistical analysis.
Values are means ± SD. Comparison of paired and unpaired individual values was performed by the paired and unpaired t-test, respectively. A value of P < 0.05 was considered statistically significant. All data are expressed as the means ± SD.
RESULTS
Echocardiography
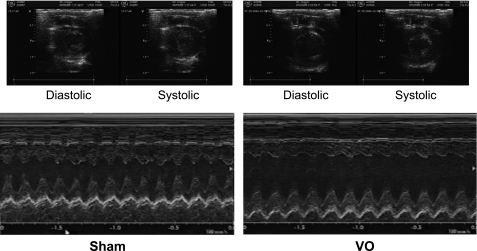
Typical M-mode echocardiograms in both VO and sham rats 10 wk after operation are displayed in Fig. 1.
Fig. 1.
Representative M-mode echocardiograms in both volume overloading (VO) and Sham rats 10 wk after aortocaval shunt creation. Left ventricular (LV) internal dimensions at both diastole and systole (LVIDd and LVIDs, respectively) were markedly increased in VO rats compared with those in Sham rats.
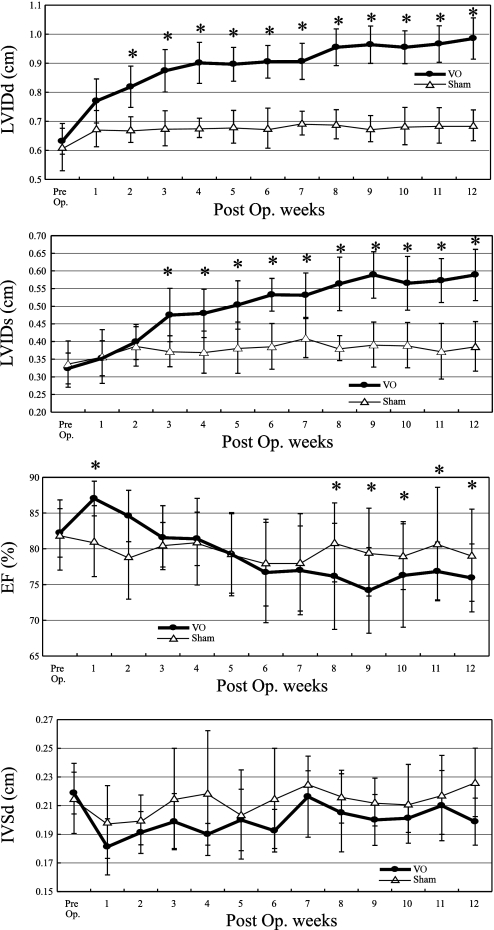
Figure 2 demonstrates serial changes in mean values of the LVIDd, LVIDs, EF, and IVS. From as early as 2 wk postsurgery, LVIDd significantly increased in VO compared with Sham rats. This trend continued up to 12 wk where VO rats exhibited chamber dilatation at diastole that reached 140% of that in Sham rats. The LVIDs in the VO group was significantly increased from 3 wk after shunt compared with that in the Sham group, then continued to increase gradually, and reached 150% of Sham rats after 9 wk. The delay means that the decreasing of cardiac contractility became notable 3 wk after shunt and took at least 9 wk to get worst. The EF in the VO group was increased for the first 2 wk after AV shunt creation and then decreased gradually, and the reduction less than Sham group was first noted at 6 wk. The IVSd in the VO group was slightly thinner compared with that in the Sham group.
Fig. 2.
Serial changes in echocardiographic parameters in VO and Sham rats. The LVIDd, LVIDs, percentage of LV ejection fraction (EF), percentage of LV fractional shortening, and interventricular septal dimensions in diastole (IVSd) are shown. *P < 0.05 vs. Sham. As early as 2 wk after the surgery, LVIDd significantly increased in VO compared with Sham rats. This trend continued up to 12 wk where VO rats exhibited chamber dilatation in diastole that reached 140% of that in Sham rats. The LVIDs in the VO group was significantly increased from 3 wk after shunt compared with that in the Sham group, then continued to increase gradually, and reached 150% of that in Sham rats after 9 wk. The EF in the VO group was increased at first 2 wk after arteriovenous shunt but then decreased gradually to become less than Sham group at 6 wk. The IVSd in the VO group was slightly thinner compared with that in the Sham group. Post Op, postoperation of shunt creation or sham procedure.
Characterization of Hearts and Lungs
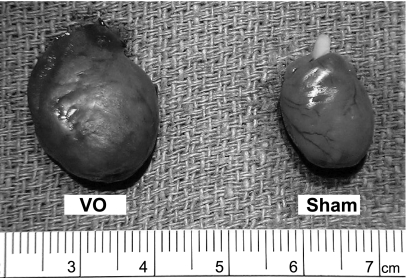
Figure 3 demonstrates the pictures of whole ventricle 3-mo post surgery. The heart in the VO group was remarkably enlarged compared with that in the Sham group. Both the LV and RV weights in the VO group were significantly heavier than those in the Sham group (Table 1).
Fig. 3.
Whole hearts 3 mo after aortocaval shunt surgery in both VO and Sham rats. The heart in the VO group was markedly enlarged compared with that in the Sham group.
LV Contractility
Summarized data of LV mechanical work and energetics are shown in Table 2.
Table 2.
Variables of LV mechanical works and energetics
| Sham | VO | P | |
|---|---|---|---|
| ESPVR | |||
| A, mmHg | 195±35 | 134±23 | 0.003* |
| B, 1/ml | 31.8±24.5 | 31.6±16.3 | 0.911 |
| V0, ×10−2 ml/g of LV | 7.79±1.11 | 7.36±1.37 | 0.601 |
| EDPVR | |||
| A′, mmHg | 0.20±0.34 | 0.30±0.26 | 0.483 |
| B′, 1/ml | 23.2±9.3 | 17.1±4.7 | 0.301 |
| ESPmLVV, mmHg | |||
| Pre-Ca2+ infusion | 130±39 | 98±19 | 0.039* |
| Under Ca2+ infusion, 1% CaCl2 6 ml/h | 186±37 | 127±24 | 0.003* |
| δESPmLVV | 56±30 | 29±25 | 0.045* |
| eEmax,,mLVV (baseline), mmHg·ml−1·g | 3,760±1,580 | 2,395±1,171 | 0.040* |
| V̇o2-PVA relation | |||
| Slope, ×10−3 μl O2·mmHg−1·ml−1 | 9.70±2.90 | 7.46±2.63 | 0.372 |
| V̇o2 intercept, ×10−1 μl O2·beat−1·g−1 | 2.77±0.70 | 2.06±0.89 | 0.040* |
| Basal metabolism, μl O2·min−1·g−1 | 16.8±5.9 | 15.4±4.7 | 0.123 |
| PVA-independent V̇o2-eEmax,mLVV relation | |||
| Slope, O2 cost of LV contractility, ×10−5 μl O2·ml·mmHg−1·beat−1·g−2 | 6.12±2.14 | 20.37±6.68 | 0.047* |
Values are means ± SD; n = 7 Sham rats and 7 VO rats. ESPVR, end-systolic pressure-volume relation; EDPVR, end-diastolic pressure-volume relation; ESPmLVV, end-systolic pressure at midrange LV volume (mLVV; see Calculation of PVA); δESPmLVV, (ESPmLVV under Ca2+ infusion) − (ESPmLVV pre-Ca2+ infusion); eEmax,mLVV, equivalent maximal elastance at mLVV; V̇o2, myocardial oxygen consumption per beat; PVA, pressure-volume area. See LV Mechanical and Energetic Studies for ESPVR and EDPVR parameters. V0 is the unstressed LV volume normalized by LV mass to 1 g.
P < 0.05 vs. Sham.
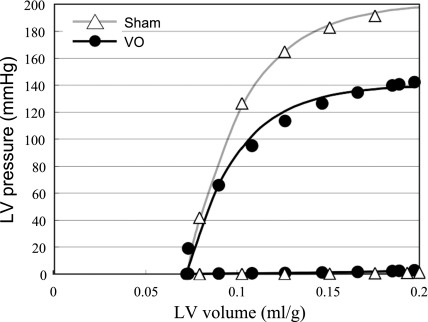
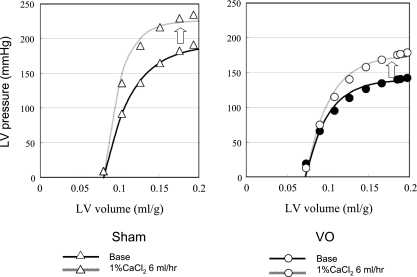
Figure 4 shows a representative data and best-fit curves of the ESPVR and EDPVR in both VO and Sham group. The LV ESPVR shifted downward, and thus the mean LV ESPmLVV was significantly decreased in the VO group compared with the Sham group (P < 0.01; Table 2), although the EDPVR did not shift upward.
Fig. 4.
Representative LV pressure-volume data and the best-fit curves [LV end-systolic pressure (ESP)-volume relation (ESPVR), LV end-diastolic pressure-volume relation (EDPVR)] in each heart for both VO and Sham groups. The LV ESP was markedly decreased in the VO compared with the Sham heart. The LV ESPVR shifted downward but the EDPVR did not shift upward in the VO heart.
Figure 5 shows representative data and best-fit ESPVRs during the Ca2+ infusion of both VO and Sham groups. The contractile response to Ca2+ infusion at a given concentration was smaller in the VO group than that in the Sham group. The mean δESPmLVV in the VO group was significantly smaller (P < 0.05) than that in Sham group (Table 2).
Fig. 5.
Representative LV pressure-volume data and ESPVRs under Ca2+ infusion at a rate of 6 ml/h in both hearts from Sham and VO groups. The contractile response to Ca2+ infusion was smaller in the VO heart than that in the Sham heart.
LV Energetics
Summarized data of LV energetics are also shown in Table 2.
V̇o2-PVA Relationship
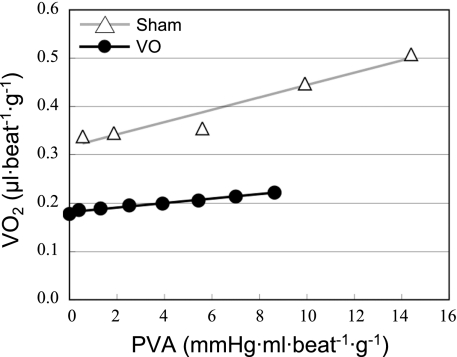
Figure 6 shows each set of representative V̇o2-PVA data and the best-fit V̇o2-PVA linear relations in VO and Sham hearts. The V̇o2 intercept was smaller in this VO heart than in the Sham heart, but the slopes of both V̇o2-PVA relations were similar. The mean V̇o2 intercept was significantly smaller in the VO group than that in the Sham group (Table 2), but the mean slopes of V̇o2-PVA linear relations did not differ significantly between VO and Sham groups (Table 2). Basal metabolism obtained by KCl arrest was unchanged in the VO and Sham groups (Table 2) and thus the significantly smaller V̇o2 intercept in VO group was due to the decreased O2 consumption associated with Ca2+ handling in E-C coupling.
Fig. 6.
Representative V̇o2-pressure-volume area (PVA) data and best-fit linear regression lines (the V̇o2-PVA linear relations). The V̇o2 intercept was smaller in the VO heart than in the Sham heart, but the slopes were similar in both VO and Sham hearts.
O2 Cost of LV Contractility
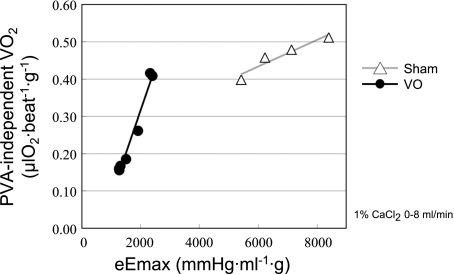
Figure 7 shows each set of representative PVA-independent V̇o2-eEmax,mLVV data and best-fit PVA-independent V̇o2-eEmax,mLVV regression lines in both VO and Sham hearts. Each slope of the regression lines denotes the O2 cost of LV contractility, an index quantifying the V̇o2 for Ca2+ handling per unit change in LV contractility, as mentioned in Data Analysis. The O2 cost of LV contractility in this VO heart was higher than that in the Sham heart. The mean O2 cost of LV contractility in the VO group was significantly higher (P < 0.05) than that in the Sham group (Table 2).
Fig. 7.
Representative PVA-independent V̇o2-equivalent maximal elastance (eEmax) midrange LV volume data and best-fit regression line (the PVA-independent V̇o2-eEmax linear relation; the slope of the relation is the O2 cost of LV contractility). The O2 cost of LV contractility in this VO heart was higher than that in the Sham heart.
Immunoblotting of SERCA2a and NCX Normalized to GAPDH
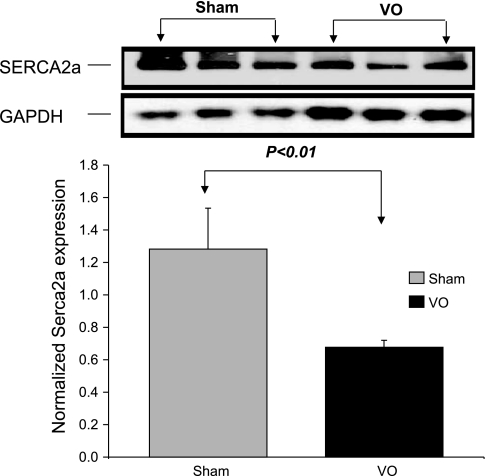
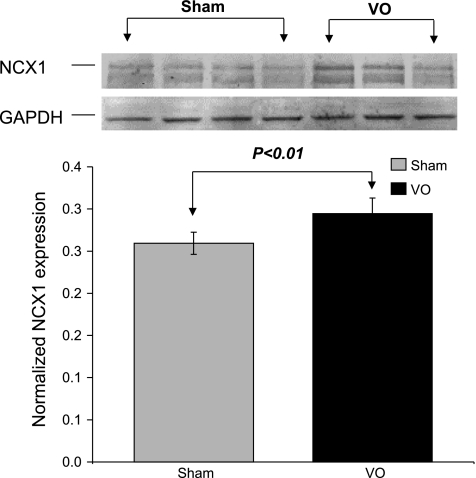
The mean protein level of SERCA2a in VO rat hearts was significantly lower (P < 0.01) than that in Sham rat hearts (Fig. 8). We also observed elevated levels (P < 0.01) of NCX protein in VO rat hearts (Fig. 9).
Fig. 8.
Immunoblotting of sarco(endo)plasmic reticulum Ca2+-ATPase 2a (SERCA2a) normalized to GAPDH. The mean protein level of SERCA2a in VO rat hearts was significantly lower (P < 0.01) than that in Sham rat hearts.
Fig. 9.
Immunoblotting of sodium-calcium exchanger (NCX) normalized to GAPDH. The mean protein level of NCX1 in VO rat hearts was significantly higher than that in Sham rat hearts.
DISCUSSION
There were several major findings in the VO rats in the present study. LV ESPVR shifted downward, and thus mean ESPmLVV and mean eEmax,mLVV (at an mLVV) were significantly decreased compared with those in the Sham rats, indicating systolic dysfunction. The contractile response to Ca2+ infusion (δESPmLVV) was significantly smaller in the VO rats than in the Sham rats. The mean slope of the V̇o2-PVA relation was hardly changed, but the V̇o2 intercept was significantly decreased with unchanged basal metabolism compared with those in the Sham rat, indicating the decreased Ca2+ handling-related V̇o2 at baseline. Finally, the mean slope of the relationship between Ca2+ handling-related V̇o2 and eEmax was significantly increased, indicating a less efficient energy utilization in the Ca2+ handling process.
Mechanical Function after AV Shunt
The VO rats created in the present study mainly showed LV systolic dysfunction, whereas diastolic function was almost unchanged. This is compatible with previous studies in a similar VO model in which LV eccentric hypertrophy and systolic dysfunction were apparent, whereas diastolic function and compliance of the ventricle were unchanged or enhanced (4). It is generally accepted that derangement of intracellular Ca2+ handling can play a crucial role in the development of the systolic and diastolic dysfunction accompanying arrhythmia. The mechanism of the LV contractile dysfunction in the present study can be also explained by a derangement of the Ca2+ handling process involved in E-C coupling.
Ca2+ Handling in E-C Coupling
We have previously reported that Ca2+ overload in the cytoplasm due to the impairment of the total Ca2+ handling in E-C coupling in the myocardium induced acute cardiac failure (19). The total Ca2+ handling in the myocardium is regulated by transsarcolemmal Ca2+ influx via L-type Ca2+ channel, Ca2+-induced Ca2+ release via the ryanodine receptor, Ca2+ uptake via the SERCA2a pump, NCX, and Na+-K+ pump coupled to NCX (17). The decreased activity of SERCA2a reduces Ca2+ uptake to the sarcoplasmic reticulum, leading to an increase in cytosolic Ca2+ in diastole and a reduction in Ca2+ release in systole.
In the VO rat, the LV V̇o2-PVA relation has a lower intercept with almost unchanged slope, indicating that total Ca2+ handling O2 consumption in E-C coupling is decreased under baseline conditions. However, the LV contractility-Ca2+ handling O2 consumption has a higher slope (O2 cost of LV contractility), suggesting one possibility that Ca2+ uptake via the SERCA2a pump is suppressed and instead NCX activity is enhanced during inotropic stimulation. Although NCX per se does not consume ATP to remove cytosolic Ca2 in exchange with influx Na+ (stoichiometry of 3Na+:1Ca2+), the influx Na+ must be pumped out by Na+-K+-ATPase with a stoichiometry of 3Na+:2K+:1ATP, resulting in the net stoichiometry of 1Ca2+:1ATP (3). On the other hand, SERCA2a removes cytosolic Ca2+ on the basis of a stoichiometry of 2Ca2+:1ATP. Therefore, the Ca2+ extrusion via NCX leads to twice the increase in energy expenditure compared with Ca2+ uptake by SERCA2a. Thus it seems most likely that the energy wasting in Ca2+ handling is induced mainly by the enhanced NCX activity. In the present study, the expression of the NCX protein was increased in the VO LV tissue. We also reported the same kinds of increased O2 consumption related to increased NCX activity in a PO hypertrophied rat heart (15). In the failing human heart, a reduction in SERCA2a expression and an increase in NCX expression have been reported (2, 9). This theory was supported by the result in the present study that the SERCA2a protein level was decreased and the NCX protein level was elevated in VO rat hearts. Therefore, in the VO rats, decreased Ca2+ uptake via the SERCA2a pump has impaired cardiac contractility and simultaneously induced energy wasting in E-C coupling.
Another possibility for higher O2 cost of LV contractility is due to leaky ryanodine receptors. Leaky ryanodine receptors can cause higher cytosolic Ca2+ concentrations in diastole (23), suggesting the possibility for increased energy expenditure by SERCA2a pump. However, the latter hypothesis is unlikely to explain all our findings; indeed, the protein level of SERCA2a in the VO rat hearts was lower than that in the Sham rat hearts, unless NCX1 is upregulated.
A third possibility is due to a lower Ca2+ sensitivity of the myofilament, since δESPmLVV induced by Ca2+ infusion was significantly smaller in the VO rat hearts (see Table 2). However, the increase of PVA-independent V̇o2 was actually larger in the VO rat heart than that in the Sham rat heart under the same protocol for Ca2+ infusion (see Fig. 7). Therefore, the higher O2 cost of LV contractility seems rather to derive from the larger increase of PVA-independent V̇o2.
Taken together, the possibility that Ca2+ uptake via the SERCA2a pump is suppressed and instead NCX activity is enhanced is the most likely explanation for our findings (15), although further studies including SERCA2a overexpression by gene transfer are needed to verify this possibility.
Chemomechanical Energy Transduction
In the VO hearts, the slope of the V̇o2-PVA relation was almost unchanged or slightly lower compared with that of the Sham heart. The slope of the V̇o2-PVA relation remained unchanged in hypothyroid (11) and diabetic (1) rat hearts, whereas a steeper slope of the V̇o2-PVA relation was reported in hyperthyroid rabbit hearts. It was reported that the slope of the V̇o2-PVA relation was related to the ratio of the myosin isoform component from predominantly V3 to predominantly V1 (i.e., the slope of the V̇o2-PVA relation increases when the V1-to-V3 ratio increases, and the slope of the V̇o2-PVA relation is unchanged when the V1-to-V3 ratio decreases) (6). It was also reported that a progressive decrease in V1 and an increase in V3 were apparent in the LV 8- to 16 wk after AV shunt (21). This report is consistent with the almost unchanged slope of the V̇o2-PVA relation in the VO rats. The slope of V̇o2-PVA relation reflects the ratio of chemomechanical energy transduction efficiency of the contractile machinery. Therefore, in the VO rats, energy wasting is not related to chemomechanical energy transduction.
Conclusion
VO failing rat hearts had a character of marked contractile dysfunction accompanied with inefficient energy utilization especially in E-C coupling.
Present results suggest that restoring the Ca2+ handling process in E-C coupling would improve myocardial contractility in the setting of eccentric cardiac remodeling.
GRANTS
This work was supported in part by National Heart, Lung, and Blood Institute Grants RO1-HL-078691, HL-071763, HL-080498, and HL-083156 (to R. Hajjar) and a grant from Transatlantic Network.
The costs of publication of this article were defrayed in part by the payment of page charges. The article must therefore be hereby marked “advertisement” in accordance with 18 U.S.C. Section 1734 solely to indicate this fact.
REFERENCES
- 1.Abe T, Ohga Y, Tabayashi N, Kobayashi S, Sakata S, Misawa H, Tsuji T, Kohzuki H, Suga H, Taniguchi S, Takaki M. Left ventricular diastolic dysfunction in type 2 diabetes mellitus model rats. Am J Physiol Heart Circ Physiol 282: H138–H148, 2002. [DOI] [PubMed] [Google Scholar]
- 2.Arai M, Matsui H, Periasamy M. Sarcoplasmic reticulum gene expression in cardiac hypertrophy and heart failure. Circ Res 74: 555–564, 1994. [DOI] [PubMed] [Google Scholar]
- 3.Bers DM Calcium fluxes involved in control of cardiac myocyte contraction. Circ Res 87: 275–281, 2000. [DOI] [PubMed] [Google Scholar]
- 4.Cantor EJ, Babick AP, Vasanji Z, Dhalla NS, Netticadan T. A comparative serial echocardiographic analysis of cardiac structure and function in rats subjected to pressure or volume overload. J Mol Cell Cardiol 38: 777–786, 2005. [DOI] [PubMed] [Google Scholar]
- 5.Garcia R, Diebold S. Simple, rapid, and effective method of producing aortocaval shunts in the rat. Cardiovasc Res 24: 430–432, 1990. [DOI] [PubMed] [Google Scholar]
- 6.Goto Y, Slinker BK, LeWinter MM. Decreased contractile efficiency and increased nonmechanical energy cost in hyperthyroid rabbit heart. Relation between O2 consumption and systolic pressure-volume area or force-time integral. Circ Res 66: 999–1011, 1990. [DOI] [PubMed] [Google Scholar]
- 7.Hata Y, Sakamoto T, Hosogi S, Ohe T, Suga H, Takaki M. Linear O2 use-pressure-volume area relation from curved end-systolic pressure-volume relation of the blood-perfused rat left ventricle. Jpn J Physiol 48: 197–204, 1998. [DOI] [PubMed] [Google Scholar]
- 8.Lorell BH, Carabello BA. Left ventricular hypertrophy: pathogenesis, detection, and prognosis. Circulation 102: 470–479, 2000. [DOI] [PubMed] [Google Scholar]
- 9.Mercadier JJ, Lompre AM, Duc P, Boheler KR, Fraysse JB, Wisnewsky C, Allen PD, Komajda M, Schwartz K. Altered sarcoplasmic reticulum Ca2+-ATPase gene expression in the human ventricle during end-stage heart failure. J Clin Invest 85: 305–309, 1990. [DOI] [PMC free article] [PubMed] [Google Scholar]
- 10.Miyazaki H, Oka N, Koga A, Ohmura H, Ueda T, Imaizumi T. Comparison of gene expression profiling in pressure and volume overload-induced myocardial hypertrophies in rats. Hypertens Res 29: 1029–1045, 2006. [DOI] [PubMed] [Google Scholar]
- 11.Ohga Y, Sakata S, Takenaka C, Abe T, Tsuji T, Taniguchi S, Takaki M. Cardiac dysfunction in terms of left ventricular mechanical work and energetics in hypothyroid rats. Am J Physiol Heart Circ Physiol 283: H631–H641, 2002. [DOI] [PubMed] [Google Scholar]
- 12.Sahn DJ, DeMaria A, Kisslo J, Weyman A. Recommendations regarding quantitation in M-mode echocardiography: results of a survey of echocardiographic measurements. Circulation 58: 1072–1083, 1978. [DOI] [PubMed] [Google Scholar]
- 13.Sakata S, Lebeche D, Sakata N, Sakata Y, Chemaly ER, Liang LF, Takewa Y, Jeong D, Park WJ, Kawase Y, Hajjar RJ. Targeted gene transfer increases contractility and decreases oxygen cost of contractility in normal rat hearts. Am J Physiol Heart Circ Physiol 292: H2356–H2363, 2007. [DOI] [PubMed] [Google Scholar]
- 14.Sakata S, Lebeche D, Sakata N, Sakata Y, Chemaly ER, Liang LF, Tsuji T, Takewa Y, del Monte F, Peluso R, Zsebo K, Jeong D, Park WJ, Kawase Y, Hajjar RJ. Restoration of mechanical and energetic function in failing aortic-banded rat hearts by gene transfer of calcium cycling proteins. J Mol Cell Cardiol 42: 852–861, 2007. [DOI] [PMC free article] [PubMed] [Google Scholar]
- 15.Shimizu J, Yamashita D, Misawa H, Tohne K, Matsuoka S, Kim B, Takeuchi A, Nakajima-Takenaka C, Takaki MT. Increased O2 consumption in excitation-contraction coupling in hypertrophied rat heart slices related to increased Na+-Ca2+ exchange activity. Jpn J Physiol 59: 63–74, 2009. [DOI] [PMC free article] [PubMed] [Google Scholar]
- 16.Stromer H, Cittadini A, Szymanska G, Apstein CS, Morgan JP. Validation of different methods to compare isovolumic cardiac function in isolated hearts of varying sizes. Am J Physiol Heart Circ Physiol 272: H501–H510, 1997. [DOI] [PubMed] [Google Scholar]
- 17.Takaki M Left ventricular mechanoenergetics in small animals. Jpn J Physiol 54: 175–207, 2004. [DOI] [PubMed] [Google Scholar]
- 18.Takaki M, Kohzuki H, Kawatani Y, Yoshida A, Ishidate H, Suga H. Sarcoplasmic reticulum Ca2+ pump blockade decreases O2 use of unloaded contracting rat heart slices: thapsigargin and cyclopiazonic acid. J Mol Cell Cardiol 30: 649–659, 1998. [DOI] [PubMed] [Google Scholar]
- 19.Tsuji T, Ohga Y, Yoshikawa Y, Sakata S, Abe T, Tabayashi N, Kobayashi S, Kohzuki H, Yoshida KI, Suga H, Kitamura S, Taniguchi S, Takaki M. Rat cardiac contractile dysfunction induced by Ca2+ overload: possible link to the proteolysis of α-fodrin. Am J Physiol Heart Circ Physiol 281: H1286–H1294, 2001. [DOI] [PubMed] [Google Scholar]
- 20.Tsuji T, Ohga Y, Yoshikawa Y, Sakata S, Kohzuki H, Misawa H, Abe T, Tabayashi N, Kobayashi S, Kitamura S, Taniguchi S, Suga H, Takaki M. New index for oxygen cost of contractility from curved end-systolic pressure-volume relations in cross-circulated rat hearts. Jpn J Physiol 49: 513–520, 1999. [DOI] [PubMed] [Google Scholar]
- 21.Wang X, Ren B, Liu S, Sentex E, Tappia PS, Dhalla NS. Characterization of cardiac hypertrophy and heart failure due to volume overload in the rat. J Appl Physiol 94: 752–763, 2003. [DOI] [PubMed] [Google Scholar]
- 22.Wang X, Sentex E, Saini HK, Chapman D, Dhalla NS. Upregulation of β-adrenergic receptors in heart failure due to volume overload. Am J Physiol Heart Circ Physiol 289: H151–H159, 2005. [DOI] [PubMed] [Google Scholar]
- 23.Yano M, Ono K, Ohkusa T, Suetsugu M, Kohno M, Hisaoka T, Kobayashi S, Hisamatsu Y, Yamamoto T, Kohno M, Noguchi N, Takasawa S, Okamoto H, Matsuzaki M. Altered stoichiometry of FKBP12.6 versus ryanodine receptor as a cause of abnormal Ca2+ leak through ryanodine receptor in heart failure. Circulation 102: 2131–2136, 2000. [DOI] [PubMed] [Google Scholar]
- 24.Yoshikawa Y, Hagihara H, Ohga Y, Nakajima-Takenaka C, Murata KY, Taniguchi S, Takaki M. Calpain inhibitor-1 protects the rat heart from ischemia-reperfusion injury: analysis by mechanical work and energetics. Am J Physiol Heart Circ Physiol 288: H1690–H1698, 2005. [DOI] [PubMed] [Google Scholar]


