Abstract
Three experiments assessed the relation between the differential-outcomes effect and resistance to change of delayed matching-to-sample performance. Pigeons produced delayed matching-to-sample trials by responding on variable-interval schedules in two components of a multiple schedule. In the same-outcome component, the probability of reinforcement was the same for both samples (.9 in Experiments 1 & 2, .5 in Experiment 3); in the different-outcomes component, the probability of reinforcement was .9 for one sample and .1 for the other. In all three experiments, the forgetting functions in the different-outcomes component were higher and shallower than in the same-outcomes component. When total reinforcement was greater in the same-outcomes component (Experiments 1 and 2), resistance to disruption by prefeeding, intercomponent food, extinction, or flashing lights typically was greater in that component. In Experiment 3, when total reinforcement was equated, resistance to disruption was similar across components. Thus, the level and slope of forgetting functions depended on differential reinforcement correlated with the samples, but the resistance to change of forgetting functions depended on total reinforcement in a component. Both aspects of the results can be explained by a model of delayed matching to sample performance.
Keywords: Delayed matching to sample, differential outcome effect, probability of reinforcement, resistance to change, pigeons
The differential outcomes effect (DOE) is the enhancement of discrimination accuracy when correct responses based on different conditional cues produce qualitatively or quantitatively different reinforcers. For example, Peterson, Wheeler, and Trapold (1980) trained one group of pigeons on matching to sample with tone and food for correct responses on trials with a green sample, and tone alone (no food) for correct responses on trials with a red sample. A second group received tone and food for all correct choices. Despite the fact that the latter group obtained more food reinforcers, the former group performed at higher levels of accuracy, especially when a retention interval was imposed after sample offset. This basic result has been repeated in a variety of discrimination paradigms with dogs, horses, and rats as well as pigeons, children with autism, and adults with dementia-related memory deficits. Thus, the DOE is both reliable in experimental research and important for applied work with humans. Finally, it is important theoretically for the insights into associative processes that it may yield (for review of data and theory, see Urcuioli, 2005).
In an early study of the DOE, Trapold (1970) suggested that the effect could be explained by distinctive outcome expectancies that were evoked by the conditional cues, and in his review of subsequent research, Urcuioli (2005) concurred. In the study cited above, Peterson et al. (1980) proposed that these expectancies must be especially persistent in order to account for the further enhancement of the DOE when a retention interval follows the samples. Relatedly, in a study of transfer across discrimination tasks involving differential outcomes, Urcuioli and Zentall (1992) suggested that outcome expectancies serve as the dominant cues for performance. The potency of differential outcomes in enhancing working memory and transfer, together with its empirical robustness across diverse experimental preparations, suggest that the DOE should also be highly resistant to disruption by variables external to the paradigm, such as changes in deprivation or the introduction of novel distractors.
Despite the plausibility of this expectation, a rough analogy suggests that it may be incorrect. Research on free-operant behavior maintained by schedules of reinforcement has repeatedly demonstrated that ratio schedules generate higher response rates than interval schedules in rats, pigeons, and humans (see Matthews, Shimoff, Catania, & Sagvolden, 1977 for data and review). This result has been observed within subjects in multiple schedules where ratio- and interval-schedule components alternate with equated reinforcer rates, and is robust enough to illustrate in undergraduate laboratory courses (Catania, Matthews, Silverman, & Yohalem, 1977). Nevertheless, Nevin, Grace, Holland, and McLean (2001) found that when reinforcer rates were equated, higher response rates on ratio schedules were generally less resistant to extinction and to other disruptors than lower response rates on interval schedules. By analogy, the higher accuracy levels engendered by differential outcomes in conditional discriminations may be no more resistant to change than the lower levels maintained by same outcomes.
The rationale for studying the resistance to change of operant behavior has been set forth by Nevin and Grace (2000). They reviewed data from a number of studies and concluded that resistance to change depended directly on reinforcer rate independently of response rate. Nevin, Milo, Odum, and Shahan (2003) extended resistance-to change analyses to the accuracy of matching-to-sample (MTS), and Odum, Shahan, and Nevin (2005) further extended these analyses to delayed matching-to-sample (DMTS). Both studies employed a paradigm where pigeons produced MTS or DMTS trials by responding on variable-interval (VI) schedules in multiple-schedule components with different reinforcer probabilities. This paradigm, which was introduced by Schaal, Odum, and Shahan (2000) and is designated multiple VI DMTS, permits within-subject, within-session, between-component comparisons of both VI response rates and DMTS accuracies after training to asymptote and during disruption. Thus, the effects of various disruptors on VI response rate can be evaluated and compared directly with their effects on MTS or DMTS accuracy. Both Nevin et al. and Odum et al. arranged different reinforcer probabilities for correct responses in the components, and found that both VI response rates and MTS or DMTS accuracies were higher at the end of training and were more resistant to prefeeding, to food presented between components, and to extinction in the component with the higher reinforcer probability. The authors concluded that free-operant response rate and conditional-discrimination accuracy were similarly dependent on the conditions of reinforcement.
Here, we employ the multiple VI DMTS paradigm to compare the accuracy and the resistance to change of DMTS performance with different reinforcer probabilities correlated with the samples in one component. The DOE based on different reinforcer probabilities has been reported by Santi and Roberts (1985), who arranged reinforcer probabilities of 1.0 and .2 for different samples for one group of pigeons and reinforcer probability .6 for both samples in a second group. The DOE has been observed within subjects by Jones and White (1994) and by Jones, White, and Alsop (1995), who arranged different reinforcer durations with red and green samples when a vertical bar was projected on the sample in DMTS trials, whereas reinforcer durations were the same when trials were accompanied by a horizontal bar. Experiment 2, Condition 2, of Jones et al. (1995) is of special interest because 3.5-s or 0.5-s reinforcer durations were correlated with correct choices on trials signaled by vertical bars trials, whereas 3.5-s reinforcer durations were arranged for all correct choices on trials signaled by horizontal bars. They found that the function relating accuracy to retention-interval length (the forgetting function) was higher and shallower in different-duration trials even though trial types were mixed and total access to the reinforcer was greater in same-duration trials. Thus, the DOE is robust enough to outweigh differences in overall reinforcement, as demonstrated earlier in the between-group study by Peterson et al. (1980) cited above.
We report three experiments comparing the effects of same (SO) and different (DO) reinforcer probabilities in the multiple VI DMTS paradigm. Experiment 1 examines rates of acquisition of VI DMTS performance in SO and DO components where reinforcer probability is higher overall than in the SO component, compares SO and DO performances in the steady state, and evaluates the effects of three disruptors that have been used frequently in research on the resistance to change of free-operant response rate. Experiment 2 attempts to refine the analysis of resistance to change by selective disruption during samples, retention intervals, and comparison stimuli in DMTS trials, again with higher overall reinforcer probability in the SO component than in the DO component. Experiment 3 explores steady-state performance and resistance to disruption when overall reinforcer probabilities are the same in SO and DO components. To anticipate, we will show that although DMTS accuracy is greater in DO components, resistance to change depends on the overall probability of reinforcement within a component and is not enhanced by differential reinforcement with respect to the samples.
Experiment 1
This experiment explored the resistance to change of forgetting functions established by differential outcomes with overall richer conditions of reinforcement in the SO than in the DO component. We expected to obtain higher and shallower forgetting functions in the steady state in DO than in SO components despite the difference in overall reinforcement, as previously found by Jones et al. (1995) in the signaled-trials paradigm and by Peterson et al. (1980) in between-group comparisons. Resistance to change was assessed by introducing three disruptors that have often been used in prior research: prefeeding, intercomponent food, and extinction, in order to determine whether differential outcomes establish greater resistance to change as well as more accurate DMTS performance.
Method
Subjects
Four experimentally naïve White Carneau pigeons were housed in individual cages with free access to water in a temperature-controlled room with a 12 hr/12 hr light-dark cycle. They were maintained at 80% +/- 15 g of their free-feeding weights by post-session feeding as needed.
Apparatus
Four Lehigh Valley Electronics pigeon chambers, 35 cm long, 35 cm high, and 30 cm wide, were equipped with three translucent pecking keys 2.5 cm in diameter, separated by 83 mm on centers, and 24 cm from the chamber floor. They could be transilluminated by red, green, yellow, blue, or white light, and required a force of about 0.10 N to operate. A houselight was located 4.5 cm above the center key and a food hopper containing pelleted pigeon chow was accessible through a 5 cm by 5.5 cm opening. During food presentations, the hopper was lighted white and all other lights were extinguished. White noise and chamber ventilation fans masked extraneous noise. Experimental contingencies were programmed and data were collected by a microcomputer running Med Associates® software in an adjacent room.
Procedure
The pigeons were trained to peck all three keys and were then trained for 84 sessions on multiple VI DMTS with 0.1-s retention intervals only. Over the course of these sessions, the reinforcer probabilities in the final procedure were gradually approximated. The last 30 sessions of pretraining arranged 0.1-s retention intervals with reinforcer probabilities of .9 following both samples in the SO component, and with reinforcer probabilities of .9 and .1 following different samples in the DO component.
The final baseline procedure was similar to that arranged by Odum et al. (2005). After a 15-s intercomponent interval (ICI), the center key was lit red or green to signal whether the component would have same (SO) or different (DO) outcomes for correct DMTS responses; color assignments were counterbalanced across pigeons. Key pecking produced DMTS trials with yellow or blue samples on the center key according to a VI 20-s schedule; if the subject failed to respond during the VI segment, the sample was presented after the expiration of the longest interval in the VI schedule plus 20 s. The sample remained on until the first key peck after 3 s or until 6 s had elapsed. After sample offset, the center key was lit with the color present during the VI for the duration of the retention interval, which was 0.1, 2, 4, or 8 s, selected randomly with the constraint that each duration occur once in every four trials. Over the course of a session, each sample color appeared equally often with each retention interval. At the end of the retention interval, the center key was darkened and the side keys were lit yellow and blue, randomly and equally often on the left and right keys. In SO components, a single peck to the comparison color that matched the sample produced 2-s access to food with probability .9. In DO components, correct matches produced 2-s access to food with probability .9 if the sample was one color, and with probability .1 if it was the other color, counterbalanced across subjects. Unreinforced correct responses and errors were followed by 2-s blackout, after which the center key was lit with red or green to signal the next VI DMTS cycle. Each SO or DO component remained in effect for four cycles. The first component of each session was chosen randomly; thereafter, SO and DO components alternated regularly, separated by 15-s ICIs. Sessions ended after six components of each type and were conducted daily unless the pigeons exceeded their body weight limits.
After 50 sessions of training on the final baseline procedure, performance was disrupted by prefeeding 30 g of pelleted pigeon chow in the home cage 30 min before the session; by giving response-independent access to food for 2 s according to a random-time (RT) 5-s schedule during the ICI; and by discontinuing all food presentations (Extinction). Each disruptor test lasted for 10 consecutive sessions, with a minimum of 15 baseline sessions intervening between tests. The ten baseline sessions immediately preceding each disruptor constituted the baseline against which disruptor effects were evaluated.
Measures
Average rates of VI key pecking and DMTS accuracies were calculated separately for SO and DO components in 10-session blocks. DMTS accuracy was expressed as log d, which is calculated as
| (1) |
where B1 was identified with responses to the correct comparison color on trials with reinforcer probability .9 and B2 was identified with pecks to the correct comparison color on trials with reinforcer probability .1 in DO components; responses were recorded as B1 or B2 in SO components if made to the same colors as those associated with .9 and .1 reinforcer probabilities in DO components. Log d is the logarithm of the geometric mean of the ratios of correct to incorrect responses following the two samples, and is often used in research on conditional discriminations because, unlike per cent correct, it avoids ceiling effects and is at least in principle independent of response bias (see Davison & Tustin, 1978).
Response bias – the tendency to prefer B1 over B2 or vice versa – is termed log b, and is calculated as
| (2) |
where the terms are defined as above. Log b is the logarithm of the geometric mean of the ratios of responses to the two comparisons given one or the other sample, and is often found to be a roughly linear increasing function of the logarithm of the ratio of reinforcers for the two correct responses (e.g., Jones & White, 1992). Here, log b provides a measure of the effects of differential reinforcer probabilities on response bias in the DO component and the corresponding bias, if any, in the SO component; values greater than 0 indicate bias toward the comparison with reinforcer probability .9 in the DO component.
Neither log d nor log b is defined if any of its terms is 0, as may happen with easy discriminations or extreme biases. Accordingly, in keeping with recommendations by Brown and White (2005), we added 0.25 to all cells for all calculations. As a result, with 6 trials per session at each retention interval in each component pooled over 10-session blocks, there were 30 trials each with yellow and blue samples and the maximum value of log d or log b is 2.083.
Results
Acquisition and baseline
The course of acquisition may be summarized by averaging log d and log b across retention intervals for successive 10-session blocks, separately for SO and DO components, to give an overall characterization of DMTS accuracy and bias. The upper panel of Figure 1 shows that when the final baseline procedure was introduced, average accuracy started at similar levels and then increased more rapidly and to a higher level in the DO than in the SO component. After the first 10 sessions, average log d was greater in the DO component for every pigeon in every block. These results replicate many previous findings (see Urcuioli, 2005, for review).
Fig. 1.
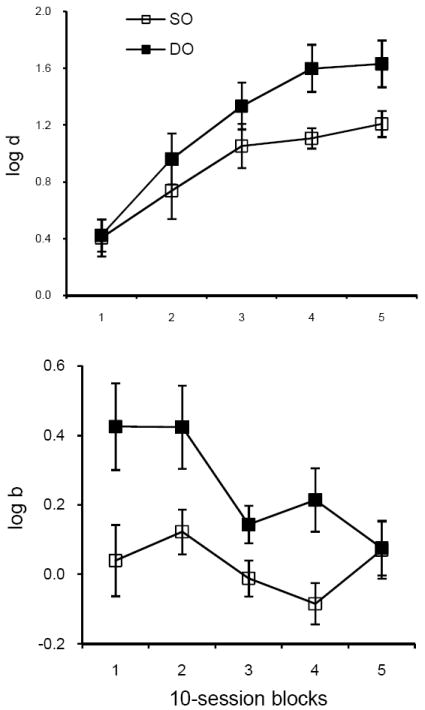
The upper panel shows how log d, averaged over retention intervals and subjects, changes in SO and DO components during 50 sessions of baseline training in Experiment 1. The lower panel presents a similar plot for log b. Range bars indicate standard errors.
The lower panel of Figure 1 shows that when the final baseline procedure was introduced, log b was substantially greater than 0 in the DO component but decreased over the course of acquisition, whereas the average value of log b fluctuated around 0 (no bias) in the SO component. In the final 10-session block, there was little difference between components and both were near 0. The results for the DO component do not replicate the steady-state effects of differential reinforcer probabilities on response bias in DMTS (e.g., Jones & White, 1992); we return to this issue in the Discussion.
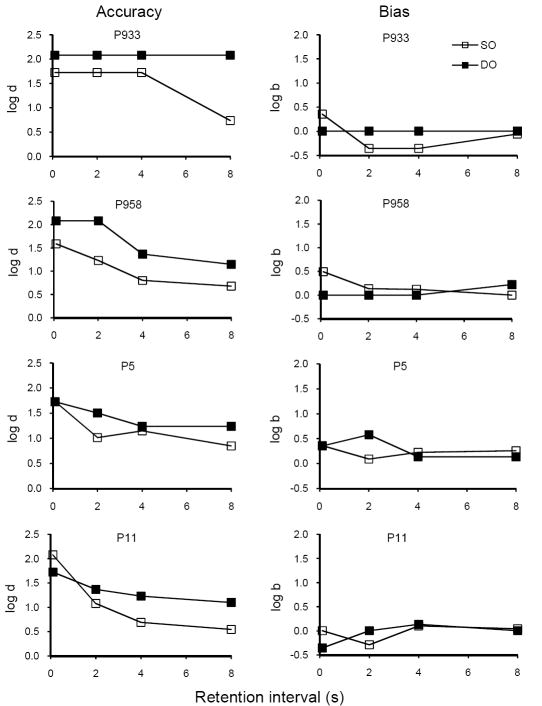
Individual forgetting functions relating log d to the retention interval for the final 10 sessions of baseline training are presented in the left column of Figure 2. Forgetting functions were higher and shallower in DO than in SO components for all four pigeons but accuracy at the shortest retention interval did not differ consistently between components. The right column presents corresponding functions relating log b to the retention interval in both components. Response bias varied irregularly across retention intervals, with no consistent differences between subjects or components. For P933, log b was forced to be 0 in the DO component because there were no errors and log d was maximal at 2.083 at all retention intervals. However, log d was well below its maximum value for the other pigeons, especially at longer retention intervals, so log b could have taken on values above (or below) 0. Nevertheless, there was no evidence that differential outcomes maintained systematic response biases despite the 9:1 reinforcer ratios arranged in the DO component and despite their effectiveness in enhancing DMTS accuracy. In view of the absence of systematic biases in our data, we do not report results for log b in the following analyses.
Fig. 2.
The left column displays forgetting functions for individual pigeons in SO (unfilled squares) and DO (filled squares) components for data pooled over the final 10 sessions of baseline training in Experiment 1 before disruptors were introduced. The right column shows the relation between response bias and retention interval length for the same sessions, where values greater than 0 signify a bias toward the comparison color correlated with the higher reinforcer probability in the DO component.
At the end of pretraining, VI response rates were somewhat higher for all pigeons in the SO than in the DO component. When the full set of delays was introduced, response rates did not change systematically; average values for the final ten sessions of training on the final baseline procedure are given in Table 1.
Table 1.
Average DMTS accuracy and VI response rate during baseline and disruption in Experiment 1, average proportions of baseline in each of three resistance tests, and results of one-tailed t-tests (3df) of differences in proportion of baseline between SO and DO components with significant differences in boldface. The magnitude of the DOE – the difference between accuracy levels in DO and SO components – is shown in a separate column.
| DMTS accuracy -- log d | VI responses/min | ||||
|---|---|---|---|---|---|
| Prefeeding | SO | DO | DOE | SO | DO |
| Baseline | 1.209 | 1.634 | 0.425 | 115.2 | 110.9 |
| Disrupt | 1.137 | 0.999 | -0.138 | 64.6 | 53.4 |
| Prop. BL | 0.942 | 0.635 | 0.569 | 0.491 | |
| t-test results | t = 9.13, p = .001 | t = 3.49, p = .020 | |||
| ICI food | SO | DO | SO | DO | |
| Baseline | 1.342 | 1.617 | 0.275 | 119.0 | 108.9 |
| Disrupt | 1.298 | 1.307 | 0.010 | 95.0 | 69.6 |
| Prop. BL | 0.992 | 0.814 | 0.795 | 0.639 | |
| t-test results | t = 2.78, p = .035 | t = 3.32, p = .023 | |||
| Extinction | SO | DO | SO | DO | |
| Baseline | 1.384 | 1.606 | 0.222 | 115.9 | 108.3 |
| Disrupt | 0.842 | 0.800 | -0.042 | 87.8 | 68.0 |
| Prop. BL | 0.641 | 0.501 | 0.763 | 0.646 | |
| t-test results | t = 1.82, p = .083 | t = 3.02, p = .028 | |||
Resistance tests
Prefeeding
Average forgetting functions based on data pooled for the 10 sessions with prefeeding 30 g of pigeon chow 30 min before sessions are shown in the upper panels of Figure 3 together with those for the preceding 10 sessions of baseline (from the individual data in Figure 2). Prefeeding had relatively little effect on the forgetting function in the SO component (left panel), but reduced the overall level of accuracy substantially in the DO component (right panel). To evaluate resistance to change of DMTS accuracy for individual subjects, the value of log d during prefeeding was averaged across retention intervals and expressed as a proportion of the average during baseline. The lower panels of Figure 3 present these data together with those for response rate, showing that proportions of baseline log d and of VI response rate were greater in the SO than in the DO component for all four pigeons; i.e., VI DMTS performance was more resistant to change in the SO component where overall reinforcement was more frequent. In addition, the proportions of baseline for average log d and VI response rate were correlated across subjects (r = .60).
Fig. 3.
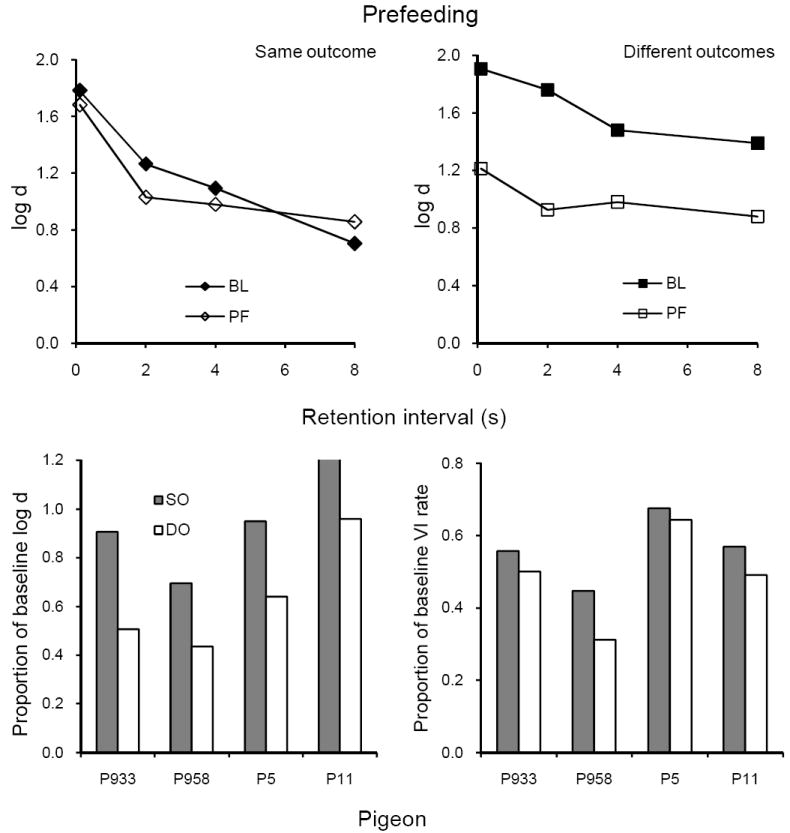
The upper panels present average forgetting functions in SO and DO components for 10 sessions of prefeeding and for the immediately preceding 10 sessions of baseline in Experiment 1. The lower panels present individual proportions of log d averaged over retention intervals (left panel) and VI response rates (right panel).
To evaluate the statistical significance of differences between components in resistance to change, we conducted one-tailed paired t-tests on the proportions of baseline displayed in the lower panels of Figure 3. Both differences were statistically significant (see summary in Table 1). One-tailed tests are appropriate because previous research has consistently found greater resistance to change of response rates in a schedule component with more frequent reinforcement, and that accuracy and response rate have been similarly affected by reinforcer rates (Nevin et al., 2003; Odum et al., 2005). Moreover, these dependent variables are correlated in the present data and their significance should be evaluated in the same way.
ICI food
Average forgetting functions based on data pooled for the 10 sessions with food presented during ICIs according to an RT 5-s schedule are shown in the upper panels of Figure 4 together with those for the immediately preceding 10 sessions of baseline; the latter are quite similar to baseline forgetting functions in Figure 3. ICI food had relatively small and inconsistent effects on the forgetting function in the SO component (left panel), but reduced accuracy at all retention intervals in the DO component (right panel). The lower panels show that proportions of baseline log d averaged over retention intervals and of VI response rates were greater in SO than in DO, relative to baseline, for all 4 pigeons. Both differences were statistically significant (see Table 1), and were correlated across subjects (r = .74).
Fig. 4.
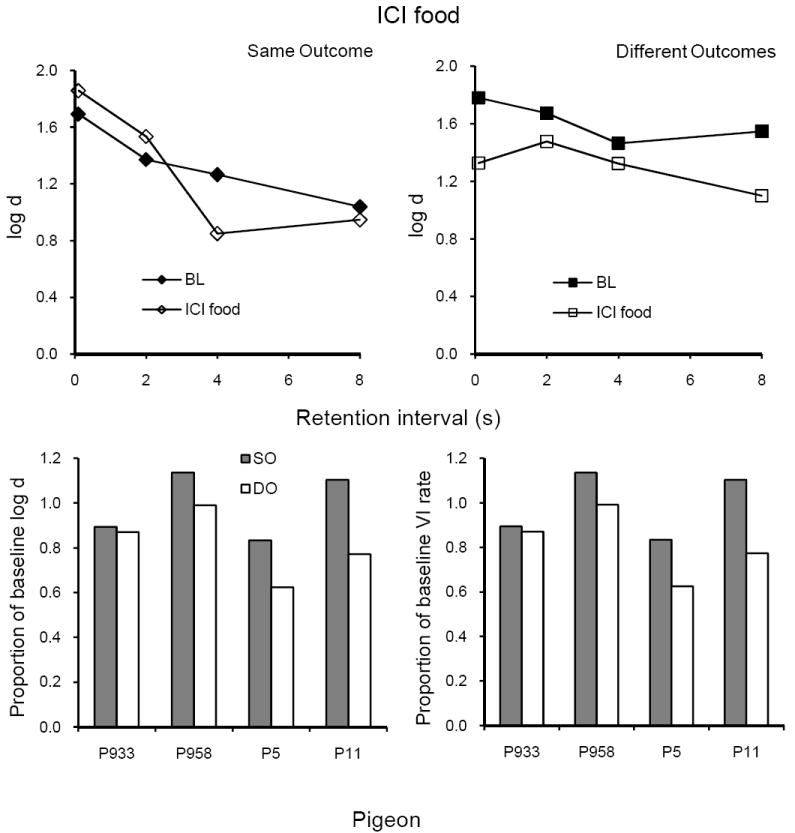
The upper panels present average forgetting functions in SO and DO components for 10 sessions with ICI food and for the immediately preceding 10 sessions of baseline in Experiment 1. The lower panels present individual proportions of log d averaged over retention intervals (left panel) and VI response rates (right panel).
Extinction
Average forgetting functions based on data pooled for all 10 sessions of extinction are shown in the upper panels of Figure 5 together with those for the immediately preceding 10 sessions of baseline; the latter are quite similar to baseline forgetting functions in Figures 3 and 4. Extinction clearly reduced the levels of the forgetting functions in both components, as shown in the left and right panels. The lower panels show that proportions of baseline average log d and of VI response rates were greater in SO than in DO, relative to baseline, for all 4 pigeons. The difference in VI response rates was statistically significant, but the difference in average log d was not significant due to between-subject variability in its magnitude (Table 1). Proportions of baseline log d and VI response rate were correlated across subjects (r = .62).
Fig. 5.
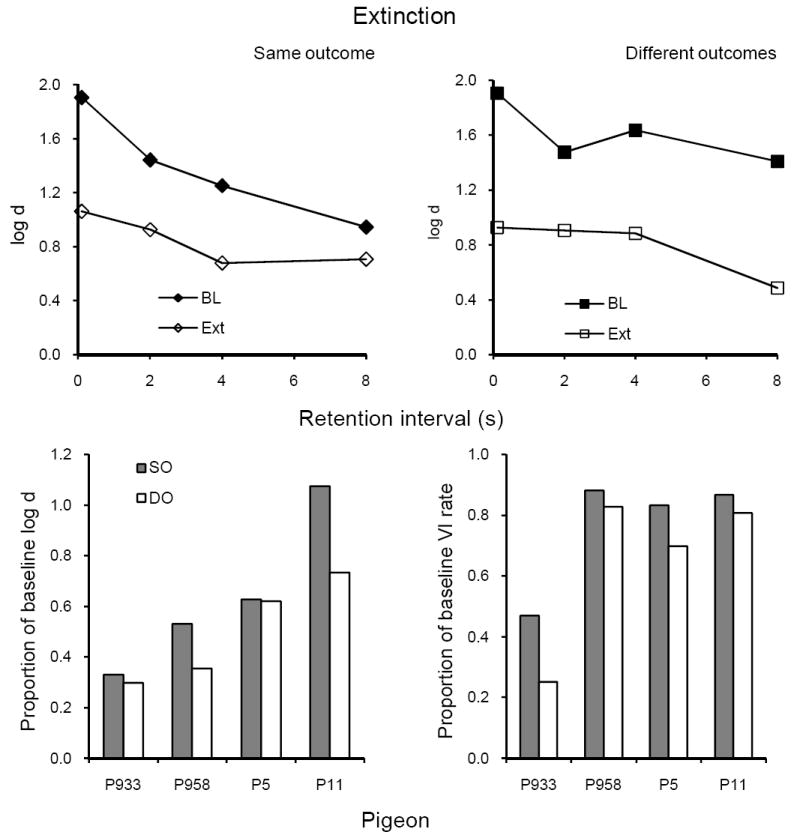
The upper panels present average forgetting functions in SO and DO components for 10 sessions of extinction and for the immediately preceding 10 sessions of baseline in Experiment 1. The lower panels present individual proportions of log d averaged over retention intervals (left panel) and VI response rates (right panel).
Summary of disruptor effects
The data for all three disruptors show that both VI response rate and DMTS accuracy were more readily disrupted in the DO than in the SO component. Examination of Table 1 shows that the average values of log d were consistently higher in DO than in SO components during baseline, but differed little (or in the reverse direction) during disruption. Thus, the DOE, expressed as the difference between average DO and SO accuracies, was effectively abolished by the disruptors arranged here.
Discussion
Experiment 1 found that DMTS performance was acquired more rapidly and to a higher level of accuracy in a multiple-schedule component with reinforcer probabilities of .9 and .1 signaled by the samples (DO), even though the alternated component had reinforcer probabilities of .9 and .9 (SO) and the sample colors were the same in both components. These results replicate those of Peterson et al. (1980) and Jones et al (1995), who also arranged same-outcome conditions that were richer overall than different-outcome conditions, and compared forgetting functions between groups or within subjects between signaled trials, respectively. Thus, during acquisition and in the steady state, the DOE is robust across procedures and conditions of reinforcement.
Disrupting performance by prefeeding, by presenting food during intercomponent intervals, and by extinction had consistently greater disruptive effects on both VI response rates and overall DMTS accuracy in the DO than in the SO component. Thus, the enhancement of baseline accuracy by differential outcomes did not entail enhanced resistance to change. Instead, it appeared that resistance to change of DMTS accuracy and VI response rates depended on overall reinforcer probability, which was .9 in the SO component and .5 in the DO component. When expressed as proportions of baseline, the effects of all three disruptors on DMTS accuracy and VI response rate were correlated across subjects, as previously reported for MTS accuracy and VI response rate by Nevin et al. (2003).
Our failure to observe sustained systematic biases in the DO component toward the comparison with the higher reinforcer probability at the end of acquisition has a precedent in the results of Santi and Roberts (1985) for their differential-outcomes group. However, the absence of bias is problematic because systematic relations between response biases, measured as log b, and the log ratios of reinforcer probabilities have been reported by many researchers (for review see Davison & McCarthy, 1988). For example, in a DMTS study, Jones and White (1992) obtained average log b values about 0.4 with 9:1 reinforcer ratios after 25 sessions training. They also found that the biasing effect of differential reinforcement was an increasing function of the retention interval. Here, log b values averaging about 0.4 were obtained in the DO component during the first 20 sessions of training (see Fig. 2) but fell to about 0 at the end of acquisition, the same level as in the SO component, with no consistent differences across retention intervals. However, Jones and White’s estimates were based on fits to biases determined at five different reinforcer ratios, whereas our bias estimates were derived from a single reinforcer ratio (9:1) and may be underestimated as a result of high accuracy levels and position or color preferences that are independent of the reinforcer ratio. Nevertheless, it is interesting to note that log d values started at similar levels in SO and DO components and diverged whereas log b values started at different levels and converged during acquisition. Evidently, bias toward the more frequently reinforced comparison was not necessary for the enhancement of discrimination accuracy by differential reinforcement with respect to the samples in our Experiment 1 or the study by Santi and Roberts cited above.
Experiment 2
A prominent interpretation of the DOE attributes higher and shallower forgetting functions to the distinctiveness of compounds comprising the samples and the differential outcome expectancies that are associated with the samples, where the expectancy-related cues are especially potent (Peterson et al., 1980; Urcuioli, 2005). Thus, DMTS accuracy in the DO component might be especially resistant to disruption during samples and/or retention intervals. In addition, because the comparisons are correlated with differential reinforcement in the same way as the samples, comparison choice may also be more resistant in the DO component. To evaluate these possibilities, we attempted to disrupt selected components of DMTS performance by arranging flashing lights as distractors concurrently with the sample stimuli, comparison stimuli, or retention interval cues. In addition, we recorded responses emitted during presentations of sample and retention-interval stimuli to determine whether there would be a relation between those responses and accuracy in SO and DO components.
Method
Subjects and Apparatus
As in Experiment 1.
Procedure
Experiment 2 began immediately after Experiment 1 with 20 sessions of baseline training; subsequently, 20 sessions of baseline retraining were given after each 10-session disruptor test.
Comparison disruption
The houselight and white center key flashed on and off every 0.2 s while the comparisons were presented on the side keys.
Retention interval disruption
The houselight and white side keys flashed on and off every 0.2 s during retention intervals, while the center key was lighted with the color signaling the SO or DO component as in baseline sessions.
Sample disruption
Flashing lights similar to those employed in the retention interval test had no effect on accuracy when presented while the sample was on (data not shown). In an effort to increase their disruptive effects, the side keys and house light flashed separately and successively in irregular order across trials. Specifically, the side keys and houselight flashed separately and successively every 0.2 s in either a clockwise (houselight followed by right key followed by left key) or counterclockwise (houselight followed by left key followed by right key) fashion. The color of the flashing side keys was white. The houselight and side keys began flashing at sample onset and continued flashing until sample termination. On each trial, the direction of the flashing houselight and side keys was randomly selected (p=.5).
Pecks on the center key during samples and retention intervals were recorded separately for S1 and S2 trials in SO and DO components in all three tests.
Results
VI response rates were essentially unchanged by any of the disruptors, with no difference between components, and will not be presented or discussed below.
Comparison disruption
Average forgetting functions based on data pooled for all 10 sessions of comparison disruption are shown in the top and middle panels of Figure 6 together with those for the immediately preceding 10 sessions of baseline; the latter are quite similar to baseline forgetting functions in Experiment 1. The bottom panel presents proportions of baseline calculated as in the analyses of Experiment 1, showing that flashing lights during comparisons had relatively small and inconsistent effects on the forgetting function in SO, with larger effects in DO for three pigeons. The difference approached statistical significance (Table 2).
Fig. 6.
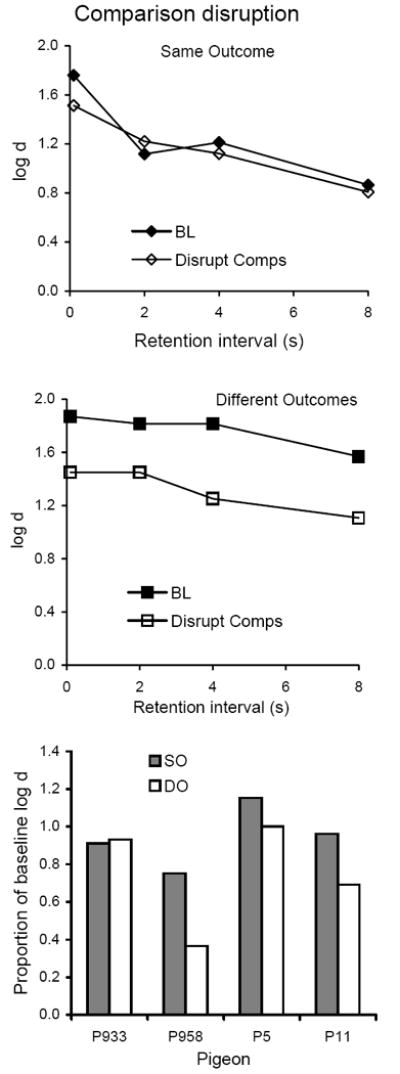
The top and middle panels present average forgetting functions in SO and DO components for 10 sessions with flashing lights presented during the comparisons and for the immediately preceding 10 sessions of baseline in Experiment 2. The bottom panel presents individual proportions of log d averaged over retention intervals.
Table 2.
Average DMTS accuracy during baseline and disruption in Experiment 2, average proportions of baseline in each of three resistance tests, and results of one-tailed t-tests (3df) of differences in proportion of baseline between SO and DO components with significant differences in boldface. The magnitude of the DOE – the difference between accuracy levels in DO and SO components – is shown in a separate column. Also shown are rates of pecking at samples S1 and S2 in the SO and DO components.
| Accuracy of discrimination -- log d | Sample pecking -- resp/min | ||||||
|---|---|---|---|---|---|---|---|
| Comparison disruption | Comparison disruption | ||||||
| SO | DO | DOE | SO S1 | SO S2 | DO S1 | DO S2 | |
| Baseline | 1.253 | 1.768 | 0.515 | 57.2 | 65.6 | 59.1 | 43.8 |
| Disrupt | 1.166 | 1.315 | 0.149 | 61.2 | 70.5 | 60.7 | 43.5 |
| Prop. BL | 0.944 | 0.748 | |||||
| t-test results | t = 2.28, p = .054 | ||||||
| Retention interval disruption | Retention interval disruption | ||||||
| SO | DO | SO S1 | SO S2 | DO S1 | DO S2 | ||
| Baseline | 1.404 | 1.689 | 0.285 | 58.6 | 70.3 | 60.7 | 40.1 |
| Disrupt | 1.075 | 1.159 | 0.084 | 58.1 | 68.7 | 57.7 | 45.6 |
| Prop. BL | 0.808 | 0.677 | |||||
| t-test results | t = 1.15, p = .167 | ||||||
| Sample disruption | Sample disruption | ||||||
| SO | DO | SO S1 | SO S2 | DO S1 | DO S2 | ||
| Baseline | 1.410 | 1.896 | 0.486 | 62.2 | 59.3 | 63.9 | 43.3 |
| Disrupt | 1.435 | 1.592 | 0.157 | 47.3 | 51.1 | 47.0 | 27.5 |
| Prop. BL | 1.032 | 0.845 | |||||
| t-test results | t = 2.83, p = .033 | ||||||
Table 2 also presents average rates of pecking the center key during sample presentations on S1 and S2 trials in SO and DO components in baseline and during disruption. In the DO component, the average rate of pecking was lower for S2 than for S1 but this difference was evident in only two of the four pigeons, and there were no consistent effects of disruption. Rates of pecking the center key during retention intervals varied idiosyncratically from 0 to 50 pecks/min in baseline and did not change systematically during disruption.
Retention interval disruption
Average forgetting functions based on data pooled for all 10 sessions of retention interval disruption are shown in the top and middle panels of Figure 7 together with those for the immediately preceding 10 sessions of baseline; the latter are quite similar to baseline forgetting functions determined in earlier conditions. Presenting flashing lights during retention intervals decreased accuracy substantially at the longer retention intervals, and had no consistent effect (as expected) at the shortest interval. Thus, forgetting function slopes became steeper. The bottom panel of Figure 7 shows that differences in proportions of baseline DMTS accuracy were inconsistent across pigeons. Although the average proportion of baseline was greater in the SO component, the difference was not statistically significant (Table 2).
Fig. 7.
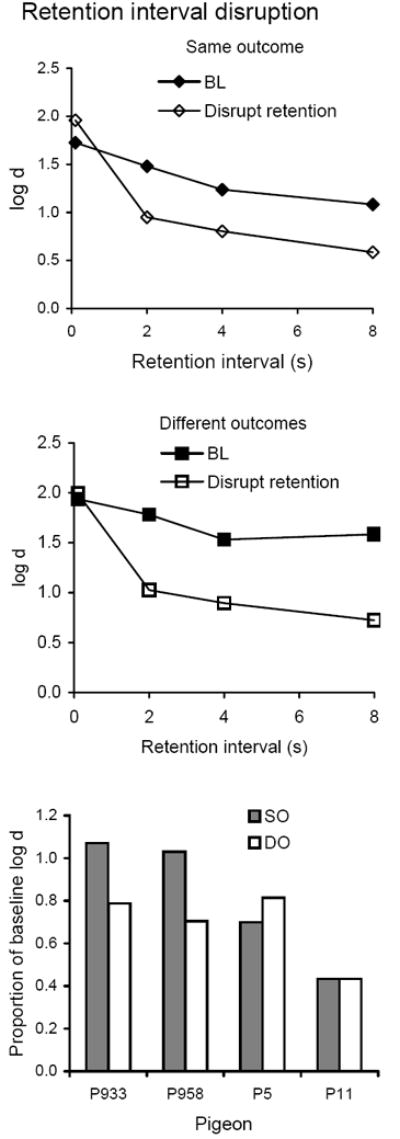
The top and middle panels present average forgetting functions in SO and DO components for 10 sessions with flashing lights during the retention intervals and for the immediately preceding 10 sessions of baseline in Experiment 2. The bottom panel presents individual proportions of log d averaged over retention intervals.
Rates of pecking the center key during sample presentations (Table 2) were similar for both samples in both components and were not affected by retention interval disruption. The difference in average pecking rates in S1 and S2 in the DO component was not consistent across subjects. Again, retention interval pecking rates varied widely and idiosyncratically so that no systematic effect of disruption could be detected.
Sample disruption
Average forgetting functions based on data pooled for all 10 sessions of sample disruption are shown in the top and middle panels of Figure 8 together with those for the immediately preceding 10 sessions of baseline; the latter are quite similar to baseline forgetting functions determined in earlier conditions. Presenting flashing lights during samples decreased the level of the forgetting function in the DO component, but had little or no effect in the SO component. The bottom panel of Figure 8 show that relative to baseline, DMTS accuracy was consistently greater during sample disruption in SO than in DO for all four pigeons; Table 2 shows that the difference was statistically significant.
Fig. 8.
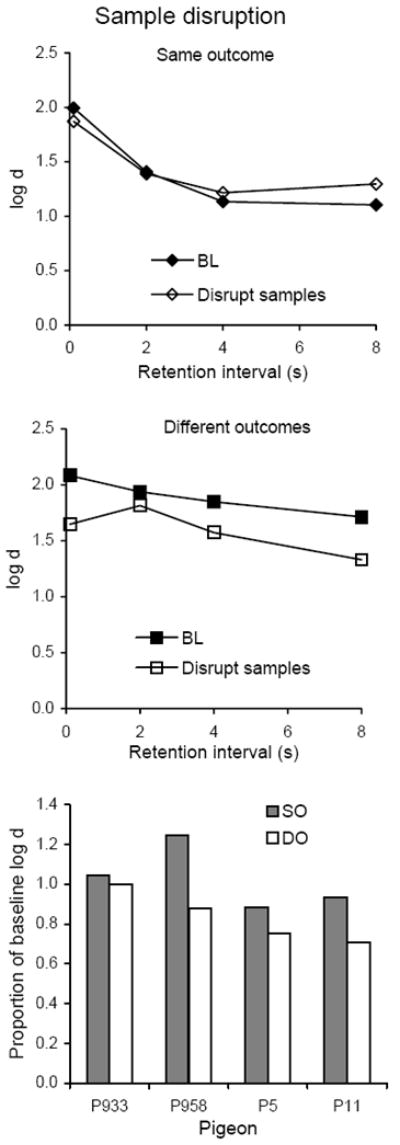
The top and middle panels present average forgetting functions in SO and DO components for 10 sessions with flashing lights presented during the samples and for the immediately preceding 10 sessions of baseline in Experiment 2. The bottom panel presents individual proportions of log d averaged over retention intervals for the first (left panel) and second (right panel) five-session blocks of disruption.
Average rates of key pecking during sample presentations are presented in Table 2, showing that pecking rates were reduced during sample disruption. Because they did not differ consistently between S1 and S2 in either component, they were pooled across samples. Response rates were reduced by flashing lights in SO (t(3) = 4.87, p = .008) and in DO (t(3) = 3.66, p = .018) but proportions of baseline were the same for SO and DO components (t(3) = 0.21, ns). Thus, the disruptor reduced sample-key pecking rates similarly in both components although accuracy was selectively disrupted in the DO component. Again, there were no consistent effects on retention-interval pecking.
Summary of disruptor effects
Flashing lights decreased the average level of the forgetting function more in DO than in SO components for all 4 pigeons when presented during the samples and for 3 of the 4 when presented during the comparisons. Moreover, the mean differences in proportional decrements in DO relative to SO components were almost identical for sample and comparison disruption: 0.191 and 0.197 for sample and comparison disruption, respectively (t(3) = 0.15, ns). This similarity occurred despite the specificity of disruptor effects on sample-key pecking, which was systematically reduced when flashing lights accompanied the samples but not when they accompanied the comparisons.
When flashing lights were presented during retention intervals, the principal effect was to increase the slopes of forgetting functions, and although the average decrease in log d resulting from the slope increase was greater in DO than in SO, the difference was smaller than for sample or comparison disruption and was less consistent across subjects. Nevertheless, inspection of Table 2 shows that the DOE was attenuated by all three disruptors.
Discussion
Experiment 2 found that presenting flashing lights during specific portions of DMTS trials affected the forgetting functions in ways that depended on the trial portion that was accompanied by those stimuli. Specifically, flashing lights presented during retention intervals made the slopes of forgetting functions steeper in both SO and DO components with relatively little difference between components. By contrast, flashing lights presented during samples or during comparisons decreased the level of the forgetting function in the DO component but had relatively little effect in the SO component. It is interesting to note that in the DO component, both samples and comparisons participate in differential relations with reinforcement, and that flashing lights during either samples or comparisons had similar effects on accuracy. Although the experiment was not designed to make exact comparisons (i.e., flashing light duration was at least 3 s with samples, whereas it lasted only until the first peck with comparisons, and the flash configurations differed between tests), these results suggest that the DOE may be similarly dependent on both of these segments of DMTS trials (see Urcuioli, 2005, for discussion of related associative interpretations).
The effect of presenting flashing lights during retention intervals was similar to that of houselight illumination (e.g., White, 1985) in that decrements were an increasing function of retention interval length with little or no effect at the 0.1-s retention interval. The absence of consistent differences between components in the degree of disruption of remembering may be attributed to disruption of discrimination between center-key colors that signaled the SO and DO components.
Although some DOE studies have observed higher response rates in the presence of the sample that signals the more favorable outcome (e.g., Alling, Nickel, & Poling, 1991; Santi & Roberts, 1985), there were no consistent differences between center-key pecking at the two samples in the DO component in our data. Thus, differential overt responding is not necessary for the DOE in steady-state baseline conditions (see also Urcuioli, 2005).
Experiment 3
As noted above, the DOE may be based on enhanced discriminability and memorability of compounds consisting of the samples plus cues arising from learned reinforcer expectancies (Urcuioli, 2005). Whatever the basis of the DOE, our data do not suggest that enhanced DMTS accuracy entails enhanced resistance to disruption. In Experiment 1, disruption by prefeeding, by ICI food, and by extinction decreased the levels of forgetting functions in the DO component to a consistently greater extent than in the SO component. In Experiment 2, flashing lights presented during the samples or the comparisons decreased forgetting function levels in the DO component but had little or no effect in the SO component. These results suggest that for resistance to change, the strengthening effects of more frequent reinforcement in the SO component may have overshadowed any enhancement of DMTS performance by sample-specific reinforcer expectancies in the DO component. However, if reinforcer frequencies were equated between components, the effects of reinforcer expectancies in the DO component might become evident during tests of resistance to change. Likewise, disruptors presented during retention intervals made the slopes of forgetting functions steeper in both components, with no consistent difference between components in the magnitude of the effect; if reinforcer probabilities were equated, an effect of sample-specific reinforcer expectancies on the strength of remembering might emerge. Accordingly, we retrained the pigeons with reinforcer probabilities of .5 and .5 in the SO component so that overall reinforcer probability was the same as in the DO component, where reinforcer probabilities remained .9 and .1. We then evaluated the disruptive effects of prefeeding, flashing lights during samples, flashing lights during retention intervals, and extinction, as in Experiments 1 and 2.
Method
Subjects and Apparatus
As in Experiments 1 and 2.
Method
Directly after completing Experiment 2, the pigeons were retrained on the VI DMTS procedure with exactly the same parameters as in Experiments 1 and 2 except that reinforcer probability in the SO component was .5 for correct responses following both samples. For Pigeons 5 and 11, the center key colors signaling SO and DO components were the same as in Experiments 1 and 2, and for Pigeons 933 and 958, the colors were reversed. The pigeons were trained for at least 50 sessions and until there was evidence of the DOE for all four. Resistance to change was evaluated in four successive tests each lasting for 10 sessions: 1) prefeeding; 2) flashing lights during the samples; 3) flashing lights during the retention intervals; and 4) extinction. Tests 1 and 4 were conducted exactly as in Experiment 1, and Tests 2 and 3 were conducted exactly as in Experiment 2. A minimum of 15 sessions of baseline training intervened between resistance tests.
Results
Baseline
Figure 9 presents individual forgetting functions for the 10-session block immediately before the first resistance test, showing that the forgetting functions were higher and generally shallower in the DO than in the SO component, replicating the DOE. Forgetting functions for Pigeons 933 and 958 were similar to those in Figure 2 for Experiment 1 even though the center-key colors signaling SO and DO components had been reversed.
Fig. 9.
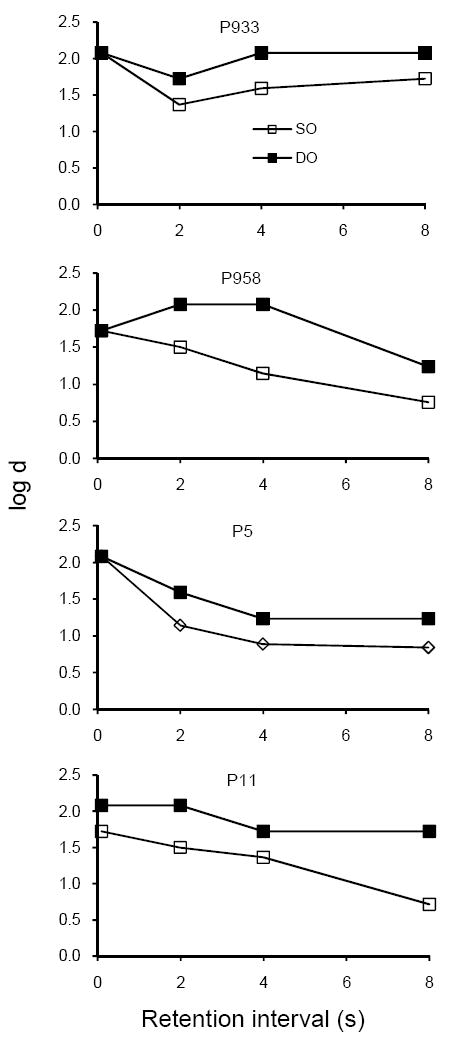
Forgetting functions for individual pigeons in SO and DO components for data pooled over the final 10 sessions of baseline training before disruptors were introduced in Experiment 3.
Inspection of Tables 1 and 3 shows that average response rates during the VI segments were somewhat higher in the DO than in the SO component in Experiment 3, reversing the average difference observed in Experiment 1 where reinforcer rate was greater in the SO component. However, the reversal was not consistent across subjects.
Table 3.
Average DMTS accuracy and VI response rates during baseline and disruption in Experiment 3, average proportions of baseline in each of four resistance tests, and results of two-tailed t-tests (3df) of differences in proportion of baseline between SO and DO components. The magnitude of the DOE – the difference between accuracy levels in DO and SO components – is shown in a separate column. Response rate data are given only for conditions in which disruptors were effective (prefeeding and extinction). Also shown are rates of pecking at samples S1 and S2 in the SO and DO components.
| DMTS accuracy -- log d | VI responses/min | Sample pecking -- resp/min | |||||||
|---|---|---|---|---|---|---|---|---|---|
| Prefeeding | |||||||||
| SO | DO | DOE | SO | DO | SO S1 | SO S2 | DO S1 | DO S2 | |
| Baseline | 1.386 | 1.804 | 0.418 | 109.4 | 120.3 | 60.0 | 69.2 | 63.0 | 46.6 |
| Disrupt | 1.004 | 1.294 | 0.289 | 61.4 | 74.9 | 59.4 | 61.8 | 63.9 | 44.3 |
| Prop. BL | 0.726 | 0.711 | 0.589 | 0.618 | |||||
| t-test results | t = 0.27, p = .800 | t = 0.80, p = .480 | |||||||
| Sample disruption | |||||||||
| SO | DO | SO S1 | SO S2 | DO S1 | DO S2 | ||||
| Baseline | 1.381 | 1.874 | 0.492 | 56.6 | 63.7 | 59.4 | 40.0 | ||
| Disrupt | 1.143 | 1.497 | 0.354 | 51.5 | 60.7 | 52.8 | 39.0 | ||
| Prop. BL | 0.880 | 0.814 | |||||||
| t-test results | t = 0.61, p = .584 | ||||||||
| Retention interval disruption | |||||||||
| SO | DO | SO S1 | SO S2 | DO S1 | DO S2 | ||||
| Baseline | 1.381 | 1.874 | 0.492 | 53.4 | 62.5 | 56.4 | 37.8 | ||
| Disrupt | 1.089 | 1.412 | 0.323 | 53.2 | 60.4 | 57.7 | 37.9 | ||
| Prop. BL | 0.790 | 0.759 | |||||||
| t-test results | t = 0.41, p = .708 | ||||||||
| Extinction | |||||||||
| SO | DO | SO | DO | SO S1 | SO S2 | DO S1 | DO S2 | ||
| Baseline | 1.316 | 1.874 | 0.557 | 110.5 | 125.0 | 54.3 | 58.2 | 56.9 | 36.6 |
| Disrupt | 0.888 | 1.053 | 0.165 | 81.4 | 99.3 | 60.8 | 63.5 | 63.2 | 42.0 |
| Prop. BL | 0.667 | 0.572 | 0.771 | 0.831 | |||||
| t-test results | t = 0.85, p = .458 | t = 1.41, p = .253 | |||||||
Resistance tests
Prefeeding
Average forgetting functions based on data pooled for the 10 sessions with prefeeding 30 g of pigeon chow 30 min before sessions are shown in the upper panels of Figure 10 together with those for the preceding 10 sessions of baseline (from the individual data in Figure 9). Prefeeding decreased the levels of the forgetting functions about equally in both components. The lower panels of Figure 10 show that individual proportions of baseline log d and of VI response rate did not differ consistently between components. For statistical evaluation, we employed two-tailed t-tests for matched pairs on the ground that a reliable difference between components in either direction would be equally interesting; in fact, none of the conclusions presented below would have differed if we had used one-tailed tests. Table 3 shows that the average proportions of baseline log d and VI response rate in SO and DO did not differ significantly. Despite the lack of consistent differences in proportions of baseline log d and VI response rate, their magnitudes were highly correlated across subjects (r = .93). There were no consistent effects of prefeeding on key pecking during the samples (Table 3) or the retention intervals.
Fig. 10.
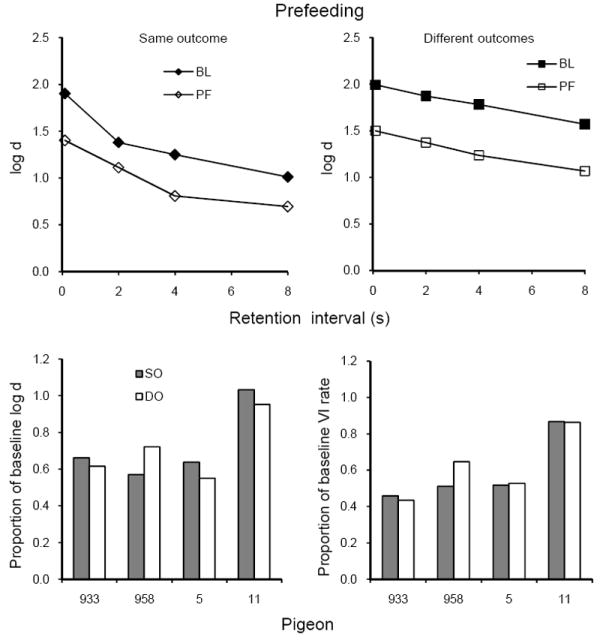
The upper panels present average forgetting functions in SO and DO components for 10 sessions of prefeeding (PF) and for the immediately preceding 10 sessions of baseline in Experiment 3. The lower panels present individual proportions of log d averaged over retention intervals (left panel) and VI response rates (right panel).
Sample disruption
Average forgetting functions based on data pooled for 10 sessions with flashing lights presented during the samples are shown in top and middle panels of Figure 11 together with those for the preceding 10 sessions of baseline; the latter are quite similar to baseline forgetting functions determined in earlier conditions. Sample disruption decreased the levels of the average forgetting functions somewhat more in the DO than in the SO component, but the bottom panel of Figure 11 shows that individual proportions of baseline log d did not differ consistently between components; the difference was not statistically significant (Table 3). As in Experiment 2, there were no effects on VI response rates (not shown). As shown in Table 3, sample disruption decreased average sample-key pecking for all four pigeons, but the decreases were smaller and less consistent than in Experiment 2 (in SO, t(3) = 0.95, ns, and in DO, t(3) = 1.22, ns). There were no consistent effects of sample disruption on key pecking during the retention intervals, which varied idiosyncratically from 0 to 150 pecks/min.
Fig. 11.
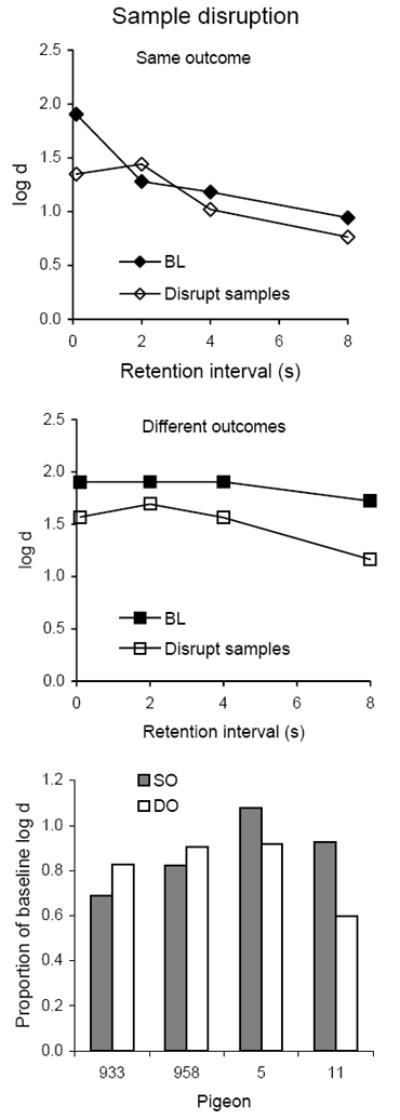
The top and middle panels present average forgetting functions in SO and DO components for 10 sessions with flashing lights presented during the samples and for the immediately preceding 10 sessions of baseline in Experiment 3. The bottom panel presents individual proportions of log d averaged over retention intervals.
Retention interval disruption
Average forgetting functions based on data pooled for all 10 sessions with flashing lights presented during retention intervals are shown in the top and middle panels of Figure 12 together with those for the immediately preceding 10 sessions of baseline; the latter are quite similar to baseline forgetting functions determined in earlier conditions. Retention interval disruption decreased accuracy substantially at the longer retention intervals, and had little effect at the shortest interval. On average, the decrease was greater in the DO component, but the bottom panel of Figure 12 shows that individual proportions of baseline log d did not differ consistently between components; the difference was not statistically significant (Table 3). Again, there were no effects on VI response rate (not shown). As in Experiment 2, rates of pecking the center key during sample presentations were not affected by retention interval disruption (Table 3), and retention interval pecking rates varied widely and idiosyncratically so that no systematic effect could be detected.
Fig. 12.
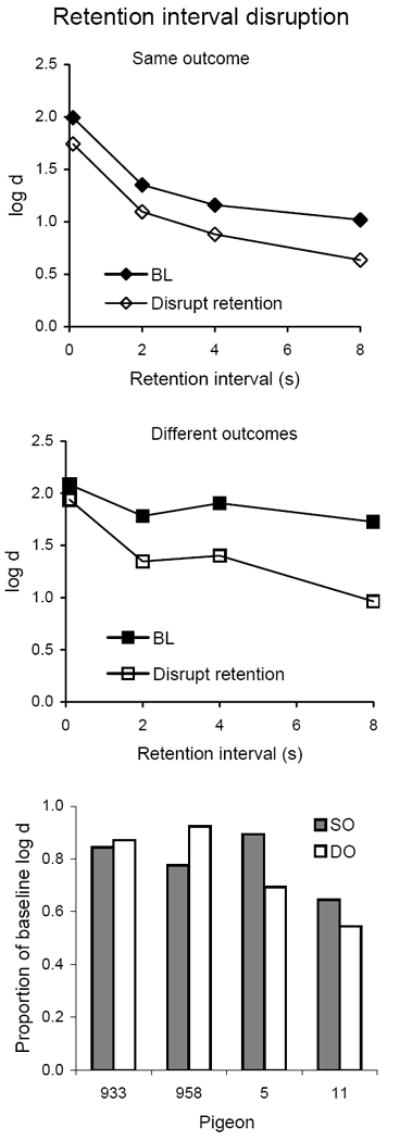
The top and middle panels present average forgetting functions in SO and DO components for 10 sessions with flashing lights during the retention intervals and for the immediately preceding 10 sessions of baseline in Experiment 3. The bottom panel presents individual proportions of log d averaged over retention intervals.
Extinction
Average forgetting functions based on data pooled for all 10 sessions of extinction are shown in the upper panels of Figure 13 together with those for the immediately preceding 10 sessions of baseline; the latter are quite similar to baseline forgetting functions in earlier conditions. Extinction clearly reduced the levels of the forgetting functions in both components; on average, the decrease was somewhat greater in the DO component. As shown in the lower panels, proportions of baseline average log d were greater in SO than in DO for 3 of the 4 pigeons, whereas the opposite was true for VI response rates. These differences were not statistically significant (Table 3). Proportions of baseline log d and VI response rate were moderately correlated across subjects (r = .52). On average, sample pecking rates increased during extinction while average accuracy decreased.
Fig. 13.
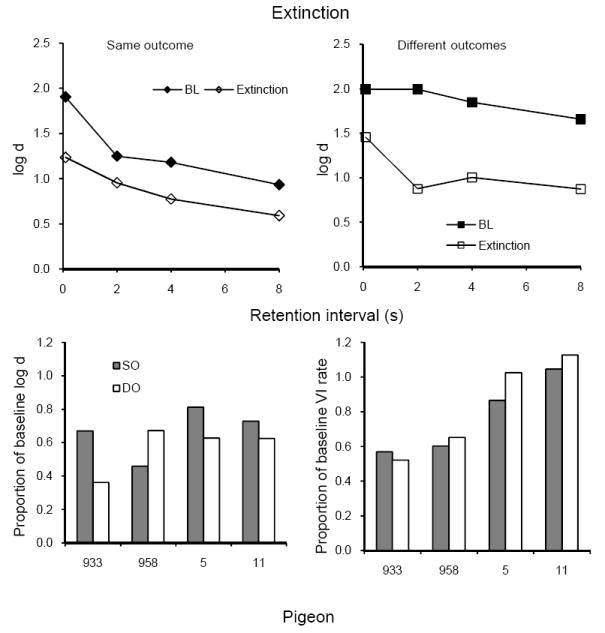
The upper panels present average forgetting functions in SO and DO components for 10 sessions of extinction and for the immediately preceding 10 sessions of baseline in Experiment 3. The lower panels present individual proportions of log d averaged over retention intervals (left panel) and VI response rates (right panel).
Discussion
In Experiment 3, the overall probability of reinforcement was the same in components with same (SO) and different (DO) reinforcer probabilities associated with the samples. For every subject in every baseline determination, forgetting functions were higher and usually shallower in the DO component, replicating many previous studies of the DOE as well as the results of Experiments 1 and 2 (see Urcuioli, 2005, for review). Unlike Experiments 1 and 2, in which reinforcer rates were higher in the SO component, resistance to change was similar in the two components in Experiment 3. Thus, the DOE – the difference between forgetting function levels in SO and DO components – survived disruption, although its average magnitude was attenuated by all four disruptors (Table 3). In sum, there was no evidence that differential outcomes enhanced the resistance of DMTS performance to prefeeding, to flashing lights during samples or retention intervals, or to extinction. Relatedly, Santi and Roberts (1985) found no differences between differential and nondifferential groups with equated overall reinforcer probability in resistance to short-term variations in intertrial- or retention-interval durations despite consistently higher accuracy in the differential-outcomes group.
General Discussion
The foregoing experiments arranged different reinforcer probabilities correlated with the samples (DO) in one component of a multiple schedule where responding produced DMTS trials according to a VI schedule (the VI DMTS paradigm), and the same reinforcer probabilities (SO) in the alternated component. The major results of these experiments are: 1) DMTS forgetting functions were higher and generally shallower in DO than in SO components even when the latter provided greater total reinforcement; and 2) Between-component differences in the resistance to change of DMTS accuracy depended on differences in total reinforcement and not on differences in accuracy arising from differential versus nondifferential reinforcement. These results are summarized in Figure 14, which shows that values of log d averaged over retention intervals and subjects for successive baseline determinations were consistently higher in the DO than in the SO component, and that the difference was greatest in Experiment 3 where reinforcer probabilities were the same. Figure 14 also shows that average proportions of baseline during disruption were greater in the SO than in the DO component, although the difference was small and inconsistent in Experiment 3.
Fig. 14.
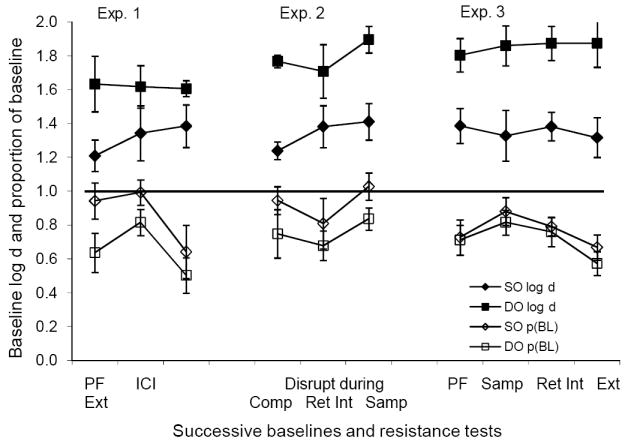
A summary of major results of all three experiments. The filled squares and diamonds give the average baseline values of log d in DO and SO components, respectively, and the unfilled squares and diamonds give the average values of proportions of baseline log d with the disruptors indicated on the x-axis. Range bars indicate standard errors.
The baseline results replicate those of Peterson et al. (1980) in a between-group design, and of Jones et al. (1995) in a within-subject, signaled-magnitude paradigm for cases with greater total reinforcement in SO than in DO conditions, as well as many other studies that equated total reinforcement between SO and DO conditions (see Urcuioli, 2005, for review). The results for resistance to change extend and refine those of Odum et al. (2005), who found that the resistance to change of DMTS forgetting functions depended directly on total reinforcement in a component. In that study, baseline accuracy also depended directly on total reinforcement, so that resistance to change could have been affected by accuracy levels as well as total reinforcement. Here, we have dissociated those potential determiners of resistance to change by showing that resistance to change depends on total reinforcement and not on differences in baseline accuracy. These results parallel the dissociation of steady-state response rate and resistance to change in research on free-operant performance on multiple schedules of reinforcement (see Nevin & Grace, 2000 for review).
Nevin, Davison, Odum, and Shahan (2007) proposed a quantitative model of DMTS performance that accounts for the differences in baseline levels and resistance to change reported by Odum et al. (2005). Briefly, the model assumes that the probabilities of attending to the samples and comparisons in DMTS trials depend directly on reinforcer rates and inversely on the magnitudes of disruptors such as prefeeding, extinction, or distractors within DMTS trials. Thus, attending occurs with higher probability and is less disrupted in a condition with more frequent reinforcement, leading to higher levels and greater resistance to change of DMTS accuracy in that condition as found by Odum et al. Thus, the model accounts for resistance to change in the present experiments. It does not, however, account for the strong and consistent DOE in baseline.
The model can be adapted to predict the DOE in baseline by assuming independent attending to the samples and to the expectancies of reinforcement correlated with those samples. From a behavioral perspective, expectancies are private activities, and the activity of expecting high-probability reinforcement is likely to differ from the activity of expecting low-probability reinforcement. Presumably, those activities provide discriminable cues that are functionally the same as the samples in signaling the correct comparisons, and can form compounds with the samples that might enhance accuracy.1 (Note that when reinforcer probabilities are the same, expecting and its cues are nondifferential with respect to the outcomes, and comparison choice must be based on the samples only.) If attending to the samples and to the expectancy cues are like overt activities such as key pecking, disruptors such as distraction by competing activities during baseline sessions should have a somewhat greater effect in a component with lower overall reinforcer probability. Nevertheless, comparison choice will be correct if attending either to the samples or to expectancy cues persists throughout a given trial because both predict the correct choice. As a result, overall baseline accuracy may be greater with different outcomes despite less frequent reinforcement. During resistance tests when more potent disruptors are deployed, however, this advantage may be eliminated or reversed.
Although a quantitative development of these speculations is beyond the scope of this paper, it is possible that the present Experiments 1 and 2, by chance, have employed reinforcer probabilities and disruptors that allow both greater baseline accuracy and lower resistance to change in the DO component. For example, if the SO reinforcer probability was .9 but the DO probabilities were .09 and .01 instead of .9 and .1, the DOE might be abolished during baseline sessions because the reduction in total reinforcement would lower attending (and hence accuracy) in the DO component so much as to overwhelm any advantage resulting from redundant sample and expectancy cues.
More generally, the Nevin et al. (2007) model predicts that the magnitude of the DOE should depend directly on the ratio of total DO to total SO reinforcement. Jones et al. (1995) provide some relevant data. They arranged reinforcer durations of 3.5 and 0.5 s on signaled different-outcome trials, and over three conditions arranged 0.5 s, 3.5s, or 1.5 s durations on signaled same-outcome trials (the second of these was cited above for finding a reliable within-subject DOE despite greater overall reinforcement in same-outcome trials). Jones et al. presented individual parameter values for the intercepts and slopes of exponential functions fitted to their forgetting functions, and reported that there was no reliable effect of SO reinforcer duration on the intercepts or slopes of their forgetting functions. However, they did not examine the differences between pairs of forgetting functions across conditions, which define the magnitude of the DOE as reported here. Accordingly, we estimated the values of log d at their retention intervals of 0.01, 1, 4, and 8 s from the intercept and slope parameter values in their Table 3 and averaged them over subjects and retention intervals to give a number directly comparable to our value of log d averaged over subjects for the same range of retention intervals. We then calculated the difference between means for DO and SO trials – i.e., the magnitude of the DOE. Figure 15 shows that as the log ratio of total DO to total SO reinforcement increased over conditions, the magnitude of the DOE tended to increase, being greater at the highest than at lowest ratio for 4 of their 5 pigeons and greater at the highest than at the intermediate ratio for all 5 pigeons. Figure 15 also presents a comparable treatment of our average DOE values in Experiment 1, 2, and 3, confirming the upward trend. The suggested conclusion is that the magnitude of the DOE depends directly on the total DO/SO reinforcer ratio. Extrapolating back to 0 on the y-axis, the DOE should be abolished at a log ratio about -1.0. Although it may be difficult to arrange such an extreme ratio experimentally, the DOE should be evaluated over a wider range of DO/SO reinforcer ratios in order to provide parametric data that would test model predictions and evaluate the range of reinforcement conditions over which this truly robust phenomenon is observed.
Fig. 15.
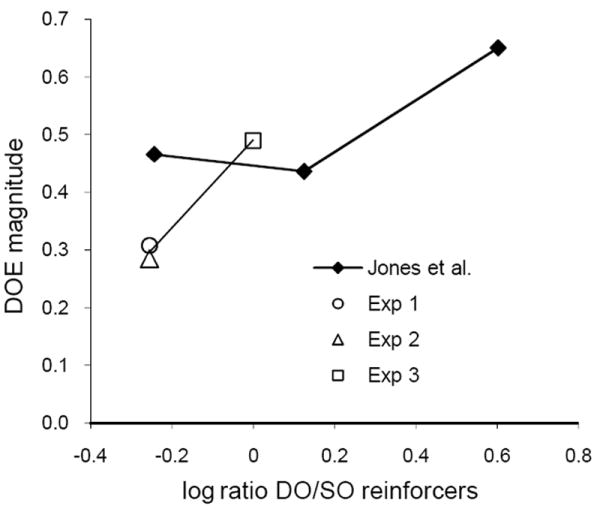
The magnitude of the DOE (i.e., the difference between average log d values with differential and nondifferential outcomes) as a function of the log ratio of total differential to nondifferential reinforcement. Filled diamonds present estimated differences for signaled differential and nondifferential trials in the study by Jones et al. (1995); see text for calculation. The unfilled symbols give average differences for the baseline conditions averaged within the present Experiments 1, 2, and 3.
Acknowledgments
This study was supported by NIMH Grant 65949 to the University of New Hampshire; the experiments were conducted at Utah State University. We thank Peter Urcuioli for stimulating discussions, and two reviewers for helpful comments on an earlier version of this article.
Footnotes
Peterson and Trapold (1980) presented a similar account of the DOE and tested it in a series of transfer experiments. We are indebted to an anonymous reviewer for bringing their paper to our attention.
Publisher's Disclaimer: The following manuscript is the final accepted manuscript. It has not been subjected to the final copyediting, fact-checking, and proofreading required for formal publication. It is not the definitive, publisher-authenticated version. The American Psychological Association and its Council of Editors disclaim any responsibility or liabilities for errors or omissions of this manuscript version, any version derived from this manuscript by NIH, or other third parties. The published version is available at www.apa.org/journals/xan.
References
- Alling K, Nickel M, Poling A. The effects of differential and nondifferential outcomes on response rates and accuracy under a delayed-matching-to-sample procedure. The Psychological Record. 1991;41:537–549. [Google Scholar]
- Brown GS, White KG. The optimal correction for estimating extreme discriminability. Behavior Research Methods. 2005;37:436–449. doi: 10.3758/bf03192712. [DOI] [PubMed] [Google Scholar]
- Catania AC, Matthews TJ, Silverman PJ, Yohalem R. Yoked variable-ratio and variable-interval responding in pigeons. Journal of the Experimental Analysis of Behavior. 1977;28:155–161. doi: 10.1901/jeab.1977.28-155. [DOI] [PMC free article] [PubMed] [Google Scholar]
- Davison M, McCarthy DC. The matching law: A research review. Hillsdale, NJ: Erlbaum; 1988. [Google Scholar]
- Davison MC, Tustin RD. The relation between the generalized matching law and signal-detection theory. Journal of the Experimental Analysis of Behavior. 1978;29:331–336. doi: 10.1901/jeab.1978.29-331. [DOI] [PMC free article] [PubMed] [Google Scholar]
- Jones BM, White KG. Sample-stimulus discriminability and sensitivity to reinforcement in delayed matching to sample. Journal of the Experimental Analysis of Behavior. 1992;58:159–172. doi: 10.1901/jeab.1992.58-159. [DOI] [PMC free article] [PubMed] [Google Scholar]
- Jones BM, White KG. An investigation of the differential-outcomes effect within sessions. Journal of the Experimental Analysis of Behavior. 1994;61:389–406. doi: 10.1901/jeab.1994.61-389. [DOI] [PMC free article] [PubMed] [Google Scholar]
- Jones BM, White KG, Alsop BA. On two effects of signaling the consequences of remembering. Animal Learning and Behavior. 1995;23:256–272. [Google Scholar]
- Matthews TJ, Shimoff E, Catania AC, Sagvolden T. Uninstructed human responding: sensitivity to ratio and interval contingencies. Journal of the Experimental Analysis of Behavior. 1977;27:453–467. doi: 10.1901/jeab.1977.27-453. [DOI] [PMC free article] [PubMed] [Google Scholar]
- Nevin JA, Davison M, Odum AL, Shahan TA. A theory of attending, remembering, and reinforcement in delayed matching to sample. Journal of the Experimental Analysis of Behavior. 2007;88:285–317. doi: 10.1901/jeab.2007.88-285. [DOI] [PMC free article] [PubMed] [Google Scholar]
- Nevin JA, Grace RC. Behavioral momentum and the law of effect. Behavioral and Brain Sciences. 2000;23:73–130. doi: 10.1017/s0140525x00002405. [DOI] [PubMed] [Google Scholar]
- Nevin JA, Grace RC, Holland S, McLean AP. Variable-ratio versus variable-interval schedules: Response rate, resistance to change, and preference. Journal of the Experimental Analysis of Behavior. 2001;76:43–74. doi: 10.1901/jeab.2001.76-43. [DOI] [PMC free article] [PubMed] [Google Scholar]
- Nevin JA, Milo J, Odum AL, Shahan TA. Accuracy of discrimination, rate of responding, and resistance to change. Journal of the Experimental Analysis of Behavior. 2003;79:307–321. doi: 10.1901/jeab.2003.79-307. [DOI] [PMC free article] [PubMed] [Google Scholar]
- Odum AL, Shahan TA, Nevin JA. Resistance to change of forgetting functions and response rates. Journal of the Experimental Analysis of Behavior. 2005;84:65–75. doi: 10.1901/jeab.2005.112-04. [DOI] [PMC free article] [PubMed] [Google Scholar]
- Peterson GB, Trapold MA. Effects of altering outcome expectancies on pigeons’ delayed conditional discrimination performance. Learning and Motivation. 1980;11:267–288. [Google Scholar]
- Peterson GB, Wheeler RL, Trapold MA. Expectancies as mediators in the differential-reward conditional discrimination performance of pigeons. Animal Learning and Behavior. 1980;8:22–30. [Google Scholar]
- Santi A, Roberts WA. Reinforcement expectancy and trial spacing effects in delayed matching-to-sample by pigeons. Animal Learning and Behavior. 1985;13:274–284. [Google Scholar]
- Schaal DW, Odum AL, Shahan TA. Pigeons may not remember the stimuli that reinforced their behavior. Journal of the Experimental Analysis of Behavior. 2000;73:125–139. doi: 10.1901/jeab.2000.73-125. [DOI] [PMC free article] [PubMed] [Google Scholar]
- Trapold MA. Are expectancies based on different positive reinforcing events discriminably different? Learning and Motivation. 1970;1:129–140. [Google Scholar]
- Urcuioli PJ. Behavioral and associative effects of differential outcomes in discrimination learning. Learning and Behavior. 2005;33:1–21. doi: 10.3758/bf03196047. [DOI] [PubMed] [Google Scholar]
- Urcuioli PJ, Zentall TR. Transfer across delayed discriminations: Evidence regarding the nature of prospective working memory. Journal of Experimental Psychology: Animal Behavior Processes. 1992;18:154–173. doi: 10.1037//0097-7403.18.2.154. [DOI] [PubMed] [Google Scholar]
- White KG. Characteristics of forgetting functions in delayed matching to sample. Journal of the Experimental Analysis of Behavior. 1985;44:15–34. doi: 10.1901/jeab.1985.44-15. [DOI] [PMC free article] [PubMed] [Google Scholar]


